4 Lesson 4: Projecting Trends and Designing for Adaptation
Welcome to Adaptation Strategies
Projecting Trends and Designing for Adaptation
In this lesson you will:
- study a framework to address climate and global change issues in conservation planning
- discuss projected trends in climate and the resulting simulated climate impacts and uncertainties
- examine and design conservation strategies to prepare for future direct and indirect effects of climate and global change
- explore an example of planning for climate adaptation with GIS
- summarize and synthesize concepts, approaches, tools, and skills learned in the course
Chapters 13 and 15 in Craighead and Convis accompany this lesson.
Lesson Topics
This lesson will cover four topics and take approximately 50-60 minutes to complete. We recommend working through each topic in the order in which they are listed below.
- The Climate Challenge in Conservation Planning
- Climate Models and Projections
- Application of Climate Adaptation Planning
- Course Summary and Synthesis
The Climate Challenge in Conservation Planning
Introduction: The Climate Challenge in Conservation Planning
What is the magic cookbook with recipes for managers to meet the climate change challenge?
Of course there is no single answer or recipe. Today practitioners recognize and prepare for a future world that is changing
- a world that may include higher sea levels, warmer ocean temps, more acidic seawater, more intense storms, lower snowpacks, more frequent fires, etc.
- a world that also faces increasing land use pressure
- a world that will experience continued natural climate variability.
Rather than a cookbook, we will need to increase our resilience to inevitable change and seize emerging opportunities as the climate shifts
– this is the essential crux of adaptation strategies.
For example, we could use this time to design new coastlines where natural vegetation is protected from development as sea level rises and that can buffer inland human structures from storm surges.
Defining Conservation Planning (in a changing climate)
Pressy et al. (2005) defined conservation planning as the process of locating and designing conservation areas to promote the persistence of biodiversity in situ.
Yet changing climates might lead to no-analog communities or ecological surprises that don’t fit neatly into spatially constrained conservation areas.
Effective conservation planning includes the gathering and understanding of crucial information on the threats (e.g. climate change) to biodiversity and on the vulnerability of conservation areas to those threats.
Frameworks to Adapt Conservation to Changing Climates
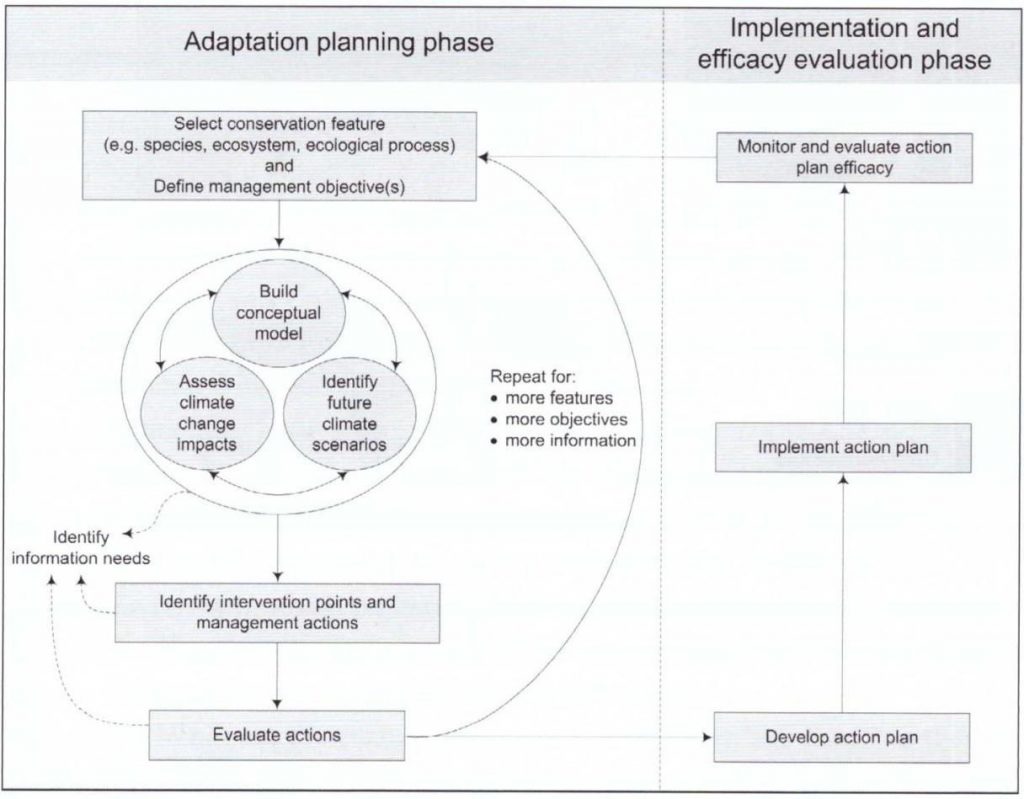
A straightforward framework to address climate change issues in conservation planning was developed by Cross and colleagues (Cross et al, 2012), see below.
- a feature of interest or concern is chosen in regard to climate change challenges
- a clear management objective is necessary so that it is possible to evaluate when the objective has been met
- put together a conceptual model for the system of interest
- identify intervention points and management actions
- evaluate the feasibility of suggested strategies, prioritize and implement them, and monitor their effectiveness
Mediterranean Climate Extent
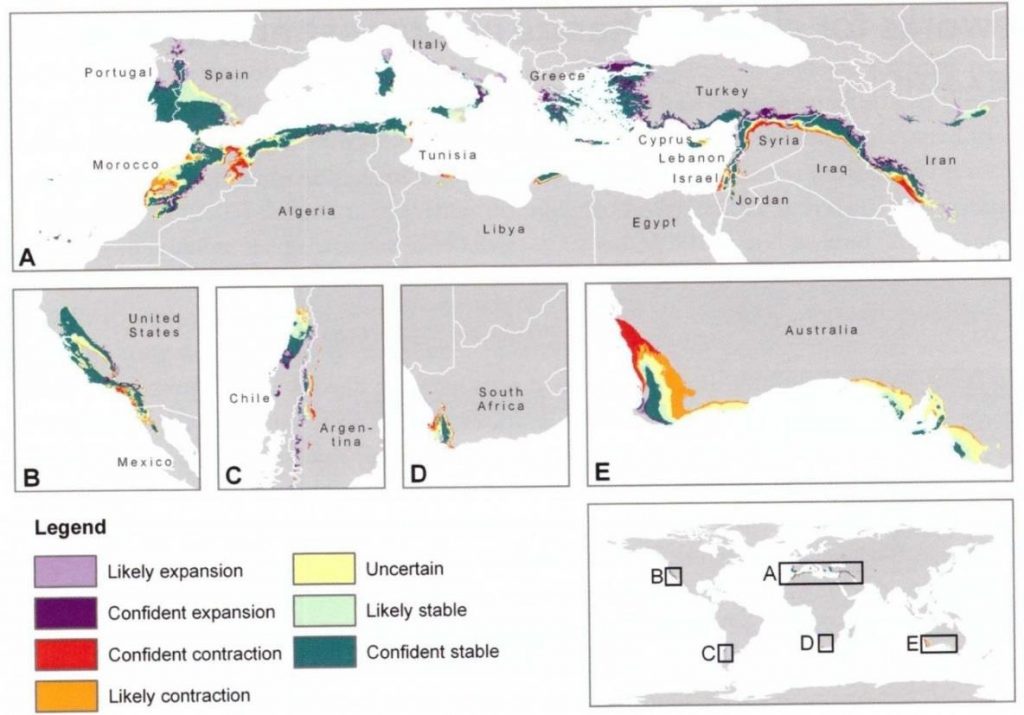
As an example of using the framework, Klausmeyer and Shaw (2009) identified the Mediterranean climate as the feature of concern. They defined the present spatial extent of the Mediterranean climate extent using current climate indices. Then, they analyzed projections of future climate conditions to develop the map of the future spatial extent of the Mediterranean climate below (downloadable map at http://bit.ly/Lg9wXV). The extents of Mediterranean climate under the A2 emissions scenario were mapped with various levels of confidence regarding their regional expansion or contraction. One of the areas with the most projected change identified was the west coast of Australia, where climate is projected to remain characteristic of Mediterranean lands in only 10% of protected areas.
The Yale Framework
The large number and diversity of models and data that can be applied to climate impact analysis and adaptation strategies can be confusing. In response, the Yale School of Forestry Environmental Sciences convened a working group of leading conservation biologists, modelers, and policy makers to develop guidance for integrating climate change adaptation strategies into natural resource planning and policy making.
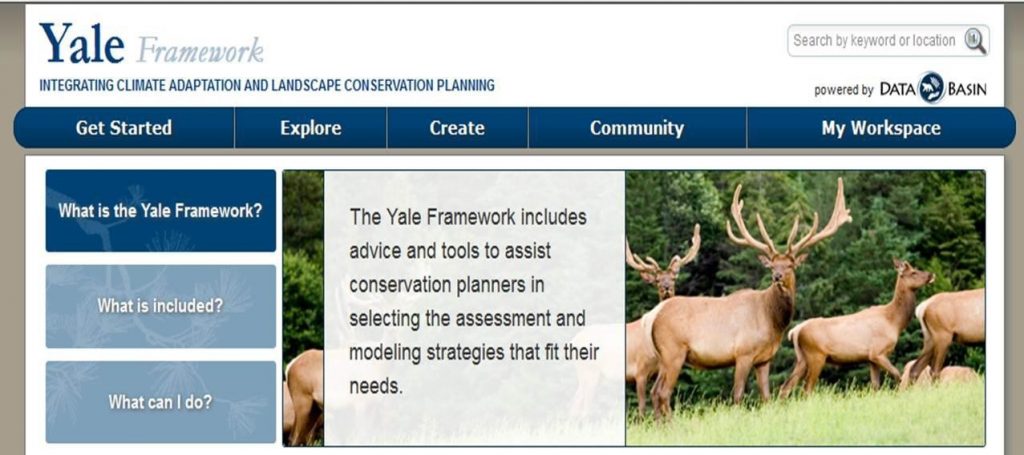
The framework offers insights on how to:
- Establish baselines of current environmental conditions
- Identify which ecological features will be most vulnerable
- Visualize the future needs of the most vulnerable species, ecosystems, and landscapes
The Yale Framework recommends the following six adaptation approaches that can be applied at three distinct levels of ecological organization – landscapes, ecosystems, and species and populations.
- What are the current patterns of biodiversity, and how can they be conserved?
- What will the future patterns of biodiversity look like across a varied landscape?
- What is the best way to maintain ecological processes?
- How can ecological connectivity be best maintained and restored?
- What areas are predicted to have relatively stable climate over the long term?
- What on-the-ground environmental conditions are best suited to provide habitats for the native plant and animal species of a region, allowing them to persist in a climate-change era?
Click here to explore the Yale Framework online.
Climate Models and Projections
Projected Trends in Climate Change
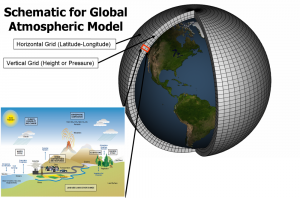
There are many different atmosphere-oceanic global circulation models (AOGCM’s) used to project future climate conditions. The Intergovernmental Panel on Climate Change (IPCC) and many other analyses of climate change use an ‘ensemble approach,’ which considers the outputs of many models. This approach provides a means to overcome the limitations and errors in different AOGCM simulations. The mean ensemble values are thought to outperform individual modeling results and bound the range of possible future conditions. The IPCC refers to this as a ‘best estimate forecast’ (Solomon et al. 2007).
Models generally agree for the 1st half of the century, so the specific model or scenario is less important for climate goals within the next few decades.
General Climate Trends
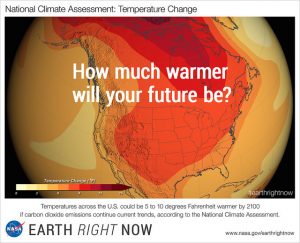
Temperature
Globally, general warming is projected, but with regional and local patchiness, resulting in 1) an overall decrease in the longevity, extent, and thickness of glaciers, ice sheets, and snowpacks, and 2) projected sea level rise.
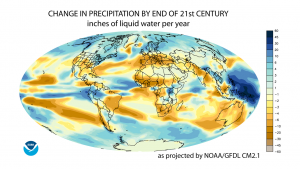
Precipitation
There is a likely increase in global mean precipitation but again with large spatial and seasonal variation.
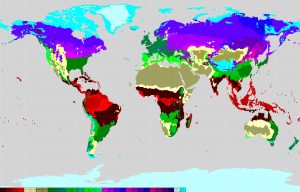
Climate zones
Along with changes in temperature and precipitation scientists have projected changes in climate zones across the globe.
Extreme events
Intense droughts, floods, storms, etc. are perhaps the most unpredictable projected change, with the greatest potential to shape our landscapes.
Therefore, it is important for practitioners, along with scientists and decision-makers, to simulate disturbances to better understand resilience of systems.
Climate Projection Tools
Up-to-date projections of future global climate conditions are available from:
For downscaled and more user-friendly climate tools see:
- DataBasin — offers seasonal means from all the models downscaled globally to a 10km grain and available by decades
- Climate Wizard — developed by TNC and adopted by the US Forest Service, provides average temperature and precipitation maps for historical and future periods for various emission scenarios and GCMs
- WICCI — provides an online interactive mapping tool to display downscaled climate projections for Wisconsin as well as information on impacts and adaptation strategies
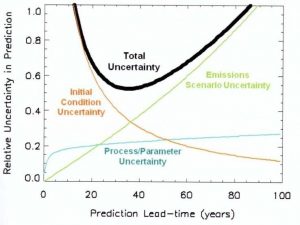
Limitations and Uncertainty
Model verification is impossible for future projections. Confidence in climate models often is based on the ability of models to reproduce past climatic changes. However, there is no guarantee that reproducing the past will simulate the future accurately.
Current models incorporate our current understanding of past climate dynamics, but future dynamics may change drastically with changes in tropospheric and stratospheric composition as well as the planet’s albedo.
AOGCM projections compare well to global scale climate observations, but their accuracy declines at more local scales due to their inherent coarse spatial resolution, averaging the diverse vegetation cover and complex topography important to conservation practitioners. Downscaling techniques bring AOGCM results to the scale of concern but their accuracy is limited to that of the original projection. Further, feedbacks from the biosphere to the atmosphere continue to be underrepresented in global models.
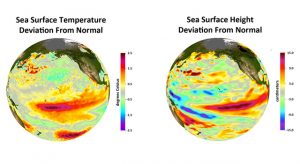
The uncertainty of climate projections results from imperfect knowledge of:
- initial conditions that are difficult to measure (such as sea surface temperature)
- the levels of future anthropogenic emissions
- general system behavior (such as clouds or the melting of ice sheets)
These first three make up the known unknowns.
There are also unknown-unknowns (such as the unexpectedly rapid glacial melt).
Practitioners can ask:
- Do the models suggest climate impacts are inconsequential?
- What is the best model / knowledge to use as a basis to prepare for change?
- Are we prepared and aware of possible changes that could allow for adaptive strategies and buffer negative and unpredictable events?
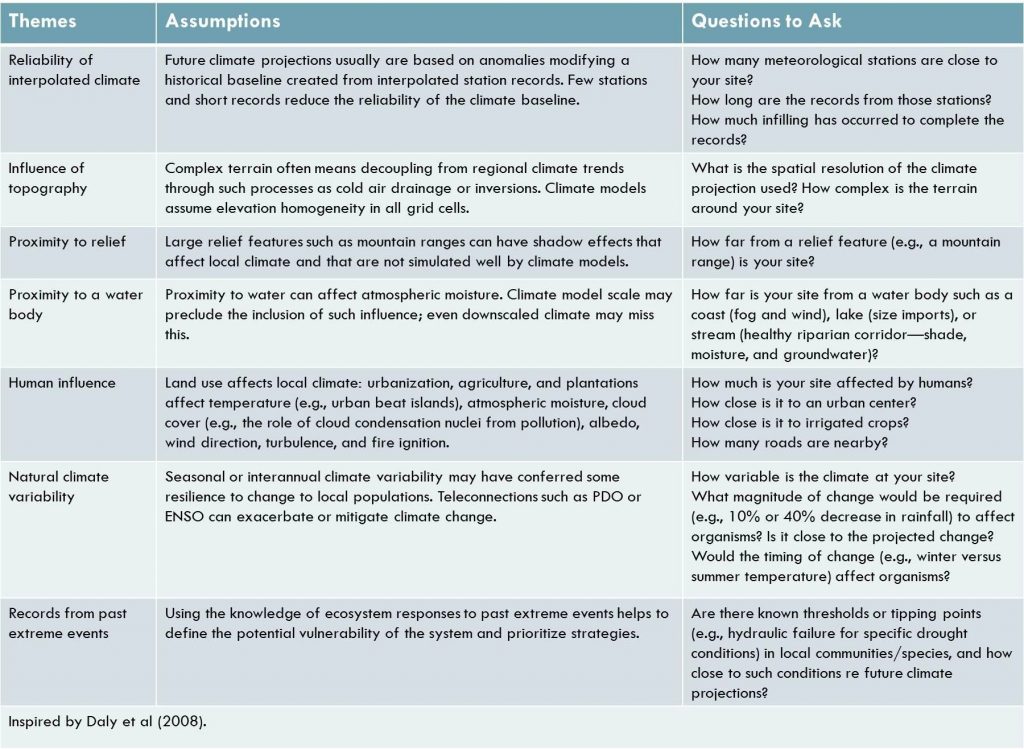
The table below shows general uncertainty criteria about climate projections.
Climate Change Impacts
As climate changes, it can play out on the landscape in different ways. Some impacts that can be directly linked to climate change have already been observed. Other kinds of impacts can be projected. Below are some examples of each.
Observed examples
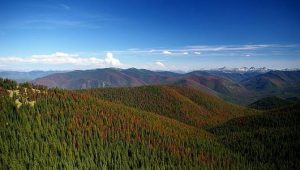 Changes in fire regimes — reported increases in fire occurrence in the western US in recent decades
- Outbreaks of pests and pathogens — e.g. mountain pine beetle epidemics in the N. Rocky Mountains (right)
- Citizen science networks have reported changes in plant phenology in England and N. America, and in bird migration seasonality and routes (e.g. Aldo Leopold Foundation compares phenology today to Leopold’s notes from the 1930s).
Projected examples
-

See Craighead & Convis (2013), pp. 328-331 for references Cascading effects of reduced snow packs on the lynx. A future with shorter winters and more rain than snow could reduce populations of snow-adapted lynx and their primary prey, snowshoe hare. The same goes for snow- dependent wolverines.
- Pika may adapt to warmer temperatures by selectively using talus habitat to avoid extreme heat and severe cold.
Species models and their limitations
To simulate the response of particular species to climate change, niche models have been used, but they vary substantially in their ability to predict current species distributions and produce highly variable predictions of range shifts in response to climate change. Further, these models do not account for biotic interactions – such as competition, predation, etc. Therefore, species specific results should be regarded as suggestions rather than predictions.
Conservation Planning Strategies
Several climate adaptation strategies have been proposed for conservation practitioners and decision-makers. The following strategies can be used together as a complementary suite of tools:
Promote heterogeneity
Reduce but rely on stress
Create redundancy
Preserve the function if not the composition
Allow migration through working landscapes
Develop new expectations for future communities
Examples for several of these strategies are noted with each of the respective descriptions. Please refer to Craighead and Convis (2013, pp. 332-336) to read more about these examples.
Promote heterogeneity
A diversity of communities in the landscape can facilitate smoother transitions from a dominant community that might be less adapted to the new set of environmental conditions, to a better adapted community.
Examples:
- Puget Sound lowlands (Frelich and Reich 2010)
- Tieton River Canyon, eastern Washington
Reduce but rely on stress
 Organisms that live in marginal areas where the stress level is already high and conditions are suboptimal might be less affected by a change in climate that would only represent one more level of stress.
Thus conserving a diversity of habitats — including marginal habitats — might be more productive than creating large buffers of optimal habitat.
However certain species or ecosystems will benefit from a reduction in the number of stress factors in their life cycle.
Example: Northern sportive lemurs
Despite the very small population size (50-100 individuals) of critically endangered Northern sportive lemurs in Montagne des Francais, Madagascar, these primates have hung on through climatic cyclones, potentially because they evolved (through stress) behavioral flexibilty (Dinsmore et al. 2020).

Create redundancy
The ‘Boeing approach’ (Dunwiddie e al. 2009) builds system resilience to change through the replication of the pieces that compose the systems.
The goal is to sustain species and their communities at multiple locations at or near the sites where they currently exist.

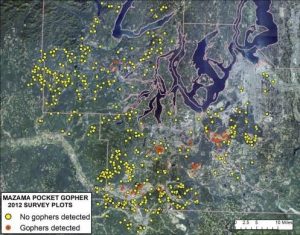 Example: Puget Sound area Mazma (western) pocket gophers
This strategy will work well when change is geographically limited, and no general physiological threshold is reached that affects all of the redundant populations in the same way at the same time. It is an effective strategy if an extreme event hits.
Preserve the function if not the composition
The ‘Microsoft approach’ (Dunwiddie et al. 2009) is the idea that as the climate changes, managers can introduce new species or novel associations of species that are functionally similar to the existing ones, but can eventually replace them as conditions become less suitable for the original biota.
Example: California redwoods

Allow migration through working landscapes
The ‘Starbucks approach’ (Dunwiddie et al. 2009) ensures that suitable habitats are always within easy reach of one another, just like a good latte.
This conservation approach provides linkages, corridors, or other mechanisms to facilitate the movement of species as they respond to climate changes.
Example: CRP in eastern Washington
Develop new expectations for future communities
Another option is to start developing the landscapes of the future by integrating invasive species that are here to stay.
Just like humans, invasive species are active participants in current ecosystems, and of the no analog or novel ecosystems of the future.
Conclusions
Climate change often is associated with negative impacts and rarely is considered as a set of opportunities that land managers can work with. Instead, potentially positive results could be explored, for example:
- Complex terrain may buffer regional climate variation
- Behavioral or morphological adaptations may allow certain species to survive
- Valuable ecosystem services will likely become available in new areas
In other words, there could be some winners and some losers. Impacts of climate change on ecosystem processes and species survival are particularly difficult to predict. Chronic gradual change, although more easily understandable and predictable, is less likely to have drastic consequences than abrupt and extreme events.
Maintaining flexibility of responses in natural and managed systems, and the adaptability to modify expectations and management, will be most important to conservation practice.
Application of Climate Adaptation Planning
Example
 To explore a real world adaptation project we will look at:
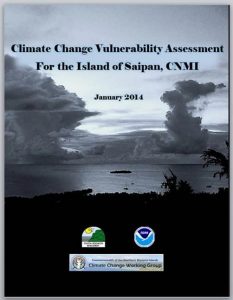
GIS Applications for Climate Adaptation in the Northern Mariana Islands
In 2012 a climate change working group convened on the Island of Saipan to begin climate change adaptation planning in the Commonwealth of the Northern Mariana Islands (CNMI). The working group sought to identify the social, physical, and natural features in the CNMI that are most susceptible to the impacts of climate change (particularly sea level rise).
This project is described in full in the GIS_ClimateCNMI_SaipanExample.pdf that accompanies this Lesson, provided by R. Greene, NOAA Coastal Management Fellow.
Vulnerability Assessment
 The vulnerability assessment focused on projected changes to sea level and rainfall patterns in the CNMI, the exposure and sensitivity of Saipan to these changes, and the Island’s capacity to respond to possible impacts.
The assessment relied heavily on the use of GIS, and leveraged three of the most important functions of GIS:
- Visualization of flood scenarios
- Social vulnerability analysis
- Participatory mapping of vulnerabilities
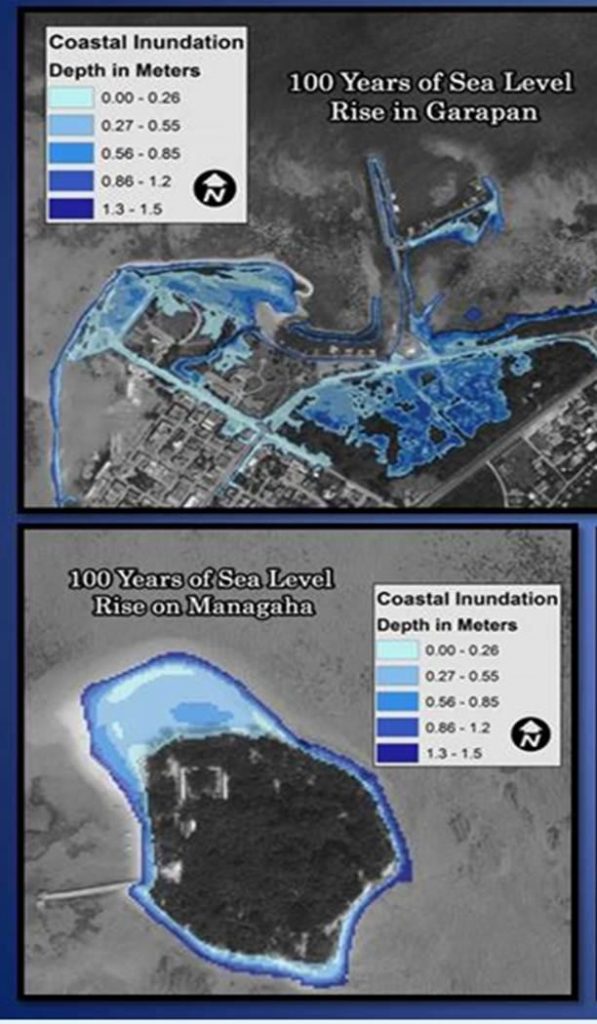
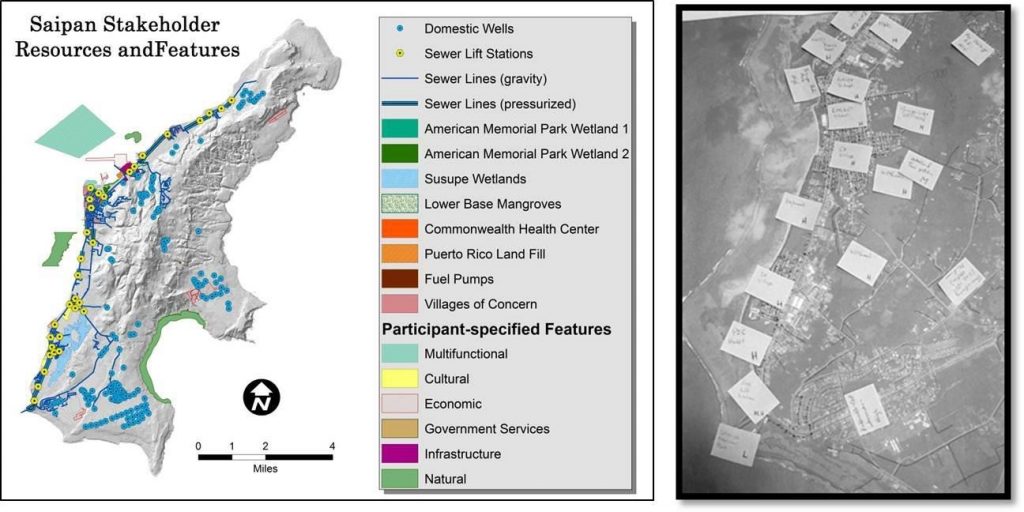
Visualization
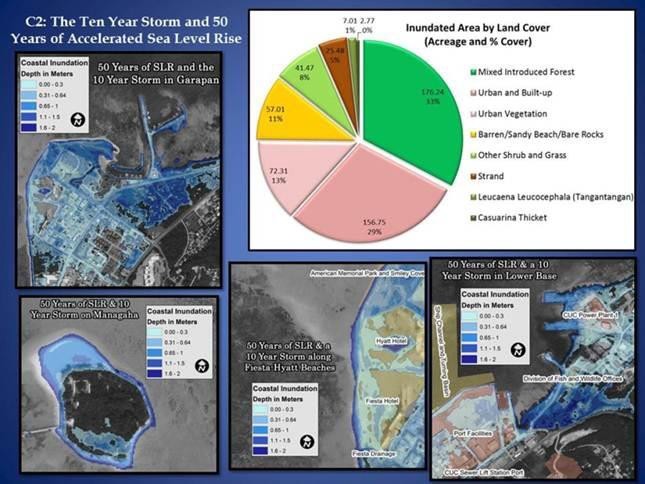
To help members of the CNMI Climate Change Working Group visualize future flood scenarios, and the impact that coastal flooding could have on stakeholder resources, a series of sea level rise layers were developed.
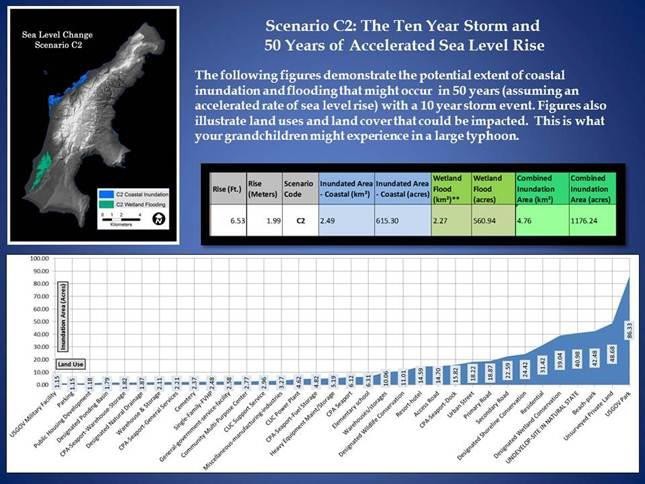
These layers reflected possible coastal flooding scenarios based on previously modeled “total water levels” during typhoons and projected levels of future sea level due to climate change.
Social Vulnerability Analysis
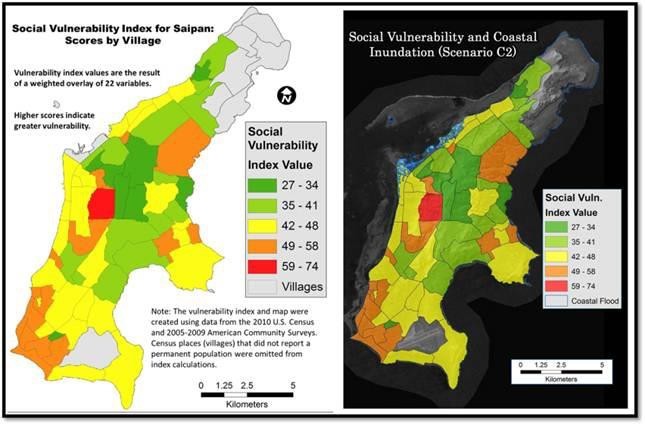
A social vulnerability index was built from 22 social, economic, and demographic variables that recent literature support as the greatest factors in determining social vulnerability to coastal hazards.
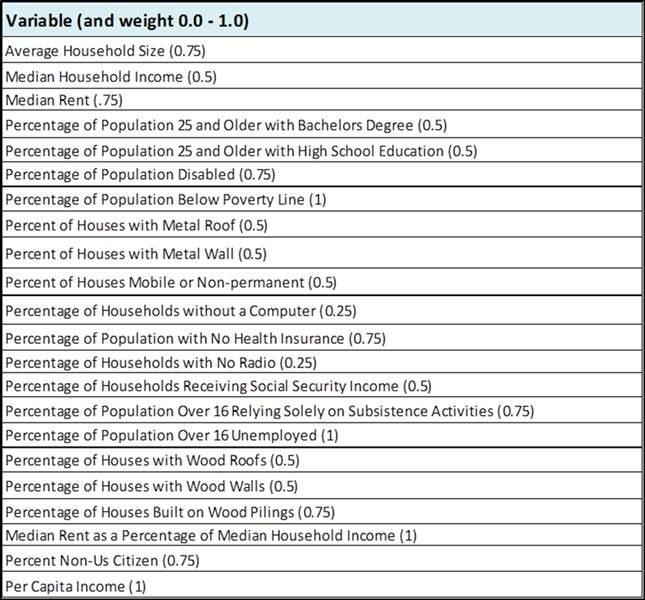
Data from the 2010 U.S. Census and 2005-2009 American Community Surveys were analyzed in GIS for U.S. Census “place” geographies (villages) on Saipan. Data values for each variable were grouped into five classes using a natural breaks method, and re-classified to reflect a value of 1-5. The variables were weighted according to relative contribution to vulnerability, and overlaid to reflect cumulative vulnerability.
Participatory Mapping of Vulnerabilities
The Saipan vulnerability assessment was designed with the intent to use community-based assessment results as input for a more technical, GIS- based assessment; therefore the results of community input required compatibility with spatial data.
These requirements for spatially-explicit results led to the use of participatory mapping as a means of geo-referencing local knowledge.
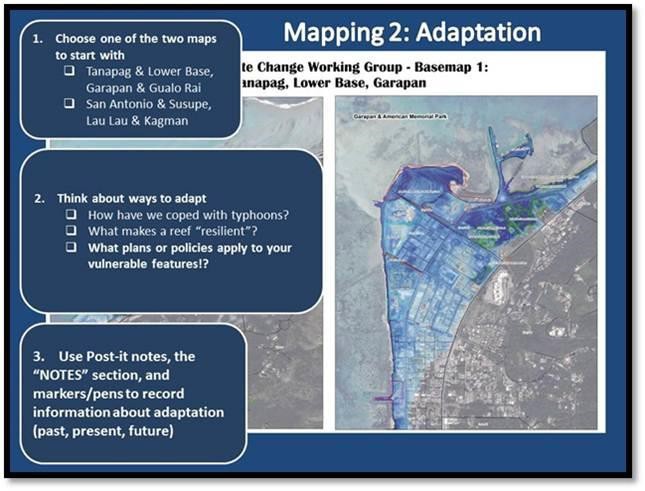
The resulting map reflects areas of local stakeholder concern.
To learn more about this project, read the GIS_ClimateCNMI_SaipanExample.pdf that accompanies this Lesson.
Course Summary and Synthesis
Hopefully, these lessons have cemented for you that the conservation design and spatial reasoning process is ultimately more important than the end GIS product.
Watch the video to learn about how the Jane Goodall Institute has used mapping technology on mobile devices for forest monitoring and chimpanzee conservation.
Congratulations!
You have now completed all the lessons in Adaptation Strategies!