Valence Bond Theory and Hybridization
Valence Bond Theory
As we know, a scientific theory is a strongly supported explanation for observed natural laws or large bodies of experimental data. For a theory to be accepted, it must explain experimental data and be able to predict behavior. For example, the VSEPR model has gained widespread acceptance because of its simplicity and its ability to predict the three-dimensional molecular shapes of many molecules that are consistent with experimental data. The VSEPR model, however, does not accurately predict all molecular shapes or electron domain geometries. Furthermore, VSEPR does not provide an explanation of chemical bonding.
Valence bond theory describes a covalent bond as the overlap of singly-occupied atomic orbitals that yield a pair of electrons shared between the two bonded atoms. We say that orbitals on two different atoms overlap when a portion of one orbital and a portion of a second orbital occupy the same region of space. According to valence bond theory, a covalent bond results when two conditions are met: (1) an orbital on one atom overlaps an orbital on a second atom and (2) the single electrons in each orbital combine to form an electron pair. The mutual attraction between this negatively charged electron pair and the two atoms’ positively charged nuclei contributes to the link between the two atoms that we define as a covalent bond. The strength of a covalent bond depends on the extent of overlap of the orbitals involved. Orbitals that overlap extensively form bonds that are stronger than those that have less overlap.
The energy of the system depends on how much the orbitals overlap. Figure 1 illustrates how the sum of the energies of two hydrogen atoms (the colored curve) changes as they approach each other. When the atoms are infinitely far apart there is no overlap, and by convention we set the sum of the energies at zero. Even at large distances between the atoms there is some small stabilizing interaction which is why the graph only approaches zero at real distances. As the atoms move closer together, their orbitals overlap more effectively forming a stronger covalent bond between the nuclei, which lowers the energy of the system. Covalent bond formation stabilizes the system until the optimum bond distance is achieved. At distances closer than the optimum bond distance, the nuclear-nuclear repulsion of the two nuclei increase and destabilize the system, as shown at the far left of Figure 1. The optimum bond distance is largely due to a compromise between two opposing factors, orbital overlap stabilizing the system and nuclear-nuclear repulsion destabilizing the system as the internuclear distance decreases.
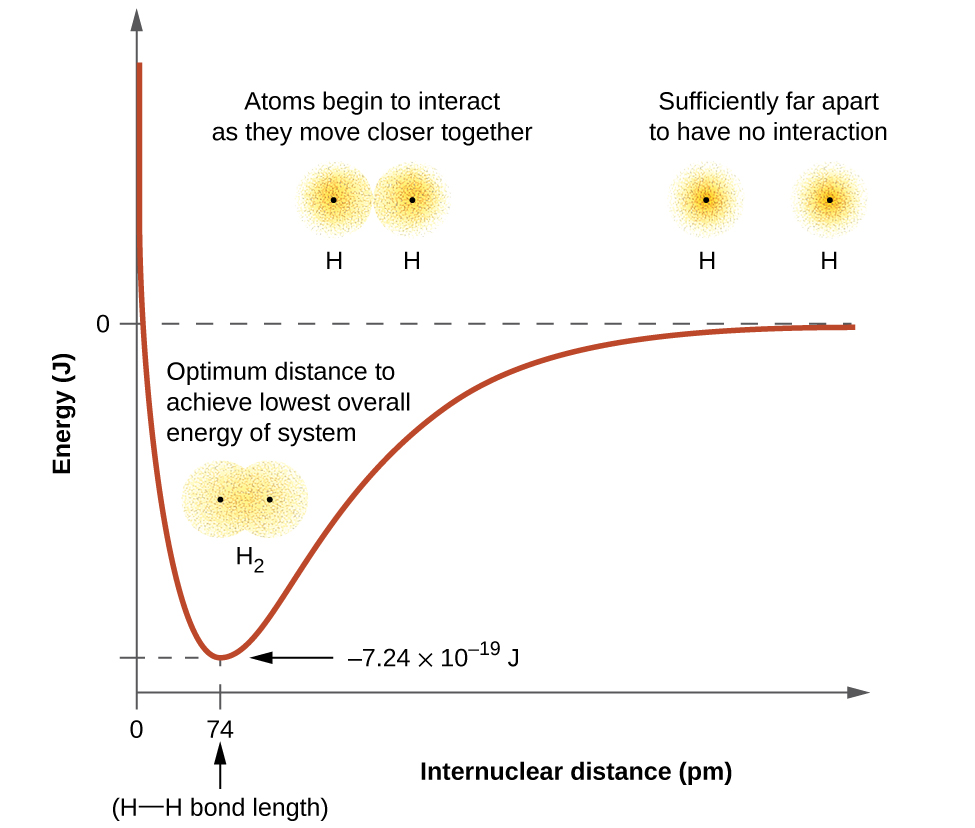
The bond energy is the difference between the energy minimum (which occurs at the bond distance) and the energy of the two separated atoms. This is the quantity of energy released when the bond is formed. Conversely, the same amount of energy is required to break the bond. For the H2 molecule shown in Figure 1, at the bond distance of 74 pm the system is 7.24 × 10⁻¹⁹ J lower in energy than the two separated hydrogen atoms. This may seem like a small number. However, we know from our earlier description of thermochemistry that bond energies are often discussed on a per-mole basis. For example, it requires 7.24 × 10⁻¹⁹ J to break one H–H bond, but it takes 4.36 × 10⁵ J to break 1 mole of H–H bonds. A comparison of some bond lengths and energies is shown in Table 1. We can find many of these bonds in a variety of molecules, and this table provides average values.
| Bond | Length (pm) | Energy (kJ/mol) | Bond | Length (pm) | Energy (kJ/mol) |
| H–H | 74 | 436 | C–O | 143 | 358 |
| H–C | 110 | 416 | C=O | 121 | 695 |
| H–N | 98 | 391 | C≡O | 113 | 1073 |
| H–O | 94 | 467 | H–Cl | 127 | 431 |
| C–C | 154 | 346 | H–Br | 142 | 366 |
| C=C | 134 | 598 | H–I | 161 | 299 |
| C≡C | 121 | 813 | O–O | 148 | 146 |
| C–N | 147 | 285 | O=O | 121 | 498 |
| C=N | 127 | 616 | F–F | 141 | 158 |
| C≡N | 115 | 866 | Cl–Cl | 200 | 242 |
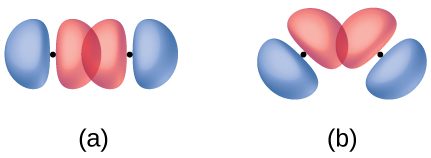
In addition to the distance between two orbitals, the orientation of orbitals also affects their overlap (other than for two s orbitals, which are spherically symmetric). Greater overlap is possible when orbitals are oriented such that they overlap on a direct line between the two nuclei. Figure 2 illustrates this for two p orbitals from different atoms; the overlap is greater when the orbitals overlap end to end rather than at an angle.
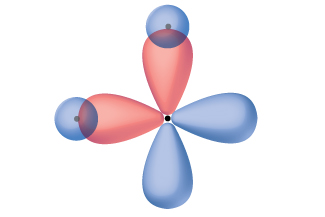
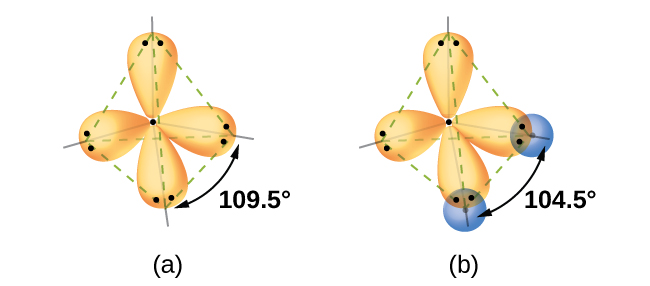
Thinking in terms of overlapping atomic orbitals is one way for us to explain how chemical bonds form in diatomic molecules. However, to understand how molecules with more than two atoms form stable bonds, we require a more detailed model. As an example, let us consider the water molecule, in which we have one oxygen atom bonding to two hydrogen atoms. Oxygen has the electron configuration 1s22s22p4, with two unpaired electrons (one in each of two 2p orbitals). Valence bond theory would predict that the two O–H bonds form from the overlap of these two 2p orbitals with the 1s orbitals of the hydrogen atoms. If this were the case, the bond angle would be 90°, as shown in Figure 3, because p orbitals are perpendicular to each other. Experimental evidence shows that the bond angle is 104.5°, not 90°. The prediction of the valence bond theory alone does not match the real-world observations of a water molecule; a different model is needed.
Quantum-mechanical calculations suggest why the observed bond angles in H2O differ from those predicted by the overlap of the 1s orbital of the hydrogen atoms with the 2p orbitals of the oxygen atom. The mathematical expression known as the wave function, ψ, contains information about each orbital and the wavelike properties of electrons in an isolated atom. When atoms are bound together in a molecule, the wave functions combine to produce new mathematical descriptions that have different shapes. This process of combining the wave functions for atomic orbitals is called hybridization and is mathematically accomplished by the linear combination of atomic orbitals, LCAO, (a technique that we will encounter again later). The new orbitals that result are called hybrid orbitals. The valence orbitals in an isolated oxygen atom are a 2s orbital and three 2p orbitals. The valence orbitals in an oxygen atom in a water molecule differ; they consist of four equivalent hybrid orbitals that point approximately toward the corners of a tetrahedron (Figure 4). Consequently, the overlap of the O and H orbitals should result in a tetrahedral bond angle (109.5°).
The following ideas are important in understanding hybridization:
- Hybrid orbitals do not exist in isolated atoms. They are formed only in covalently bonded atoms.
- Hybrid orbitals have shapes and orientations that are very different from those of the atomic orbitals in isolated atoms.
- A set of hybrid orbitals is generated by combining atomic orbitals. The number of hybrid orbitals in a set is equal to the number of atomic orbitals that were combined to produce the set.
- All orbitals in a set of hybrid orbitals are equivalent in shape and energy.
- The type of hybrid orbitals formed in a bonded atom depends on its electron-pair geometry as predicted by the VSEPR theory.
- Hybrid orbitals overlap to form σ bonds. Unhybridized orbitals overlap to form π bonds.
In the following sections, we shall discuss the common types of hybrid orbitals.
sp Hybridization
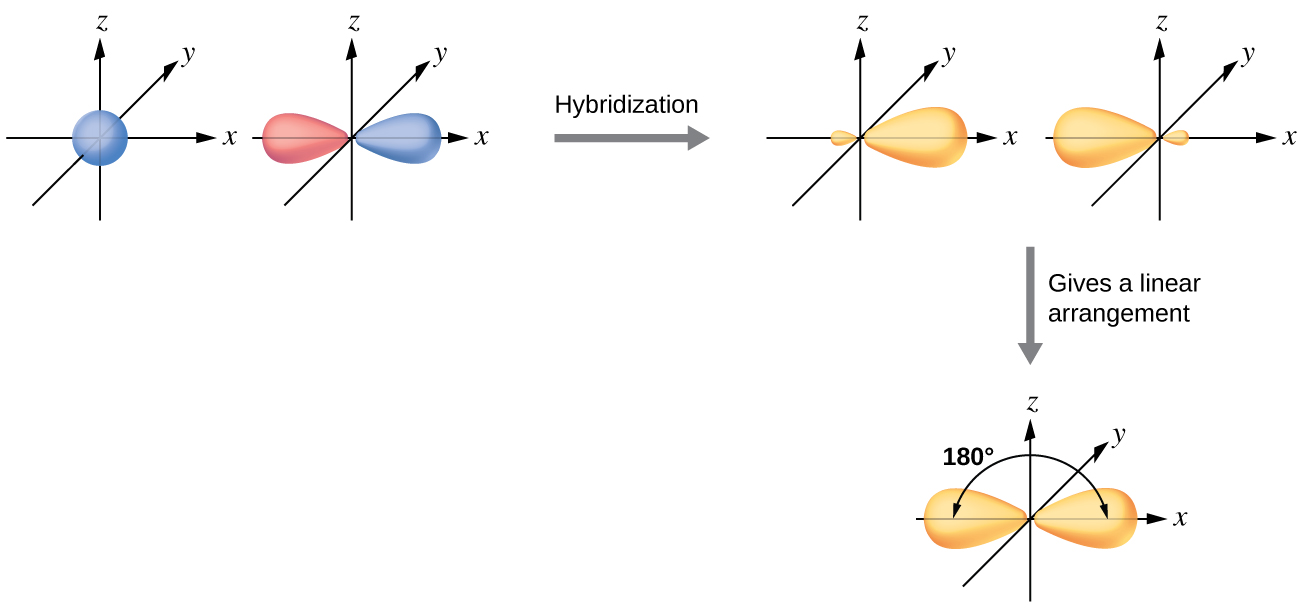
The beryllium atom in a gaseous BeCl2 molecule is an example of a central atom with no lone pairs of electrons in a linear arrangement of three atoms. There are two regions of valence electron density in the BeCl2 molecule that correspond to the two covalent Be–Cl bonds. To accommodate these two electron domains, two of the Be atom’s four valence orbitals will mix to yield two hybrid orbitals. This hybridization process involves mixing of the valence s orbital with one of the valence p orbitals to yield two equivalent sp hybrid orbitals that are oriented in a linear geometry (Figure 5). In this figure, the set of sp orbitals appears similar in shape to the original p orbital, but there is an important difference. The number of atomic orbitals combined always equals the number of hybrid orbitals formed. The p orbital is one orbital that can hold up to two electrons. The sp set is two equivalent orbitals that point 180° from each other. The two electrons that were originally in the s orbital are now distributed to the two sp orbitals, which are half filled. In gaseous BeCl2, these half-filled hybrid orbitals will overlap with orbitals from the chlorine atoms to form two identical bonds.
We illustrate the electronic differences in an isolated Be atom and in the bonded Be atom in the orbital energy-level diagram in Figure 6. These diagrams represent each orbital by a horizontal line (indicating its energy) and each electron by an arrow. Energy increases toward the top of the diagram. We use one upward arrow to indicate one electron in an orbital and two arrows (up and down) to indicate two electrons of opposite spin.
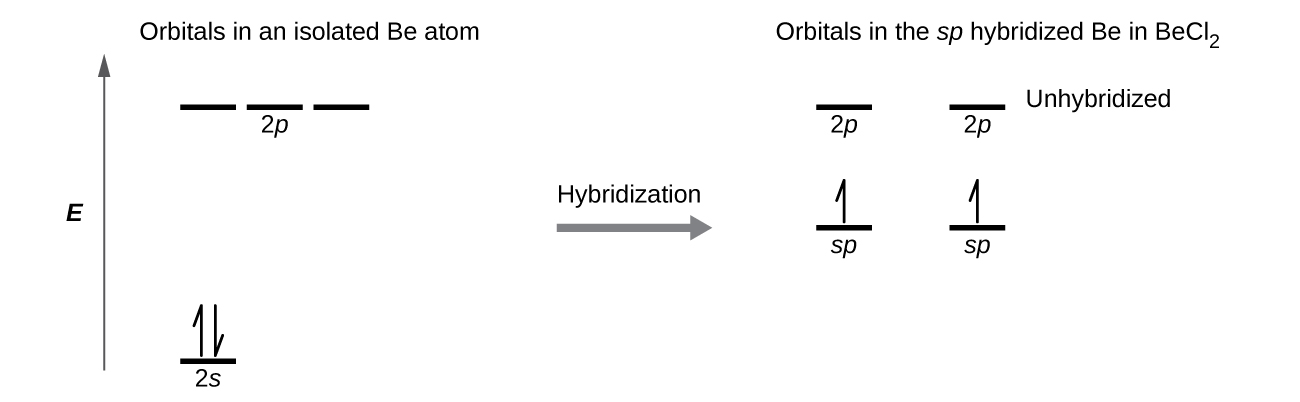
When atomic orbitals hybridize, the valence electrons occupy the newly created orbitals. The Be atom had two valence electrons, so each of the sp orbitals gets one of these electrons. Each of these electrons pairs up with the unpaired electron on a chlorine atom when a hybrid orbital and a chlorine orbital overlap during the formation of the Be–Cl bonds.
Any central atom surrounded by just two regions of valence electron density in a molecule will exhibit sp hybridization. Other examples include the mercury atom in the linear HgCl2 molecule, the zinc atom in Zn(CH3)2, which contains a linear C–Zn–C arrangement, and the carbon atoms in HCN, HCCH, and CO2.
sp2 Hybridization
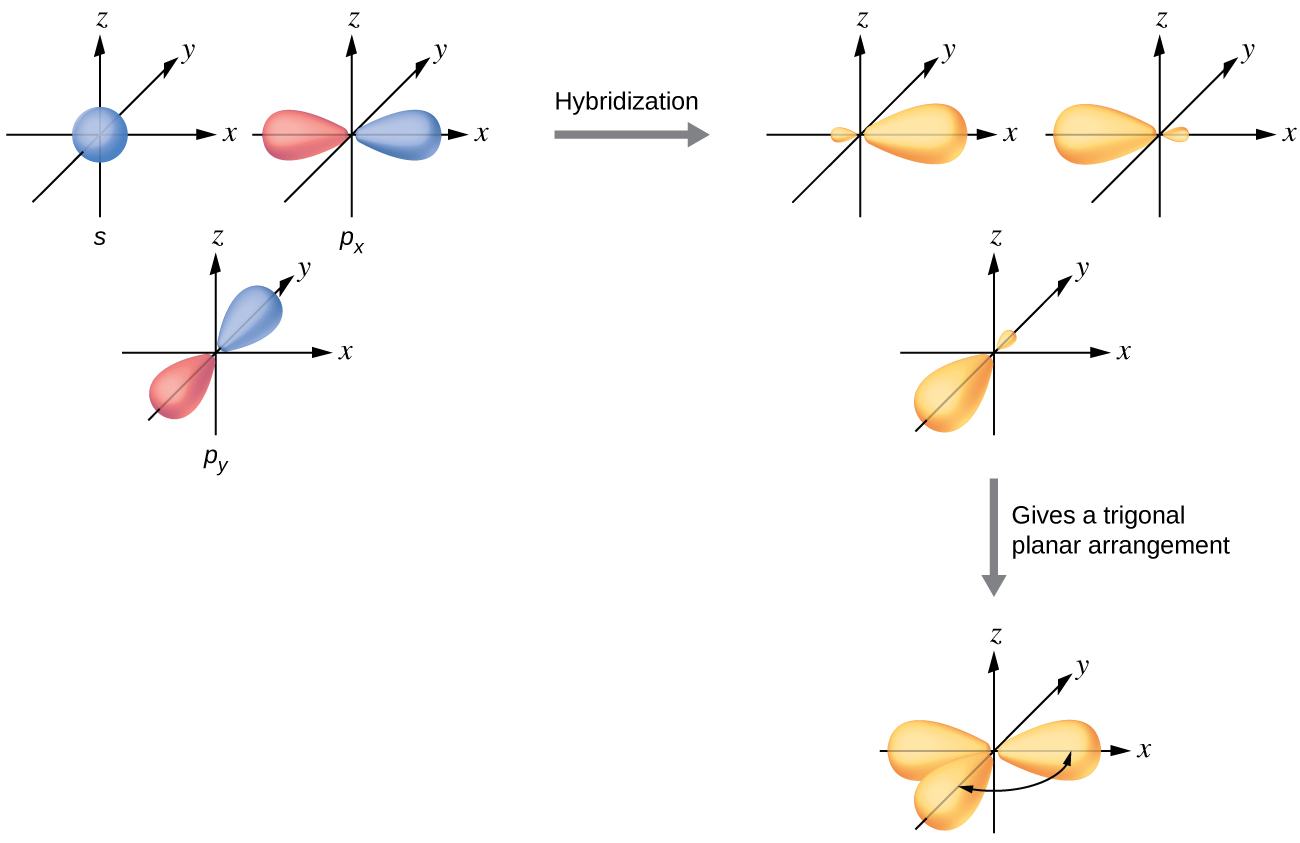
The valence orbitals of a central atom surrounded by three regions of electron density consist of a set of three sp2 hybrid orbitals and one unhybridized p orbital. This arrangement results from sp2 hybridization, the mixing of one s orbital and two p orbitals to produce three identical hybrid orbitals oriented in a trigonal planar geometry (Figure 7).
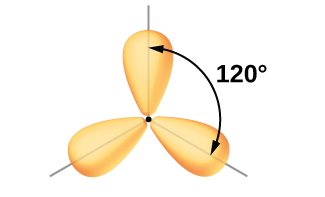
Although quantum mechanics yields the “plump” orbital lobes as depicted in Figure 7, sometimes for clarity these orbitals are drawn thinner and without the minor lobes, as in Figure 8, to avoid obscuring other features of a given illustration. We will use these “thinner” representations whenever the true view is too crowded to easily visualize.
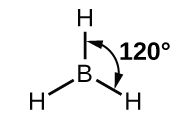
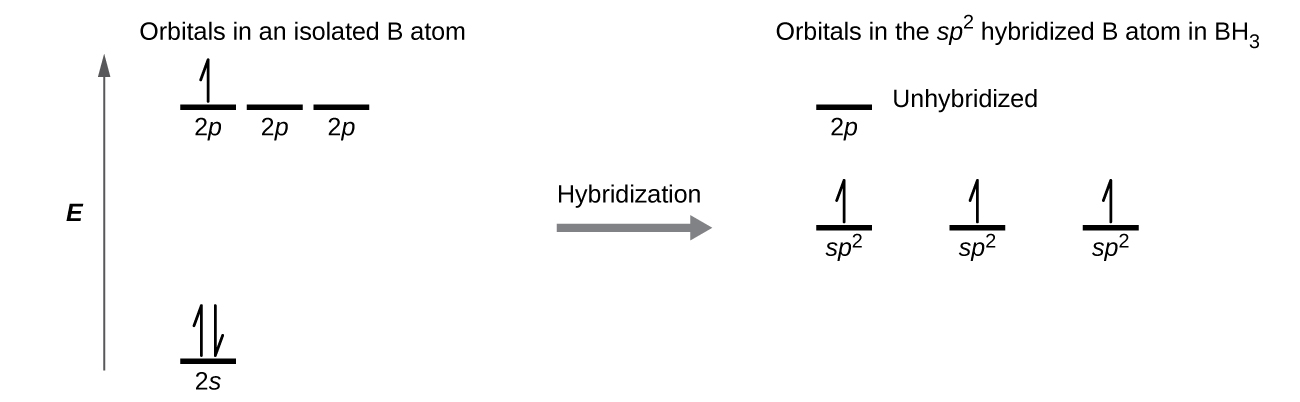
The observed structure of the borane molecule, BH3, suggests sp2 hybridization for boron in this compound. The molecule is trigonal planar, and the boron atom is involved in three bonds to hydrogen atoms (Figure 9). We can illustrate the comparison of orbitals and electron distribution in an isolated boron atom and in the bonded atom in BH3 as shown in the orbital energy level diagram in Figure 10. We redistribute the three valence electrons of the boron atom in the three sp2 hybrid orbitals, and each boron electron pairs with a hydrogen electron when B–H bonds form.
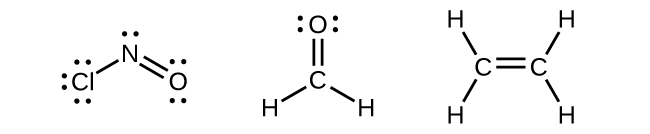
Any central atom surrounded by three regions of electron density will exhibit sp2 hybridization. This includes molecules with a lone pair on the central atom, such as ClNO (Figure 11), or molecules with two single bonds and a double bond connected to the central atom, as in formaldehyde, CH2O, and ethene, H2CCH2.
sp3 Hybridization
The valence orbitals of an atom surrounded by a tetrahedral arrangement of bonding pairs and lone pairs consist of a set of four sp3 hybrid orbitals. The hybrids result from the mixing of one s orbital and all three p orbitals that produces four identical sp3 hybrid orbitals (Figure 12). Each of these hybrid orbitals points toward a different corner of a tetrahedron.
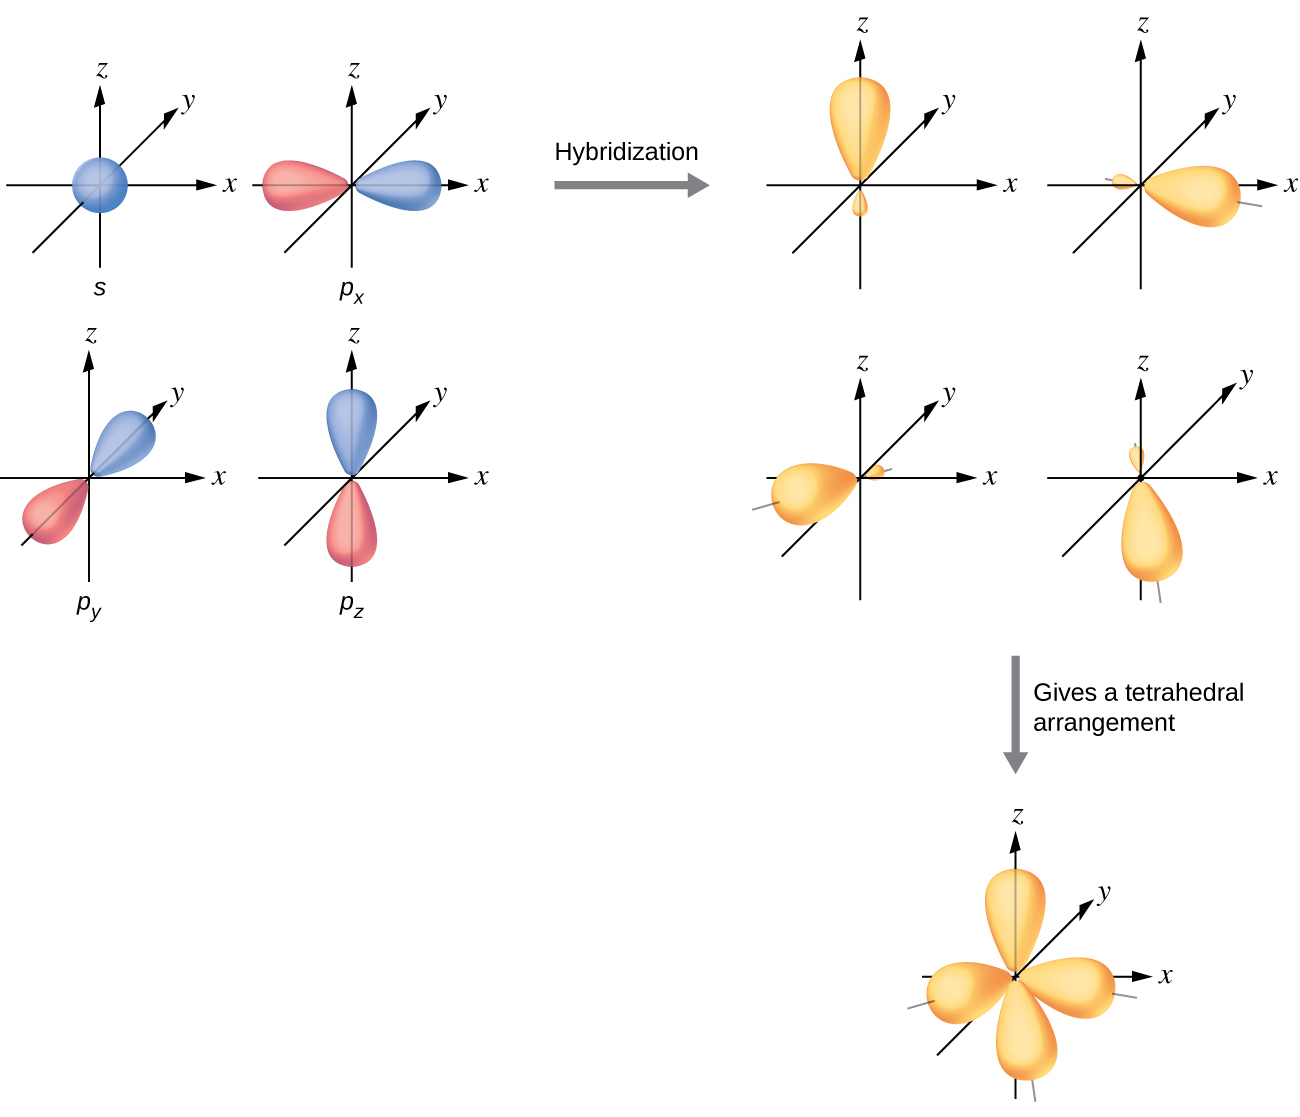
A molecule of methane, CH4, consists of a carbon atom surrounded by four hydrogen atoms at the corners of a tetrahedron. The carbon atom in methane exhibits sp3 hybridization. We illustrate the orbitals and electron distribution in an isolated carbon atom and in the bonded atom in CH4 in Figure 13. The four valence electrons of the carbon atom are distributed equally in the hybrid orbitals, and each carbon electron pairs with a hydrogen electron when the C–H bonds form.
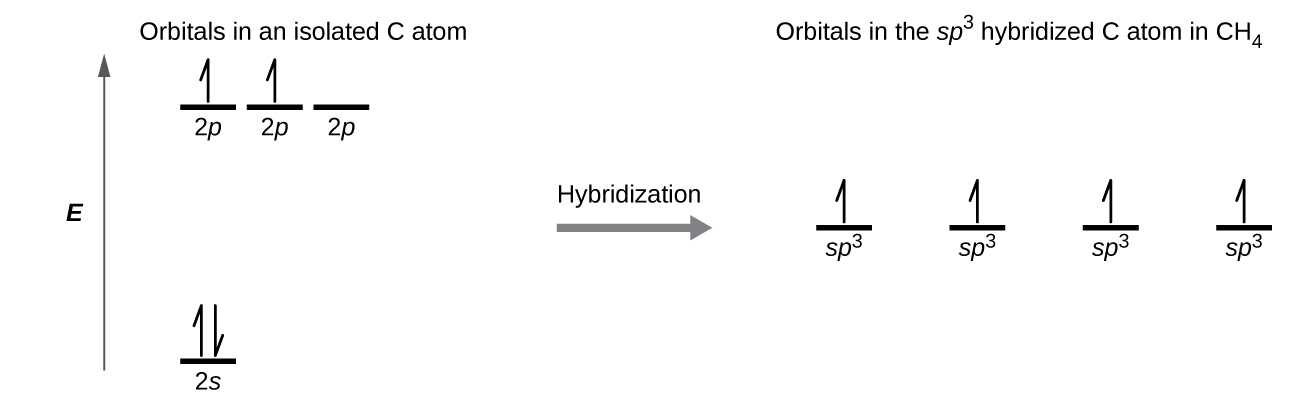
In a methane molecule, the 1s orbital of each of the four hydrogen atoms overlaps with one of the four sp3 orbitals of the carbon atom to form a bond. This results in the formation of four strong, equivalent covalent bonds between the carbon atom and each of the hydrogen atoms to produce the methane molecule, CH4.
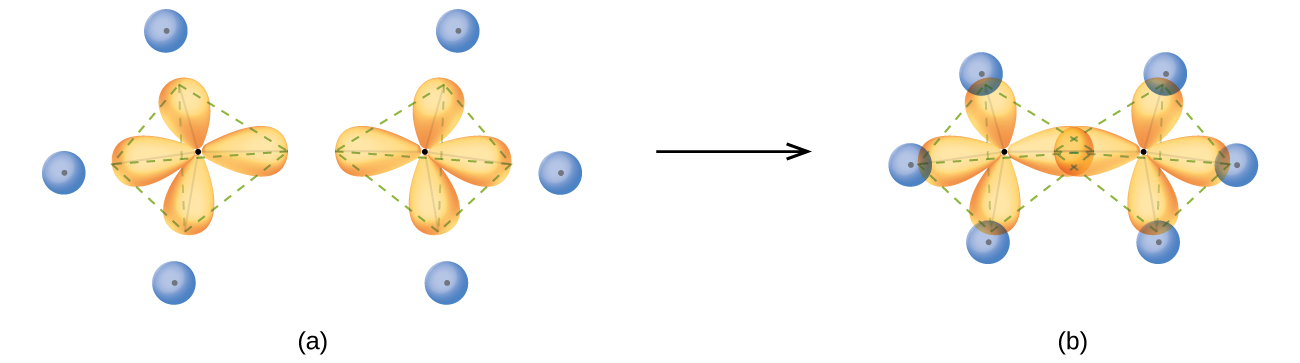
The structure of ethane, C2H6, is similar to that of methane in that each carbon in ethane has four neighboring atoms arranged at the corners of a tetrahedron—three hydrogen atoms and one carbon atom (Figure 14). However, in ethane an sp3 orbital of one carbon atom overlaps end to end with an sp3 orbital of a second carbon atom to form a bond between the two carbon atoms. Each of the remaining sp3 hybrid orbitals overlaps with an s orbital of a hydrogen atom to form carbon–hydrogen bonds. The structure and overall outline of the bonding orbitals of ethane are shown in Figure 14. The orientation of the two CH3 groups is not fixed relative to each other. Experimental evidence shows that rotation around single bonds occurs easily.
An sp3 hybrid orbital can also hold a lone pair of electrons. For example, the nitrogen atom in ammonia is surrounded by three bonding pairs and a lone pair of electrons directed to the four corners of a tetrahedron. The nitrogen atom is sp3 hybridized with one hybrid orbital occupied by the lone pair.
Since lone pairs occupy more space than bonding pairs, structures that contain lone pairs have bond angles slightly distorted from the ideal. Perfect tetrahedra have angles of 109.5°, but the observed angles, such as in ammonia (107.3°), are slightly smaller. Other examples of sp3 hybridization include CCl4, PCl3, and NCl3.
Sigma (σ) and Pi (π) Bonds
The overlap of two s orbitals (as in H2), the overlap of an s orbital and a p orbital (as in HCl), and the end-to-end overlap of two p orbitals (as in Cl2) all produce sigma bonds (σ bonds), as illustrated in Figure 15. A σ bond is a covalent bond in which the electron density is concentrated in the region along the internuclear axis; that is, a line between the nuclei would pass through the center of the overlap region. Single bonds in Lewis structures are described as σ bonds in valence bond theory.
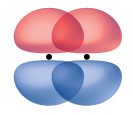
A pi bond (π bond) is a type of covalent bond that results from the side-by-side overlap of two p orbitals, as illustrated in Figure 16. In a π bond, the regions of orbital overlap lie on opposite sides of the internuclear axis. Along the axis itself, there is a node, that is, a plane with no probability of finding an electron.
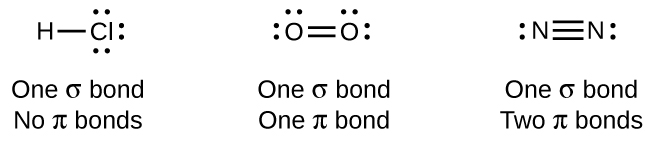
While all single bonds are σ bonds, multiple bonds consist of both σ and π bonds. As the Lewis structures suggest, O2 contains a double bond, and N2 contains a triple bond. The double bond consists of one σ bond and one π bond, and the triple bond consists of one σ bond and two π bonds. Between any two atoms, the first bond formed will always be a σ bond, but there can only be one σ bond in any one location. In any multiple bond, there will be one σ bond, and the remaining one or two bonds will be π bonds. These bonds are described in more detail later in this section.
An average carbon-carbon single bond is 356 kJ/mol, while in a carbon-carbon double bond, the π bond increases the bond strength by 242 kJ/mol. Adding an additional π bond causes a further increase of 215 kJ/mol. We can see a similar pattern when we compare other σ and π bonds. Thus, each individual π bond is generally weaker than a corresponding σ bond between the same two atoms. In a σ bond, there is a greater degree of orbital overlap than in a π bond.
Example 1: Counting number of σ and π bonds
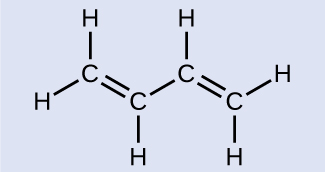
Butadiene, C6H6, is used to make synthetic rubber. Identify the number of σ and π bonds depicted by the most important resonance structure of this molecule, shown above.
Solution
There are six σ C–H bonds and one σ C–C bond, for a total of seven from the single bonds. There are two double bonds that each have a π bond in addition to the σ bond. This gives a total nine σ and two π bonds overall.
Check Your Learning
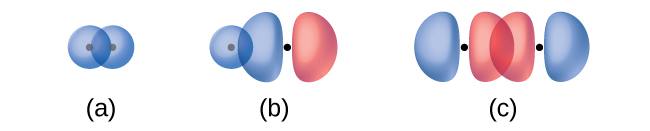
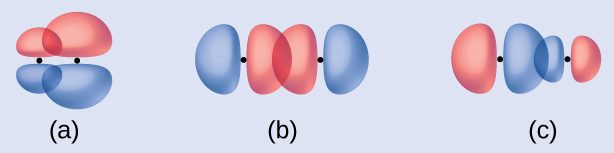
Identify each illustration as depicting a σ or π bond:
- side-by-side overlap of a 4p and a 2p orbital
- end-to-end overlap of a 4p and 4p orbital
- end-to-end overlap of a 4p and a 2p orbital
Answer
(a) is a π bond with a node along the axis connecting the nuclei while (b) and (c) are σ bonds that overlap along the internuclear axis.
Multiple Bonds and Unhybridized p Orbitals
The hybrid orbital model appears to account well for the geometry of molecules involving single covalent bonds. Is it also capable of describing molecules containing double and triple bonds? We have already discussed that multiple bonds consist of σ and π bonds. Next we can consider how we visualize these components and how they relate to hybrid orbitals.
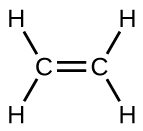 The Lewis structure of ethene, C2H4, shows us that each carbon atom is surrounded by one other carbon atom and two hydrogen atoms. The three bonding regions form a trigonal planar electron-pair geometry. Thus we expect the σ bonds from each carbon atom are formed using a set of sp2 hybrid orbitals that result from hybridization of two 2p orbitals and the 2s orbital (Figure 17).
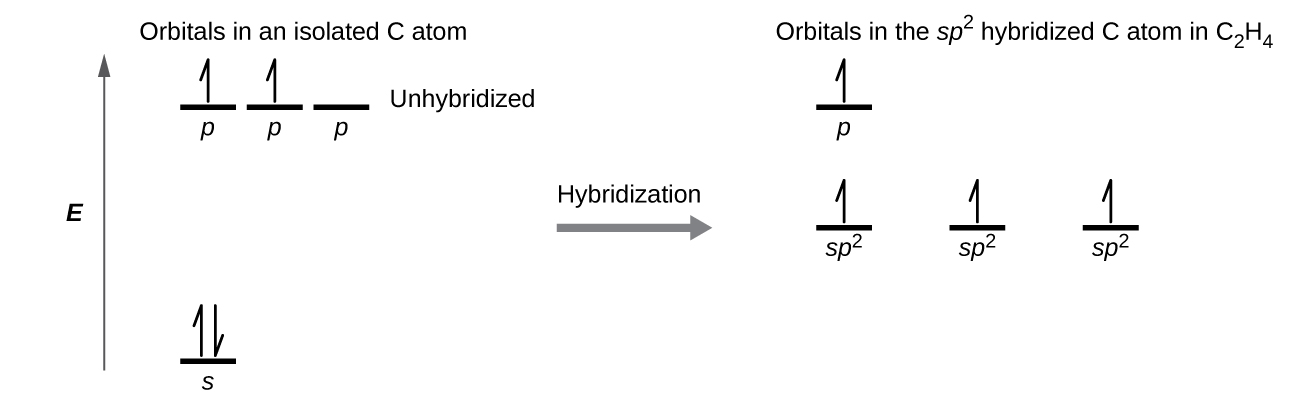
These orbitals form the C–H single bonds and the σ bond in the C=C double bond (Figure 18). The π bond in the C=C double bond results from the overlap of the third (remaining) 2p orbital on each carbon atom that is not involved in hybridization. This unhybridized p orbital (lobes shown in red and blue in Figure 18) is perpendicular to the plane of the sp2 hybrid orbitals. Thus the unhybridized 2p orbitals overlap in a side-by-side fashion, above and below the internuclear axis (Figure 18) and form a π bond.
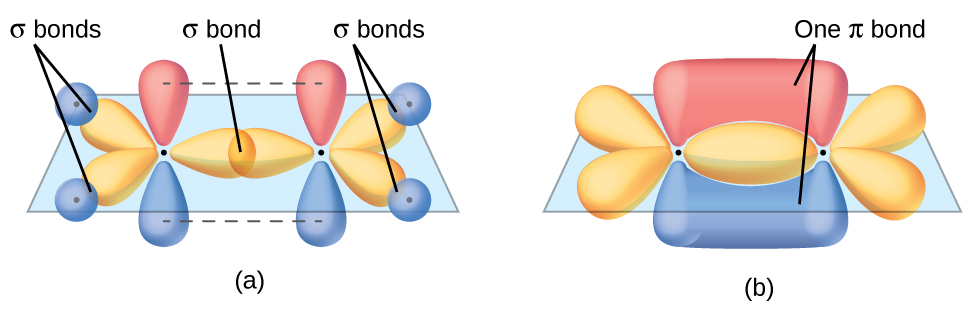
In an ethene molecule, the four hydrogen atoms and the two carbon atoms are all in the same plane. If the two planes of sp2 hybrid orbitals tilted relative to each other, the p orbitals would not be oriented to overlap efficiently to create the π bond. The planar configuration for the ethene molecule occurs because it is the most stable bonding arrangement. This is a significant difference between σ and π bonds; rotation around single (σ) bonds occurs easily because the end-to-end orbital overlap does not depend on the relative orientation of the orbitals on each atom in the bond. In other words, rotation around the internuclear axis does not change the extent to which the σ bonding orbitals overlap because the bonding electron density is symmetric about the axis. Rotation about the internuclear axis is much more difficult for multiple bonds; however, this would drastically alter the off-axis overlap of the π bonding orbitals, essentially breaking the π bond.
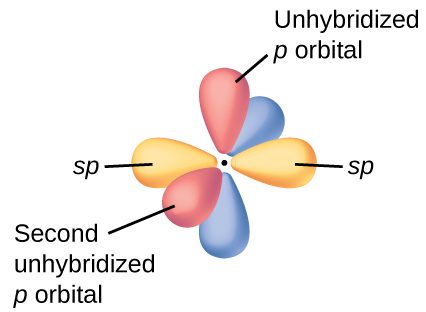
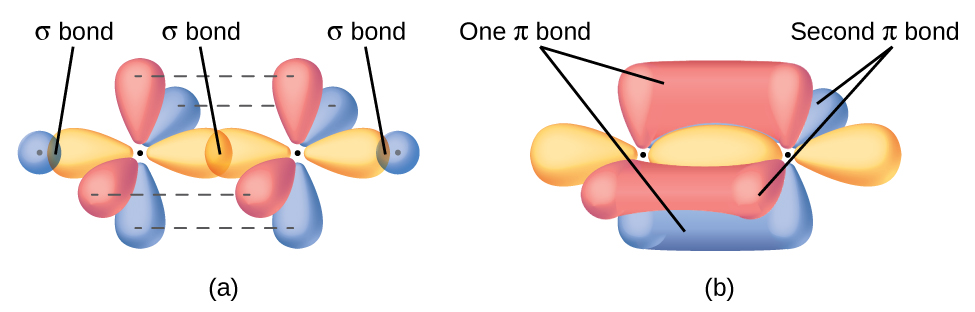
In molecules with sp hybrid orbitals, two unhybridized p orbitals remain on the atom (Figure 19). We find this situation in acetylene, H−C≡C−H, which is a linear molecule. The sp hybrid orbitals of the two carbon atoms overlap end to end to form a σ bond between the carbon atoms (Figure 20). The remaining sp orbitals form σ bonds with hydrogen atoms. The two unhybridized p orbitals per carbon are positioned such that they overlap side by side and, hence, form two π bonds. The two carbon atoms of acetylene are thus bound together by one σ bond and two π bonds, giving a triple bond.