
D10.1 Molecular View of Equilibrium
When a chemical reaction occurs, electron density is rearranged as bonds break and/or form; that is, the way atoms are arranged relative to each other changes. For this to happen, molecules must collide and there must be sufficient energy in the reactant molecule or molecules. The reaction that converts cis-1,2-difluoroethene to trans-1,2-difluoroethene provides a simple example.
![]()
This reaction could occur by rotation of the right side of the molecule around the C=C bond by 180°. However, the carbon-carbon π bond requires side-by-side overlap of atomic p orbitals on the two carbon atoms. Rotating 90° destroys that overlap; that is, it breaks the π bond and therefore cis–trans isomerization does not occur at room temperature.
We can think about this pictorially using a reaction energy diagram, which is a diagram that shows energy as a function of reaction progress. Reaction progress means the various rearrangements of electron density that occur as one molecule changes into another.
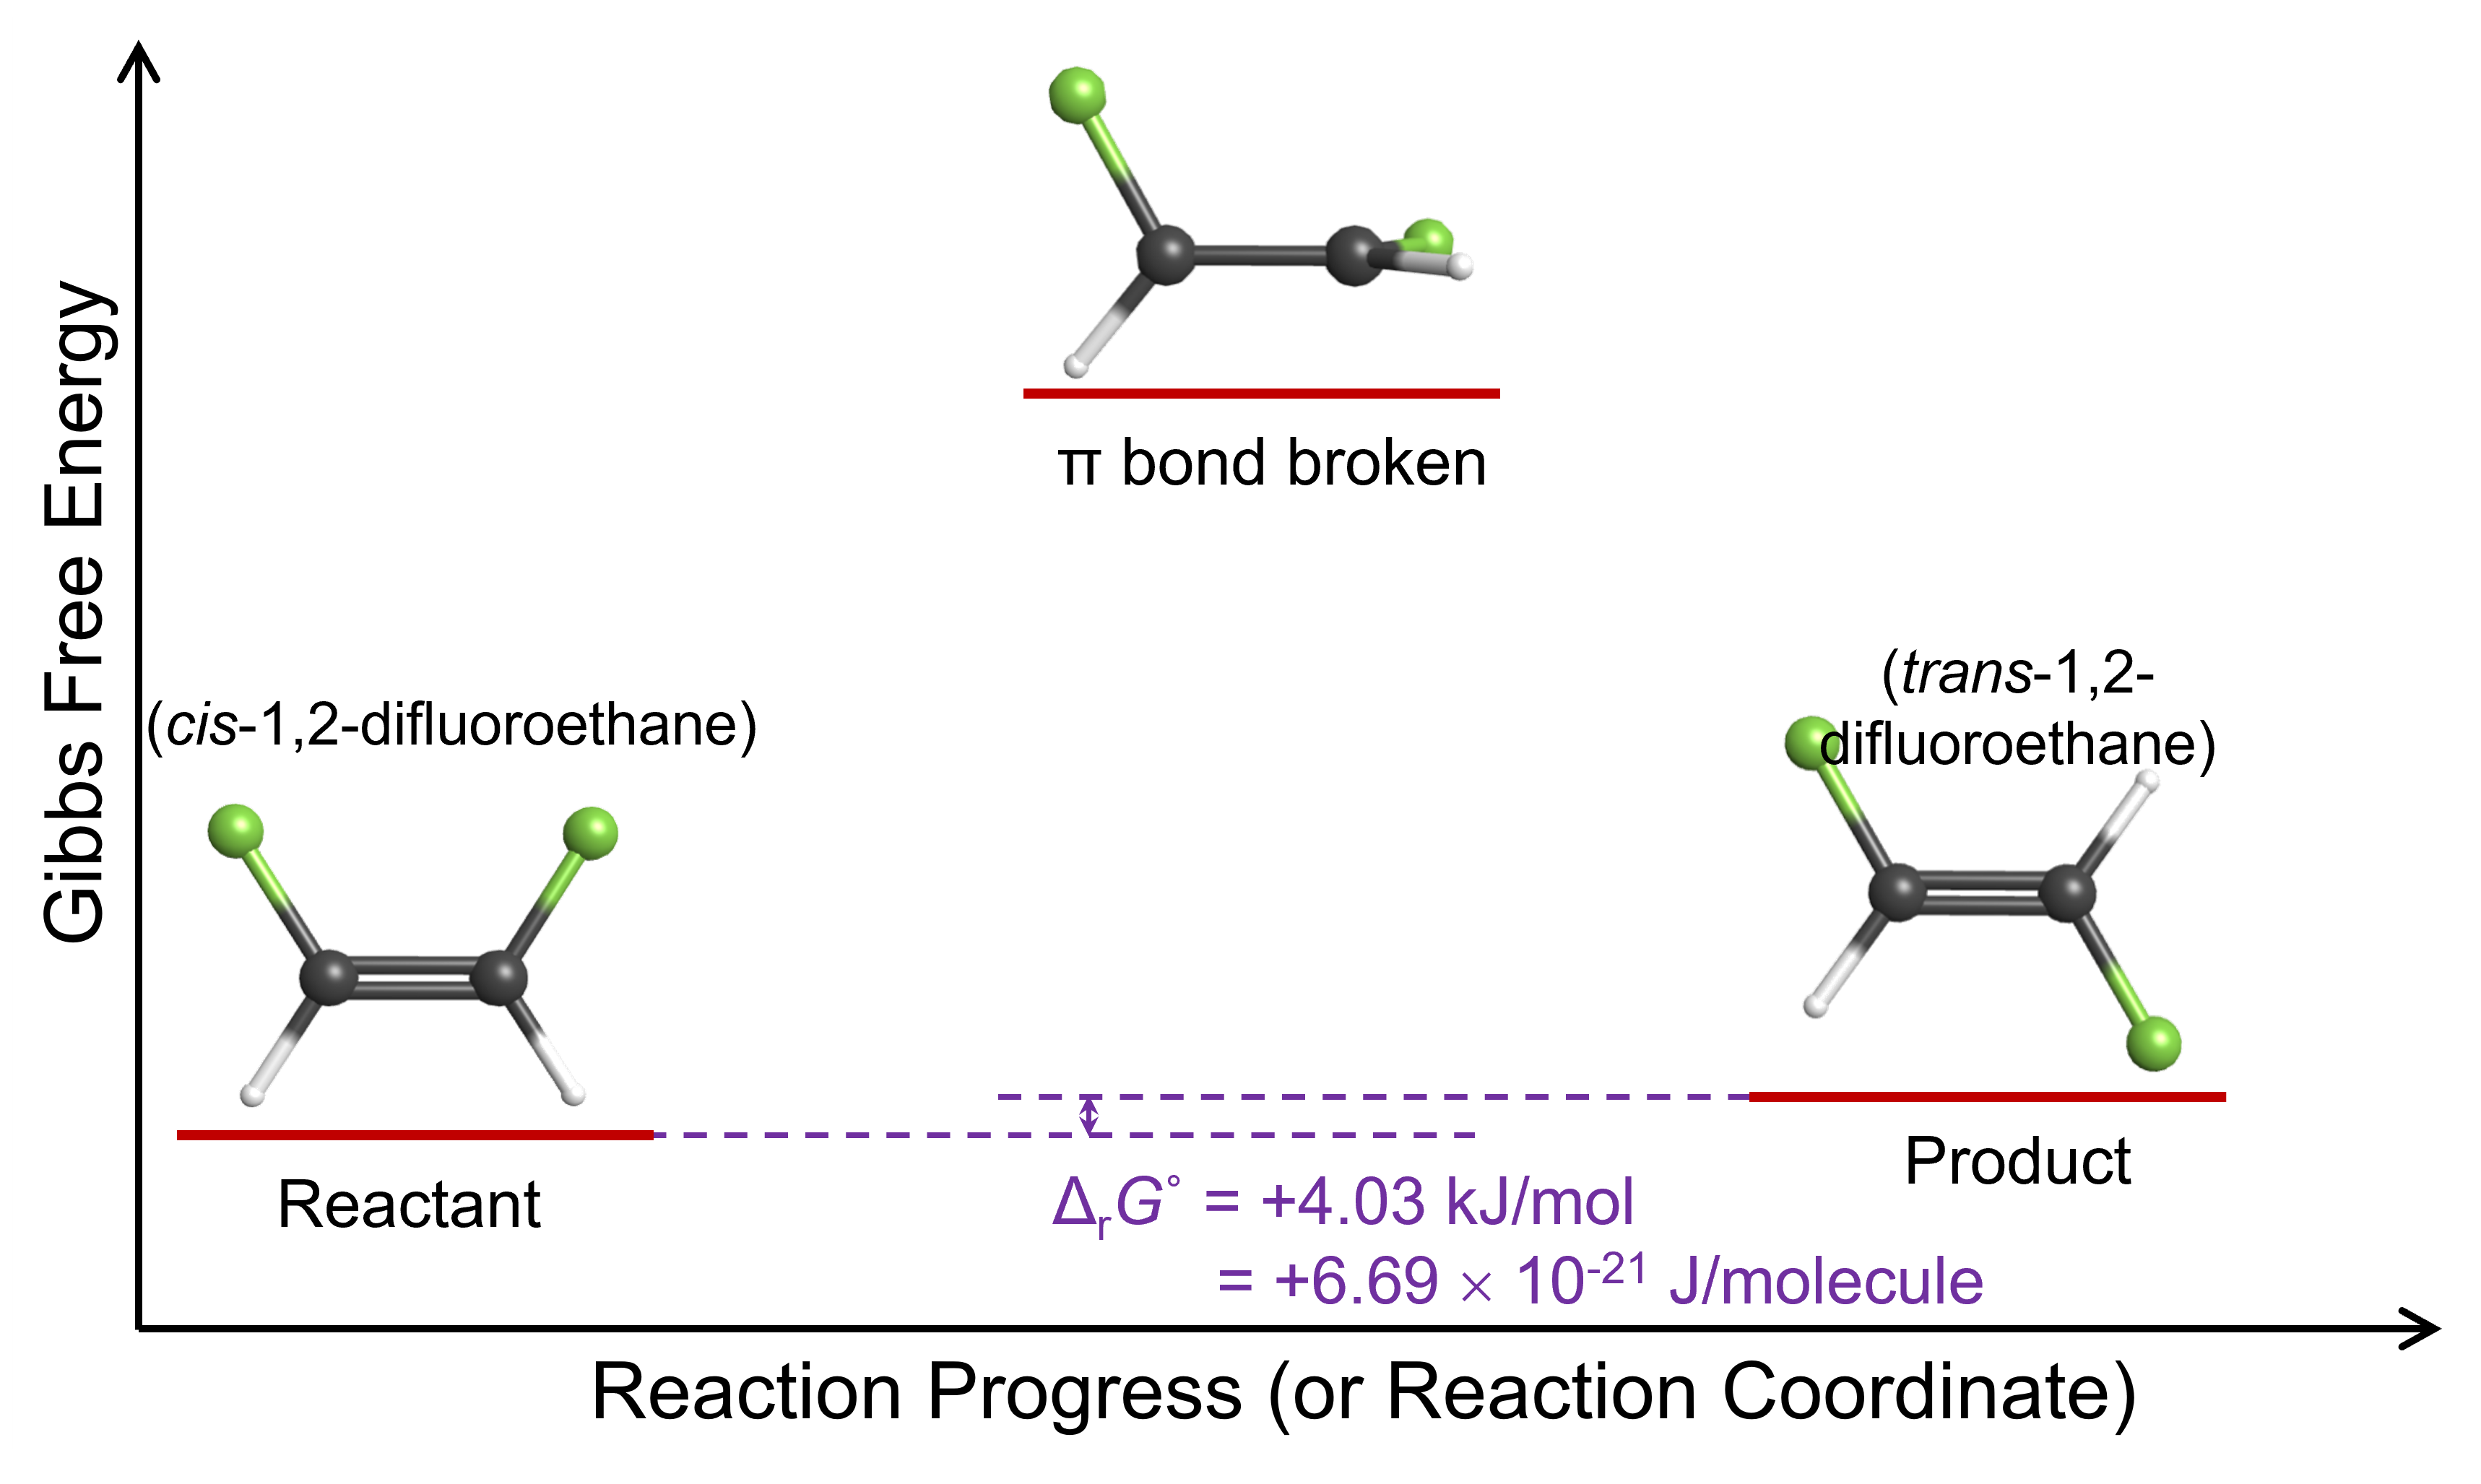
This reaction energy diagram shows that when one end of the molecule rotates 90° relative to the other, the energy of the molecule is higher because the π bond is broken. If the molecule is going to react by rotation around the carbon-carbon bond, the molecule must have at least enough energy to break the π bond. In the product molecule, trans-1,2-difluoroethene, the angle of rotation is 180° and the π bond has been restored; the molecule’s energy has decreased to almost the same value it was initially.
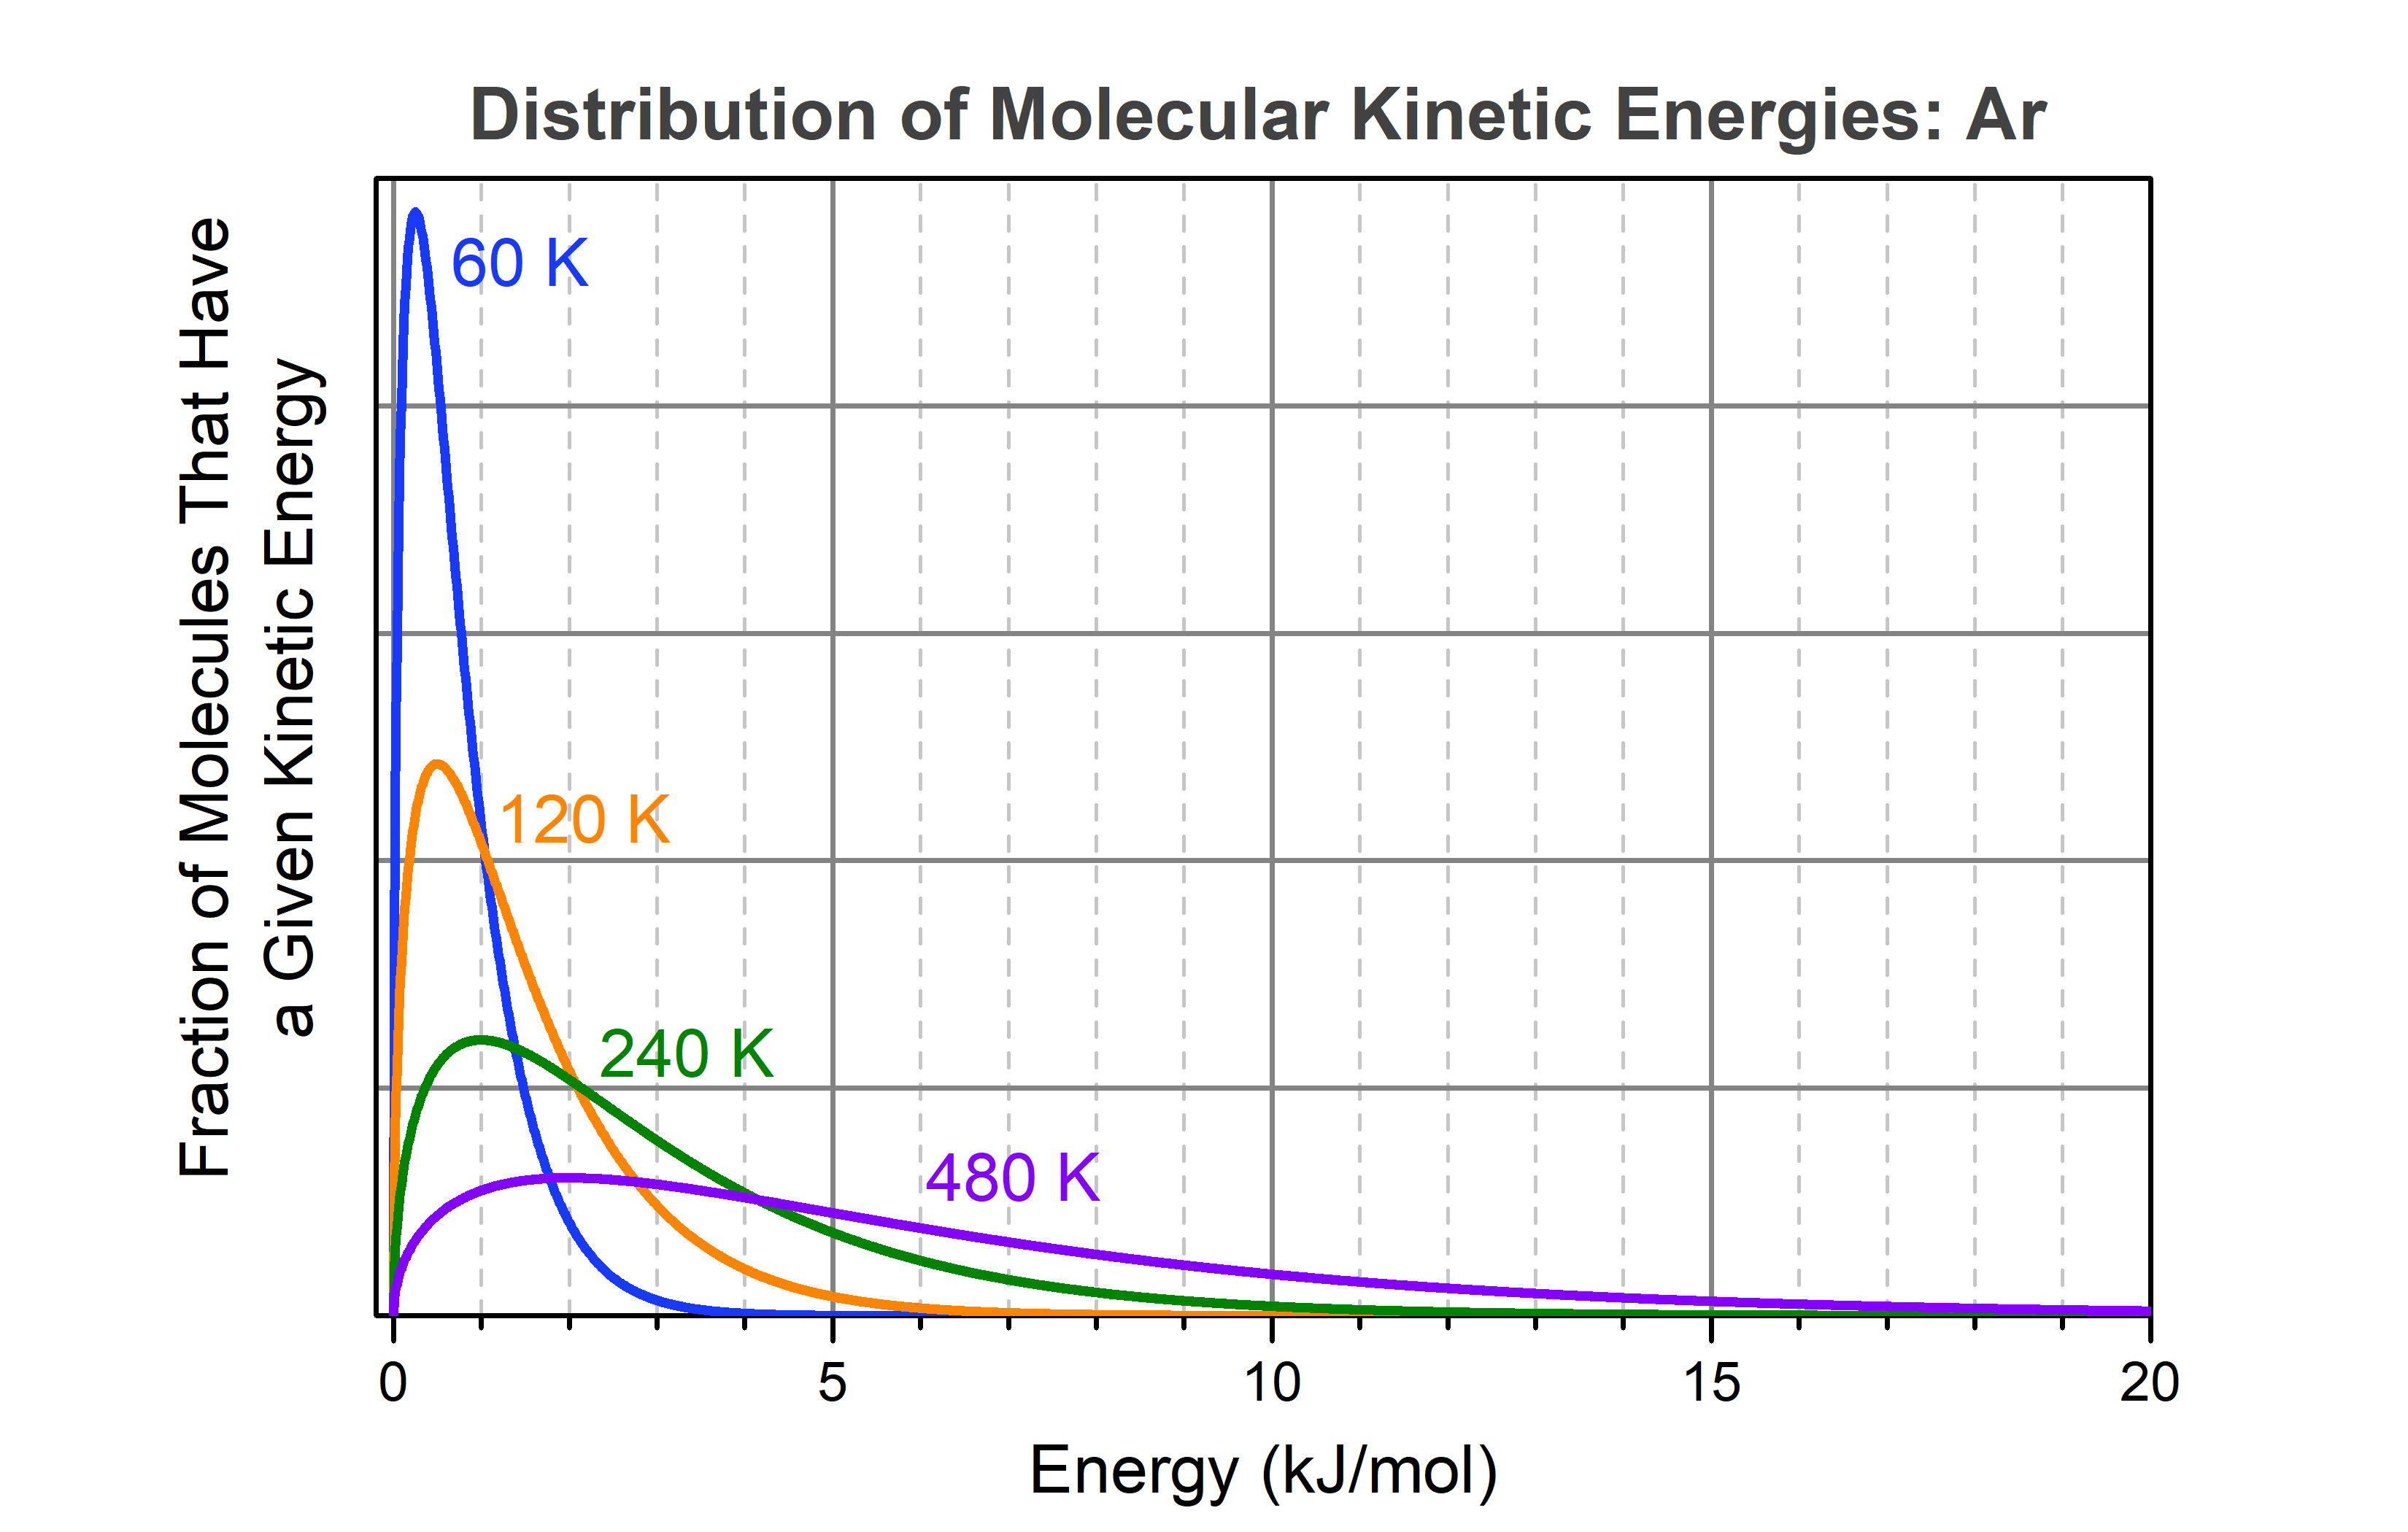
Experimentally it is found that at 1000 K, 1 mol cis-1,2-difluoroethene does transform into an equilibrium mixture consisting of 0.62 mol cis isomers and 0.38 mol trans isomers. Why can this happen? As cis-1,2-difluoroethene molecules move around in a container, energy is constantly being transferred from one molecule to another by collisions. Using argon as a simple example, the kinetic energy distribution among molecules (or atoms as is in the case of Ar) at various temperatures is shown in the graph below.
Activity: Distribution of Molecular Energies in a Gas
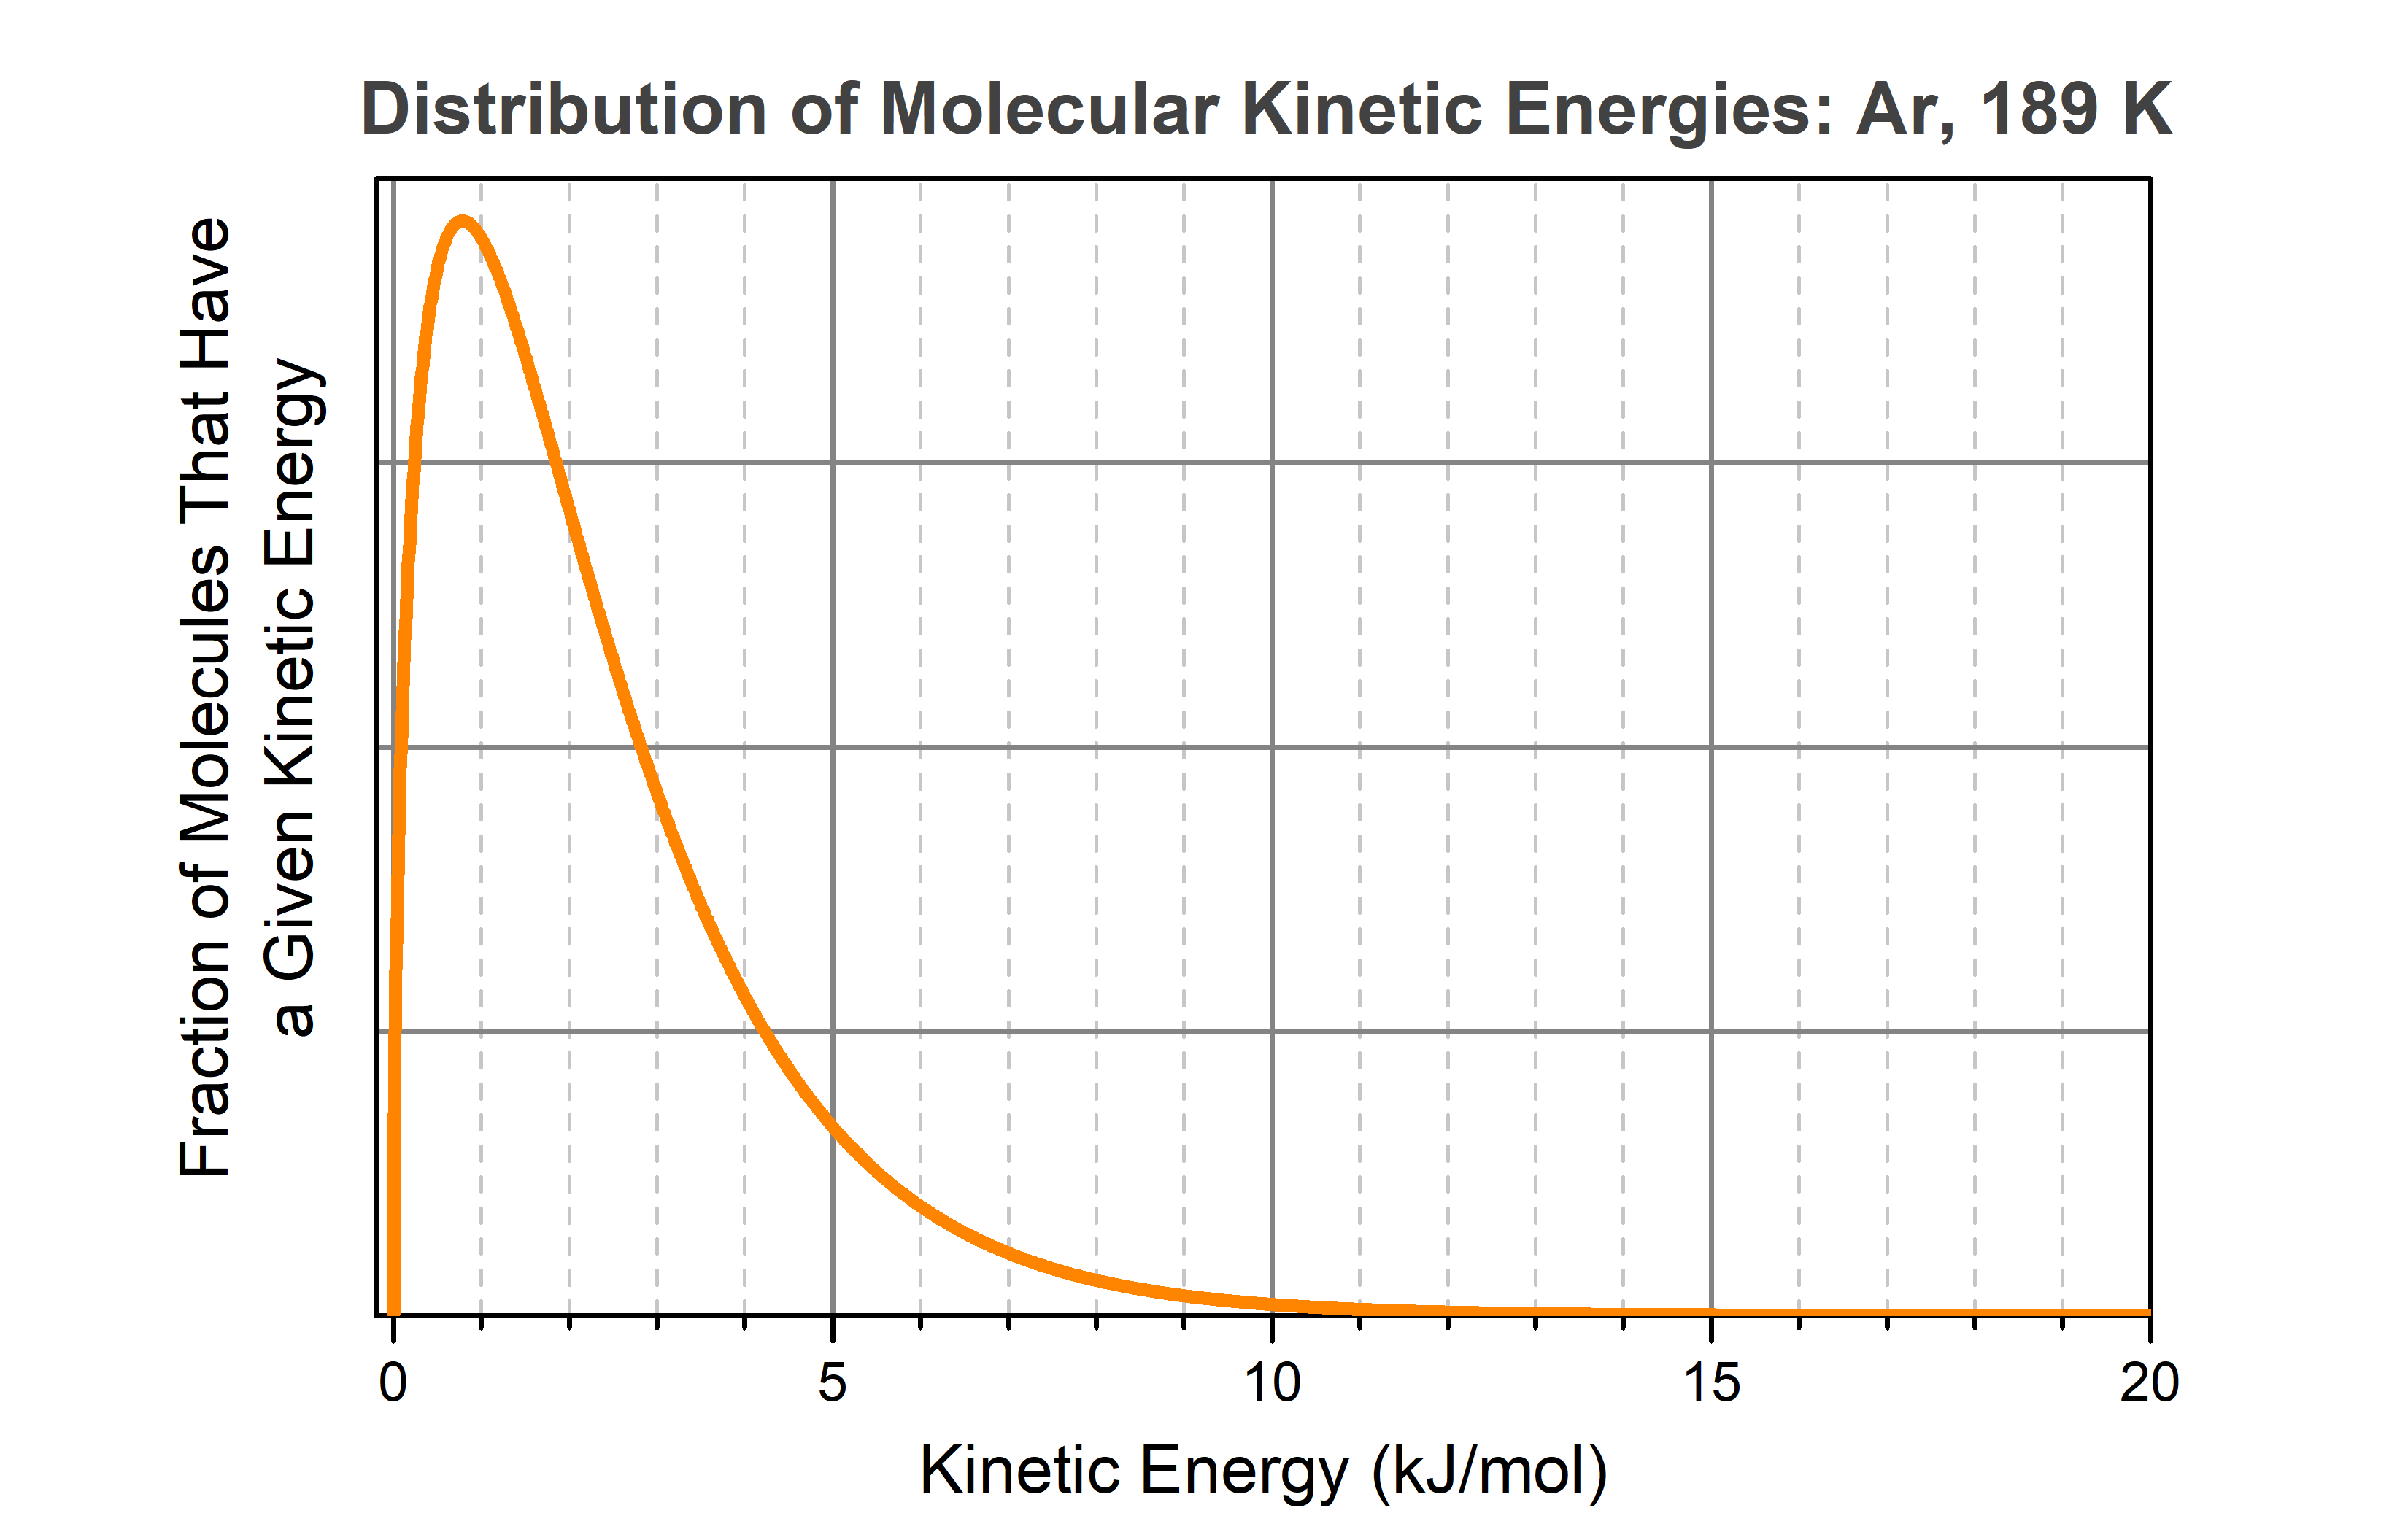
Study the graph carefully and write your answers to these questions:.
- Determine the energy corresponding to the speed at which the greatest number of molecules (or atoms as in the case of Ar) is traveling.
- Is the average energy greater or less than the energy you wrote in part 1? Explain why.
- Another student says that the area under the curve in this graph is proportional to the total number of argon atoms in the sample. Write a few sentences that either support or argue against this statement.
Write in your notebook, then left-click here for an explanation.
- The most probable energy, that is, the energy corresponding to the speed at which the greatest number of molecules is traveling, is at around 0.8 kJ/mol, where the peak in the curve is located.
- Because the curve is not symmetric around the maximum, that is, because the curve goes down more slowly than it goes up, the average molecular energy is somewhat above the most probable energy.
- The vertical axis corresponds to a fraction of all molecules. The area under the curve is the sum of all those fractions over all energies. Thus, it should be proportional to the total number of molecules (or atoms as is in the case of Ar).
In general, the area under any section of the curve, such as the area under the part of the curve to the right of the maximum, is proportional to the number of molecules that has energies in the range corresponding to that area.
This figure shows that as the temperature of the molecules (or argon atoms as in this example) increases, the fraction of molecules having high kinetic energy gets larger quite rapidly. Note that each curve approaches zero asymptotically. For example, at 60 K (blue curve), there is still a tiny fraction of molecules that has energy >6.4 kJ/mol (the energy needed to vaporize liquid argon). You cannot tell from the graph, but calculations show that the fraction of molecules with energy greater than 6.4 kJ/mol is about 105 times smaller than the fraction with energy greater than 0.25 kJ/mol (the maximum in the blue curve), but it is not zero.
Therefore, for cis-1,2-difluoroethene molecules at 1000 K, a small fraction has sufficient energy to convert to the trans isomer at any single point in time. Those molecules with less energy cannot react and therefore remain in the cis form. This so-called “energy barrier to reaction” is the reason many reactions become faster at higher temperatures—as temperature increases, more and more molecules have enough energy to react so the reaction goes faster and faster. At a given temperature, the energy barrier influences how fast a reaction can occur and how long it takes to establish equilibrium, a topic that will be discussed further in the next sections.
The cis to trans conversion process does not stop when equilibrium is reached at 1000 K. As the reaction approaches equilibrium the number of cis-1,2-difluoroethene molecules decreases, but there are still cis-1,2-difluoroethene molecules present in the equilibrium mixture, and the same fraction of them continues to convert to the trans isomer. (Because the temperature is kept constant at 1000 K, the kinetic energy distribution of the molecules remains the same, meaning the fraction of cis-1,2-difluoroethene molecules with sufficient energy to react remains the same.)
As the reaction approaches equilibrium, more and more trans-1,2-difluoroethene molecules are formed. The trans-1,2-difluoroethene molecules, once formed, also have a distribution of kinetic energies and a fraction of those molecules has sufficient energy to convert back to the cis form. Thus cis-1,2-difluoroethene molecules are not only being consumed but are also being produced. Both forward and reverse reactions are occurring.
Once equilibrium has been reached, the concentration and partial pressure of cis-1,2-difluoroethene remain constant because the rate at which it is being consumed is exactly balanced by the rate at which it is being produced. In other words, for every cis molecule that converts to the trans isomer, there will be, on average, a molecule of trans isomer converting back to the cis isomer. This constant reshuffle of molecules between reactant (cis-1,2-difluoroethene) and product (trans-1,2-difluoroethene) continues indefinitely without any net change in the concentration/partial pressure of either species.
In this dynamic chemical equilibrium, if you could observe one specific molecule over time, you would find the molecule moving around and often colliding with other molecules. More importantly, sometimes the molecule is in the trans form and other times the molecule is in the cis form.
If we follow this molecule for a while, we would find that, on average, it spends 38% of the time in the trans form and 62% of the time in the cis form. This is true for every molecule in the equilibrium mixture. Therefore, at any given moment in time, we find a mixture in which 38% of the molecules are trans-1,2-difluoroethene while the other 62% are cis-1,2-difluoroethene. The ratio of product to reactant is 38/62, or, K = 0.61.
The reason for this ratio is that, as the Figure: Reaction Energy Diagram above shows, the trans isomer is higher in Gibbs free energy than the cis isomer. In other words, ΔrG° for this reaction is positive:
As a molecule changes back and forth from cis to trans, on average, it spends more time in the lower Gibbs free energy form than the higher Gibbs free energy form. And this ΔrG° value gives us the observed equilibrium constant:
Please use this form to report any inconsistencies, errors, or other things you would like to change about this page. We appreciate your comments. 🙂 (Note that we cannot answer questions via the google form. If you have a question, please post it on Piazza.)
