
D20.2 Titration Curves
Titration is effective in quantitatively analyzing a solution’s acid (or base) concentration because pH changes rapidly near the equivalence point. In other words, there is a large observable change accompanying a small addition of titrant, which minimizes experimental uncertainty. For example, an acid-base indicator generally changes color over a range of about 2 pH units, so if pH increases (or decreases) by 2 or more pH units when 0.01 mL of titrant is added at the equivalence point, the color change would effectively signal the end point of the titration.
The figure below shows a titration curve, a graph of pH as a function of volume of titrant, for the titration of a 50.00-mL sample of 0.100-M hydrochloric acid with 0.100-M sodium hydroxide.
Exercise: Calculating pH for a Titration Curve
Now consider the titration of 50.00 mL of 0.100-M acetic acid (a weak acid) with 0.100-M sodium hydroxide (Figure: Titration curve (acetic acid and NaOH)). Comparing this titration curve to that of Figure: Titration curve (HCl and NaOH), we see that although the initial volumes and concentrations of the acids (acetic acid vs. HCl) are the same, the pH for acetic acid begins at a higher value and the titration curve maintains higher pH values up to the equivalence point. This is because, unlike HCl, acetic acid is only partially ionized.
The pH at the equivalence point is also higher (8.72 rather than 7.00) due to the presence of acetate anion, a weak base that raises the pH via the reaction:
After the equivalence point, the two titration curves are identical because the pH depends on the excess hydroxide ion from NaOH added in both cases.
Activity: Titration Equivalence Point
“For titration of several weak acids with strong base, the weaker the acid being titrated is, the more alkaline the pH is at the equivalence point.”
This statement is true under certain conditions. Explain why the statement is true and state the conditions needed to make it true.
Write in your notebook, then left-click here for an explanation.
The statement is true if the concentrations of the weak acids are the same and the concentration of the titrant (base) is the same. Also, all titrations must be carried out at the same temperature.
At the equivalence point, the solution contains the conjugate base of the weak acid. The weaker an acid is the stronger its conjugate base is. For a given concentration and temperature, the stronger base would have a higher pH, so the titration of the same initial concentration of a weaker acid with the same concentration of strong base has a more alkaline (higher pH) equivalence point.
Exercise: Calculating pH for a Weak-acid, Strong-base Titration
The midpoint of a titration is when half the volume of titrant needed to reach the equivalence point has been added. As part (b) in the above exercise shows, when titrating a weak acid with a strong base, the pH of the solution equals the pKa of the weak acid at the midpoint because we have added half the amount of strong base needed to react with all the weak acid. Therefore, the solution is a buffer and according to the Henderson-Hasselbalch equation:
![\text{pH} = \text{p}K_a + \text{log}\dfrac{[\text{weak base}]_0}{[\text{weak acid}]_0} = \text{p}K_a + \text{log}(1) = \text{p}K_a + 0 = \text{p}K_a](https://wisc.pb.unizin.org/app/uploads/quicklatex/quicklatex.com-9394fb7dd1afac79257ad1281342bfa3_l3.png "Rendered by QuickLaTeX.com")
Activity: Titration of a Weak Base with a Strong Acid
Consider the titration of 50.00 mL of 0.100-M ammonia (Kb = 1.77 × 10⁻⁵ M) with 0.100-M hydrochloric acid at 25 °C. Write the balanced chemical equation for the titration reaction. Without calculating any concentrations, sketch the titration curve for this titration. Explain how you estimated the pH halfway to the equivalence point. Is the pH at the equivalence point greater than or less than 7? Estimate the pH after a large excess of HCl has been added.
On the same axes, sketch a titration curve for titration of 50.00 mL of 0.100-M sodium hydrogen carbonate with 0.100-M hydrochloric acid. For hydrogen carbonate ion Kb = 2.3 × 10⁻⁸ M. Describe how this titration curve differs from the titration curve for ammonia. For each difference, explain why the curve is different.
Sketch two titration curves, then left-click here for an explanation.
The equation for the first titration (red curve in figure below) is
NH3(aq) + HCl(aq) → NH4Cl(aq)
Because ammonia is a weak base, the titration curve begins at pH > 7 but well below the pH of 0.1-M strong base (13).
Halfway to the equivalence point, when 25.00 mL HCl has been added, pH = pKa for the conjugate acid of ammonia. pKb for ammonia is
−log(1.77 × 10⁻⁵) = 4.752
and, for ammonium ion,
pKa = 14 − 4.752 = 9.248
Thus, halfway to the equivalence point the pH should be a little above 9.
At the equivalence point all the ammonia has been converted to its conjugate acid, ammonium ion. This weak acid causes the pH to be less than 7.
After a large excess of HCl, a strong acid, has been added, the pH is determined solely by the concentration of strong acid (0.100 M). Therefore the pH decreases toward a minimum value of −log(0.100) = 1.0. (If a 10-L 0.100-M HCl were added to the titration solution, the HCl would hardly be diluted by the small volume of base initially in the solution and the concentration of hydronium ions would approach 0.100 M.)
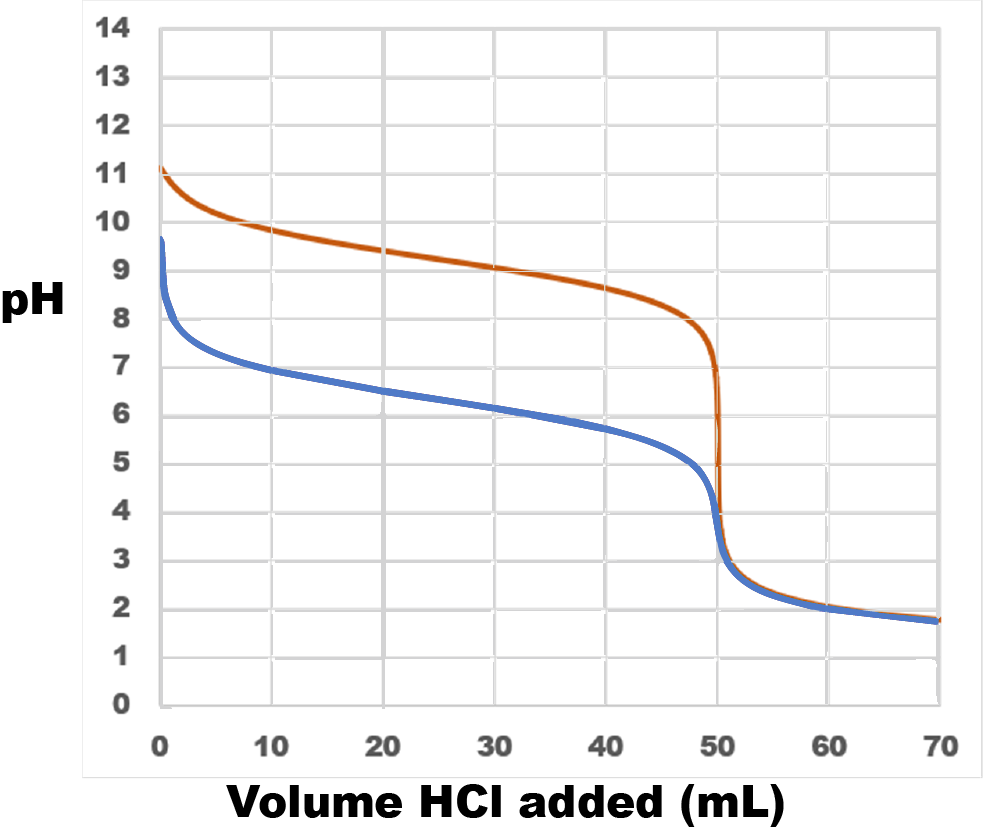
Sodium hydrogen carbonate contains hydrogen carbonate ion (HCO3−), an amphiprotic species. Adding strong acid causes hydrogen carbonate ion to act as a base. Because the Kb for hydrogen carbonate ion is smaller, it is a weaker base than ammonia. Consequently, the titration curve (blue curve in figure above) is lower on the pH scale. pKa for carbonic acid, H2CO3, the conjugate acid of hydrogen carbonate ion, is 14 − (−log(2.3 × 10⁻⁸)) = 6.36 so at the midpoiont of the titration the pH = 6.36.
Because hydrogen carbonate ion is a weaker base than ammonia, its conjugate acid H2CO3 is a stronger acid than ammonium ion. Therefore the equivalence point (where all the hydrogen carbonate ion has been converted to carbonic acid) has a lower pH than the equivalence point for the ammonia titration.
Once the equivalence point has been reached, the titration curve is exactly the same for both titrations because the pH depends only on the amount of HCl and the solution volume and those are the same in both cases.
Please use this form to report any inconsistencies, errors, or other things you would like to change about this page. We appreciate your comments. 🙂 (Note that we cannot answer questions via the google form. If you have a question, please post it on Piazza.)
