
15 Relationship between Reaction Rates, Temperature, and Activation Energy; Arrhenius Equation, Orientation Factor (M13Q8)
Learning Objectives
- Draw and interpret reaction coordinate diagrams, and identify the transition state(s) on these diagrams.
- Apply the Arrhenius equation to illustrate the effects of temperature and activation energy on reaction rate and recognize the reaction characteristics represented by the pre-exponential factor (A).
- Describe how collision frequencies and molecular orientations affect reaction rates.
| Key Concepts and Summary | Key Equations | Glossary | End of Section Exercises |
Activation Energy and the Arrhenius Equation
We can use the Arrhenius equation to relate the activation energy and the rate constant, k, of a given reaction:
k = A[latex]e^{-\frac{E_{a}}{RT}}[/latex]
In this equation, R is the ideal gas constant, which has a value 8.314[latex]\frac{J}{mol{\cdot}K}[/latex], T is temperature in Kelvin scale, Ea is the activation energy in [latex]\frac{J}{mol}[/latex], and A is a constant called the frequency factor, which is related to the frequency of collisions and the orientation of the reacting molecules.
Both postulates of the collision theory of reaction rates are accommodated in the Arrhenius equation. The frequency factor, A, is related to the rate at which collisions having the correct orientation occur. The exponential term, [latex]e^{-\frac{E_{a}}{RT}}[/latex], is related to the fraction of collisions providing adequate energy to overcome the activation barrier of the reaction.
At one extreme, the system does not contain enough energy for collisions to overcome the activation energy barrier. In such cases, no reaction occurs. At the other extreme, the system has so much energy that every collision with the correct orientation can overcome the activation barrier, causing the reaction to proceed. In such cases, the reaction is nearly instantaneous.
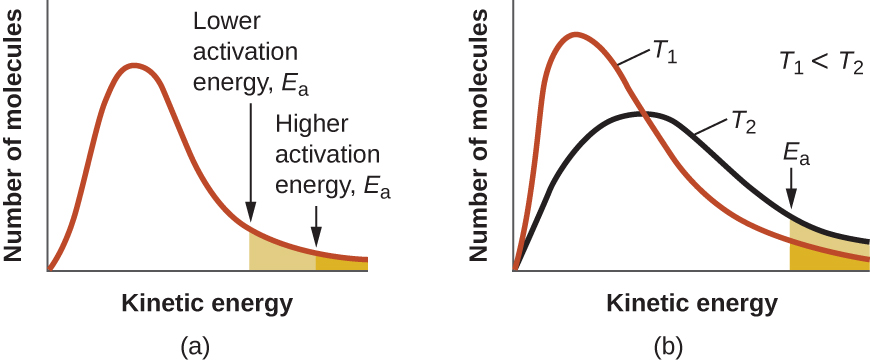
The Arrhenius equation describes quantitatively much of what we have already discussed about reaction rates. For two reactions at the same temperature, the reaction with the higher activation energy has the smaller rate constant and the slower rate. The larger value of Ea results in a smaller value for [latex]e^{-\frac{E_{a}}{RT}}[/latex], reflecting the smaller fraction of molecules with enough energy to react. Alternatively, the reaction with the smaller Ea has a larger fraction of molecules with enough energy to react. This will be reflected as a larger value of [latex]e^{-\frac{E_{a}}{RT}}[/latex], a larger rate constant, and a faster rate of reaction. An increase in temperature has the same effect as a decrease in activation energy. A larger fraction of molecules has the necessary energy to react (Figure 1), as indicated by an increase in the value of [latex]e^{-\frac{E_{a}}{RT}}[/latex]. The rate constant is also directly proportional to the frequency factor, A. Hence a change in conditions or reactants that increases the number of collisions with a favorable orientation for reaction results in an increase in A and, consequently, an increase in k.
A convenient approach to determining Ea for a reaction involves the measurement of k at different temperatures and using of an alternate version of the Arrhenius equation that takes the form of linear equation:
ln k = ([latex]\frac{-E_{a}}{R}[/latex])([latex]\frac{1}{T}[/latex]) + ln A
y = mx + b
Thus, a plot of ln k versus [latex]\frac{1}{T}[/latex] gives a straight line with the slope [latex]\frac{-E_{a}}{R}[/latex], from which Ea may be determined. The y-intercept gives the value of ln A.
In many situations, it is possible to obtain a reasonable estimate of the activation energy without going through the entire process of constructing the Arrhenius plot. The slope of the plot is:
[latex]\frac{\Delta (ln k)}{\Delta \frac{1}{T}}[/latex]
Slope is also equal to:
[latex]\frac{-E_{a}}{R}[/latex]
Put together:
[latex]\frac{\Delta (ln k)}{\Delta \frac{1}{T}}[/latex] = -[latex]\frac{E_{a}}{R}[/latex]
Solving for ln k
Δ ln k = (-[latex]\frac{E_{a}}{R}[/latex])(Δ [latex]{\frac{1}{T}}[/latex])
Substituting: Δ = final - initial
ln k2 - ln k1 = (-[latex]{\frac{E_{a}}{R}}[/latex] )( [latex]{ \frac{1}{T_{2}}}[/latex] - [latex]{ \frac{1}{T_{1}}}[/latex])
Substituting ln k2 - ln k1 = ln [latex]\frac{k_{2}}{k_{1}}[/latex]
This equation can be rearranged to give a one-step calculation to obtain a value for the activation energy.
Example 1
Determination of Ea
The variation of the rate constant with temperature for the decomposition of HI(g) to H2(g) and I2(g) is given here. What is the activation energy for the reaction?
2 HI(g) → H2(g) + I2(g)
| T (K) | k (M-1s-1) |
|---|---|
| 555 | 3.52 × 10⁻⁷ |
| 575 | 1.22 × 10⁻⁶ |
| 645 | 8.59 × 10⁻⁵ |
| 700 | 1.16 × 10⁻³ |
| 781 | 3.95 × 10⁻² |
Solution
Values of [latex]\frac{1}{T}[/latex] and ln k are:
| [latex]\frac{1}{T}[/latex] K-1 | ln k |
|---|---|
| 1.80 × 10⁻³ | −14.860 |
| 1.74 × 10⁻³ | −13.617 |
| 1.55 × 10⁻³ | −9.362 |
| 1.43 × 10⁻³ | −6.759 |
| 1.28 × 10⁻³ | −3.231 |
Figure 2 is a graph of ln k versus [latex]\frac{1}{T}[/latex]. To determine the slope of the line, we need two values of ln k, which are determined from the line at two values of [latex]\frac{1}{T}[/latex] (one near each end of the line is preferable). For example, the value of ln k determined from the line when [latex]\frac{1}{T}[/latex] = 1.25 x 10⁻³ K-1 is −2.593 K-1; the value when [latex]\frac{1}{T}[/latex] = 1.78 x 10⁻³ K-1 is −14.447 K-1.
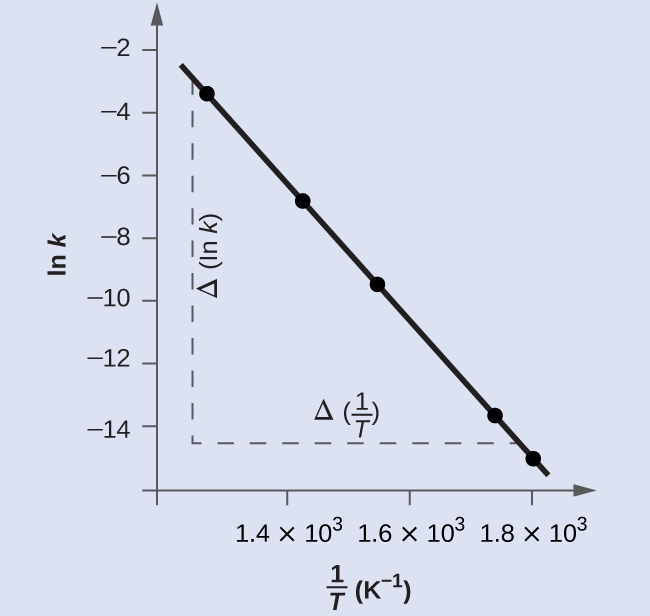
The slope of this line is given by the following expression:
Slope = [latex]\frac{\Delta\: ln[A]}{\Delta\:t}[/latex] = [latex]\frac{(-14.447)\:\:-\:\:(-2.593)}{(1.78\:\times10^{-3}\:K^{-1})\:\:-\:\:(1.25\:\times10^{-3}\:K^{-1})}[/latex] = -2.2 [latex]\times[/latex]104 K
Thus:
Ea = -slope × R = -2.2 × 104 K × 8.314 [latex]\frac{J}{mol \cdot K}[/latex]
Ea = 1.8 × 10⁵ [latex]\frac{J}{mol}[/latex]
Using the experimental data presented here, we can simply select two data entries. For this example, the first entry and the last entry are used:
| T (K) | k (M-1s-1) | [latex]\frac{1}{T}[/latex] K-1 | ln k |
| 555 | 3.52 × 10⁻⁷ | 1.80 × 10⁻³ | −14.860 |
| 781 | 3.95 × 10⁻² | 1.28 × 10⁻³ | −3.231 |
After calculating  and ln k, we can substitute into the equation:
Ea = -8.314 [latex]\frac{J}{mol{\cdot}K}[/latex] ([latex]\frac{(-3.231\:-\:(-14.860))}{(1.28\times10^{-3}K^{-1}\: -\:1.80\times10^{-3}K^{-1}) }[/latex]
and the result is Ea = 185,900 [latex]\frac{J}{mol}[/latex].
This method is very effective, especially when a limited number of temperature-dependent rate constants are available for the reaction of interest.
Check Your Learning
The rate constant for the rate of decomposition of N2O5 to NO and O2 in the gas phase is 1.66 M-1s-1 at 650 K and 7.39 M-1s-1 at 700 K:
2 N2O5(g) → 4 NO(g) + 3 O2(g)
Assuming the kinetics of this reaction are consistent with the Arrhenius equation, calculate the activation energy for this decomposition.
Answer:
113,000 [latex]\frac{J}{mol}[/latex]
Reaction Rate, Activation Energy, and Temperature
The rate constant is directly proportional to temperature and inversely proportion to the activation energy:
k = A[latex]e^{-\frac{E_{a}}{RT}}[/latex]
Because the rate constant is directly proportional to the reaction rate, the relationship between rate, activation energy, and temperature can be summarized as follows:
- Reactions with values of small Ea (Ea< 15 kJ/mol) are fast and not very temperature sensitive.
- Reactions with values of large Ea (Ea > 120 kJ/mol) are slow and very temperature-sensitive.
- Many common reactions have Ea in the range of 50-100 kJ/mol. The rates of these reactions more-or-less double every 10°C temperature increase.
Key Concepts and Summary
The Arrhenius equation allows us to calculate the activation energy of a reaction, once a few other variables are known. In the most common form of the Arrhenius equation (k = A[latex]e^{-\frac{E_{a}}{RT}}[/latex]), the rate constant and frequency factor are variables along with the activation energy and temperature. In the graphable form of the equation (ln k = ([latex]\frac{-E_{a}}{R}[/latex])([latex]\frac{1}{T}[/latex]) + ln A), multiple rate constants are needed at different temperatures and the slope is related to the activation energy. In the last form of the equation (ln [latex]\frac{k_{2}}{k_{1}}[/latex] = (-[latex]{\frac{E_{a}}{R}}[/latex] )( [latex]{ \frac{1}{T_{2}}}[/latex] - [latex]{ \frac{1}{T_{1}}}[/latex])), only two rate constants are needed at two different temperatures to calculate the activation energy. To determine which equation to use in a particular situation, focus on the variables that you are given and find the equation that matches those variables.
Key Equations
- k = A[latex]e^{-\frac{E_{a}}{RT}}[/latex]
- ln k = ([latex]\frac{-E_{a}}{R}[/latex])([latex]\frac{1}{T}[/latex]) + ln A
- ln [latex]\frac{k_{2}}{k_{1}}[/latex] = (-[latex]{\frac{E_{a}}{R}}[/latex] )( [latex]{ \frac{1}{T_{2}}}[/latex] - [latex]{ \frac{1}{T_{1}}}[/latex])
Glossary
Arrhenius equation
an equation that relates the activation energy and rate constant of a reaction
frequency factor (A)
a constant in the Arrhenius equation that is related to the frequency of collisions and the orientation of reacting molecules
Chemistry End of Section Exercises
- The rate of a certain reaction doubles for every 10°C rise in temperature.
- How much faster does the reaction proceed at 45°C than at 25°C?
- How much faster does the reaction proceed at 95°C than at 25°C?
- In an experiment, a sample of NaClO3 was 90% decomposed in 48 min. Approximately how long would this decomposition have taken if the sample had been heated 20 °C higher?
- The rate constant at 325 °C for the decomposition reaction
C4H8 (g) → 2 C2H4(g) is 6.1 × 10⁻⁸ s-1 and the activation energy is 261 kJ per mole of C4H8. Determine the frequency factor for the reaction. - The rate constant for the decomposition of acetaldehyde, CH3CHO, to methane, CH4, and carbon monoxide, CO, in the gas phase is 1.1 × 10⁻² M-1s-1 at 703 K and 4.95 M-1s-1 at 865 K. Determine the activation energy for this decomposition.
- An elevated level of the enzyme alkaline phosphatase (ALP) in the serum is an indication of possible liver or bone disorder. The level of serum ALP is so low that it is very difficult to measure directly. However, ALP catalyzes a number of reactions, and its relative concentration can be determined by measuring the rate of one of these reactions under controlled conditions. One such reaction is the conversion of p-nitrophenyl phosphate (PNPP) to p-nitrophenoxide ion (PNP) and phosphate ion. Control of temperature during the test is very important; the rate of the reaction increases 1.47 times if the temperature changes from 30 °C to 37 °C. What is the activation energy for the ALP–catalyzed conversion of PNPP to PNP and phosphate?
- Hydrogen iodide, HI, decomposes in the gas phase to produce hydrogen, H2, and iodine, I2. The value of the rate constant, k, for the reaction was measured at several different temperatures and the data are shown here:
Temperature (K) k (M−1 s−1) 555 6.23 × 10⁻⁷ 575 2.42 × 10⁻⁶ 645 1.44 × 10⁻⁴ 700 2.01 × 10⁻³ What is the value of the activation energy (in kJ/mol) for this reaction?
- The hydrolysis of the sugar sucrose to the sugars glucose and fructose,
C12H22O11(s) + H2O(l) → C6H12O6(s) + C6H12O6(s) follows a first-order rate equation for the disappearance of sucrose: Rate = k[C12H22O11].- Note that the products of the reaction, glucose and fructose, have the same molecular formulas but differ in the arrangement of the atoms in their molecules.How are these molecules related?
- In neutral solution, k = 2.1 × 10⁻¹¹ s−1 at 27 °C and 8.5 × 10⁻¹¹ s−1 at 37 °C. Determine the activation energy and the rate constant for this equation at 47 °C (assuming the kinetics remain consistent with the Arrhenius equation at this temperature).
- When a solution of sucrose with an initial concentration of 0.150 M reaches equilibrium, the concentration of sucrose is 1.65 × 10⁻⁷ M. How long will it take the solution to reach equilibrium at 27 °C in the absence of a catalyst? Because the concentration of sucrose at equilibrium is so low, assume that the reaction is irreversible.
- Why does assuming that the reaction is irreversible simplify the calculation in part (b)?
Answers to Chemistry End of Section Exercises
- (a) 4 times faster (b) 128 times faster
- 4 times faster
- 3.9 × 10¹⁵ s-1
- 190.66 kJ/mol
- Remember rate is proportional to k. 43.0 kJ/mol
- 180. kJ/mol
- (a) They are structural isomers; (b) Ea = 134 kJ/mol; k = 1.43 × 10⁻⁸ s−1; (c) 1.81 × 10⁸ h or 7.6 × 10⁶ day.; (d) Assuming that the reaction is irreversible simplifies the calculation because we do not have to account for any reactant that, having been converted to product, returns to the original state.

Feedback/Errata