
44 ΔG and ΔG° (M17Q5)
Learning Objectives
- Distinguish between ΔG° (standard state conditions) and ΔG (nonstandard state conditions).
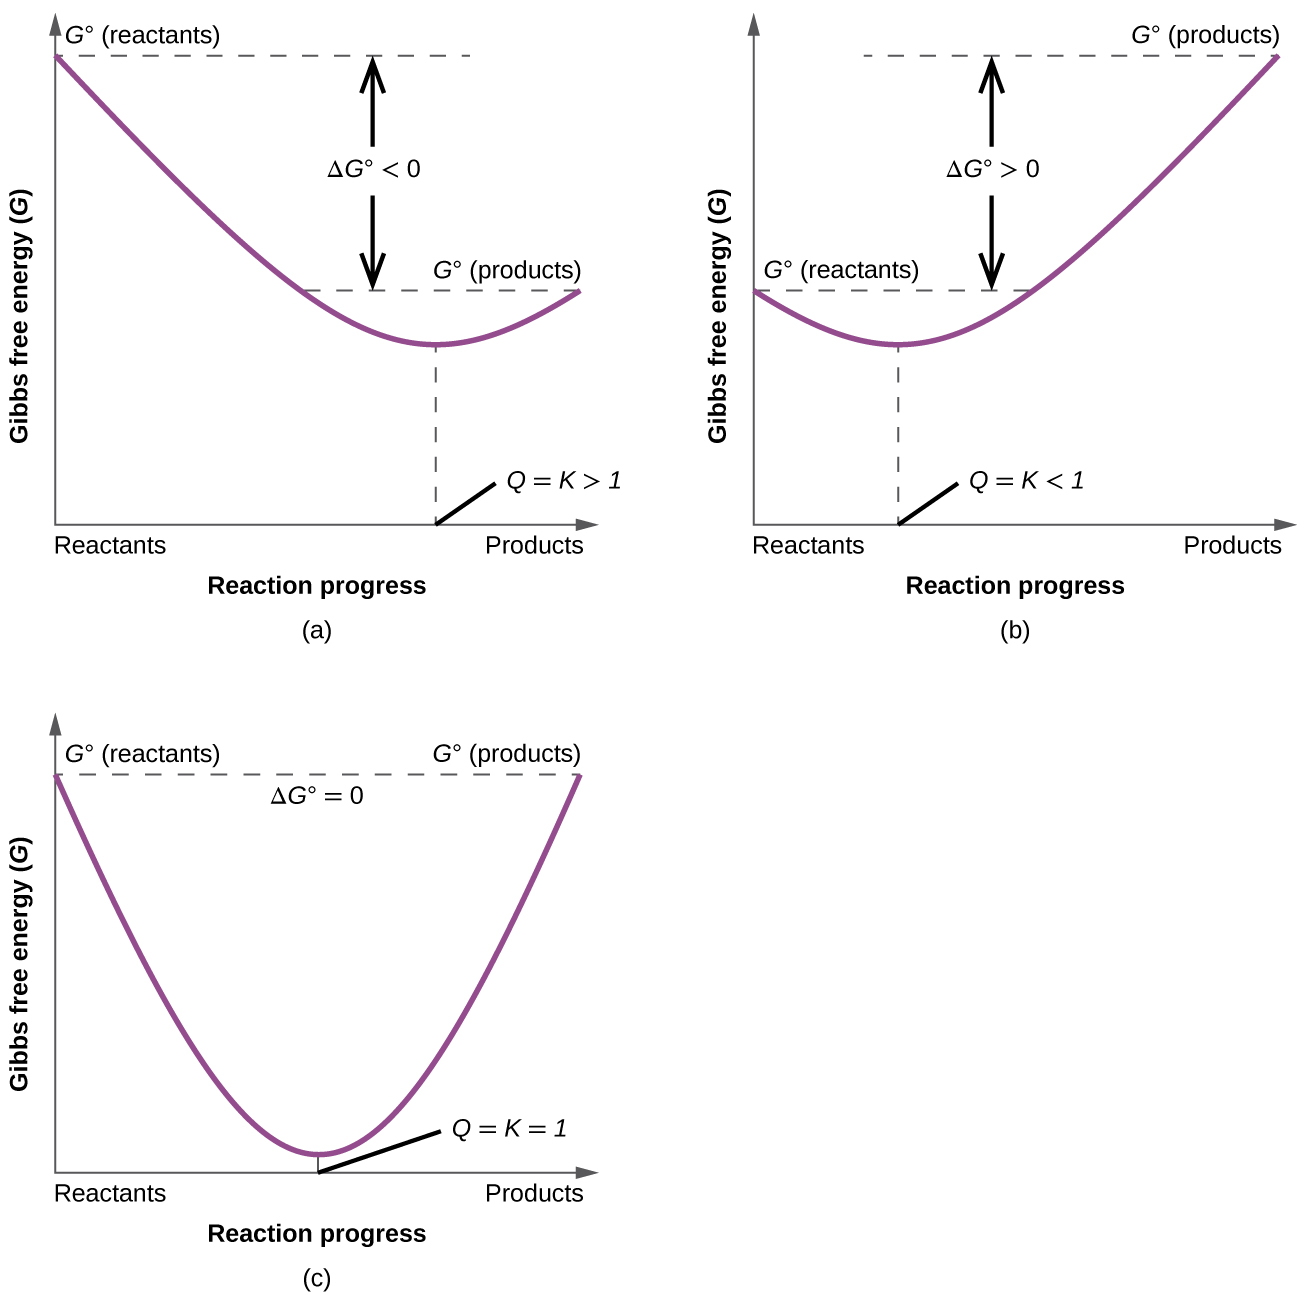
- Identify and classify product-favored processes as those where K > 1 and ΔG° < 0. Identify and classify reactant-favored processes as those where K < 1 and ΔG° > 0.
- Recognize that when Q < K, ΔG < 0 and a reaction proceeds to form more products until equilibrium is reached (Q = K, ΔG = 0). Recognize that when Q > K, ΔG > 0 and a reaction proceeds to form more reactants until equilibrium is reached (Q = K, ΔG = 0).
| Key Concepts and Summary | Key Equations | End of Section Exercises |
Free Energy and Equilibrium
The free energy change for a process may be viewed as a measure of its driving force. A negative value for ΔG represents a driving force for the process in the forward direction, while a positive value represents a driving force for the process in the reverse direction. When ΔG is zero, the forward and reverse driving forces are equal, and so the process occurs in both directions at the same rate (the system is at equilibrium).
In the section on equilibrium, the reaction quotient, Q, was introduced as a convenient measure of the status of an equilibrium system. When Q is less than the equilibrium constant, K, the reaction will proceed in the forward direction until equilibrium is reached and Q = K. Conversely, if Q > K, the process will proceed in the reverse direction until equilibrium is achieved.
The free energy change for a process taking place with reactants and products present under nonstandard conditions, ΔG, is related to the standard free energy change, ΔG°, according to this equation:
R is the gas constant (8.314 J/K mol), T is the kelvin or absolute temperature, and Q is the reaction quotient. We may use this equation to predict the spontaneity for a process under any given set of conditions as illustrated in Example 1.
Example 1
Calculating ΔG under Nonstandard Conditions
What is the free energy change for the process shown here under the specified conditions?
T = 25 °C, PN[latex]_{2}[/latex] = 0.870 atm, PH[latex]_{2}[/latex] = 0.250 atm, and PNH[latex]_{3}[/latex] = 12.9 atm.
Solution
The equation relating free energy change to standard free energy change and reaction quotient may be used directly:
Since the computed value for ΔG is positive, the reaction is nonspontaneous under these conditions.
Check Your Learning
Calculate the free energy change for this same reaction at 875 °C in a 5.00 L mixture containing 0.100 mol of each gas. Is the reaction spontaneous under these conditions?
Answer:
ΔG = −41.7 kJ; yes
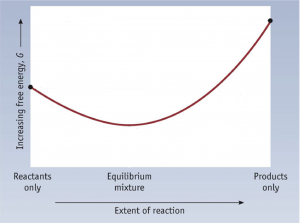
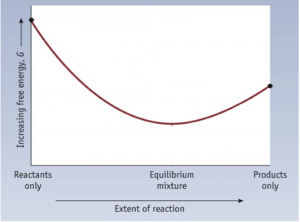
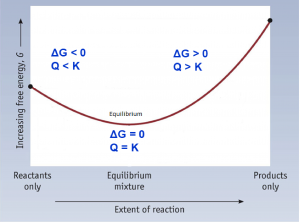
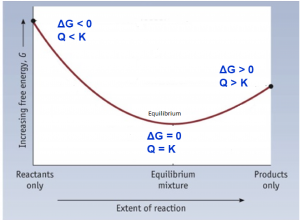
To further illustrate the relationship between ΔG and ΔG°, consider the observation that reactions spontaneously proceed in a direction that ultimately establishes equilibrium. By plotting the free energy change versus the extent of the reaction (for example, as reflected in the value of Q), we can see that equilibrium is established when the system’s free energy is minimized (Figure 1).
If a system is present with reactants and products present in nonequilibrium amounts (Q ≠ K), the reaction will proceed spontaneously in the direction necessary to establish equilibrium. In Figure 1, if the system is to the left (more reactant-favored) than the minimum, Q < K and the reaction proceeds towards products to achieve equilibrium. If the system is to the right (more product favored) than the minimum, Q > K and the reaction proceeds towards reactants to achieve equilibrium.
Key Concepts and Summary
As we have already seen, when we consider systems at equilibrium, we can also use the reaction quotient (Q) to measure the status of an equilibrium system. When Q < K, the reaction will proceed in the forward direction until equilibrium is reached and Q = K. If Q > K, the process will proceed in the reverse direction until equilibrium is achieved. When considering the reaction quotient, we use the free energy under nonstandard conditions (ΔG). Free energy under standard conditions (ΔGº) is always considered at equilibrium and is a constant value regardless of the status of the equilibrium system.
Key Equations
- ΔG = ΔG° + RT ln Q
Chemistry End of Section Exercises
- What is the difference between ΔG and ΔG° for a chemical change?
- At constant temperature, which of the following values may vary: ΔG, ΔG°, Q, K?
- Explain what happens as a reaction starts with ΔG < 0 (negative) and reaches the point where ΔG = 0.
- Under what conditions are ΔG and ΔG° equal, under the same temperatures?
- Consider the ammonia synthesis process:
N2(g) + 3 H2(g) ⇌ 2 NH3(g)
where ΔH° = -91.8 kJ/mol, ΔS° = -198.1 J/mol·K, and ΔG° = -33.0 kJ/mol at 25°C. Calculate ΔG under the following conditions and indicate which direction (toward products or reactants) the reaction will shift to achieve equilibrium:- PN[latex]_2[/latex] = 1.00 atm, PH[latex]_2[/latex]= 3.00 atm, PNH[latex]_3[/latex] = 0.750 atm, T = 298 K
- PN[latex]_2[/latex] = 0.0500 atm, PH[latex]_2[/latex]= 0.0250 atm, PNH[latex]_3[/latex] = 3.50 atm, T = 313 K
- PN[latex]_2[/latex] = 1.0 atm , PH[latex]_2[/latex]= 1.0 atm, PNH[latex]_3[/latex] = 1.0 atm, T = 298 K
- Label each of the graphs with the following: Q < K, Q > K, Q = K, ΔG < 0, ΔG > 0, ΔG = 0, and equilibrium:
Answers to Chemistry End of Section Exercises
- ΔG° is free energy change for a process taking place with reactants and products present under standard conditions. ΔG is free energy change for a process taking place with reactants and products present under nonstandard conditions. ΔG is related to the standard free energy change, ΔG°, according to this equation: ΔG = ΔG° + RT ln Q.
- ΔG° and K are constant at constant temperature. ΔG and Q vary with different amounts of reactants and products.
- When ΔG is negative, the reaction will proceed toward the products until equilibrium is reached, ΔG = 0.
- ΔG and ΔG° are equal when the reaction is under standard conditions; when all concentrations are 1 M and all gas partial pressures are 1 bar (approximately 1 atm). Under standard conditions, Q = 1 and RT ln Q = 0, so ΔG = ΔG°.
-
- -42.6 kJ/mol; ΔG < 0 so reaction will move toward products to achieve equilibrium
- 13.3 kJ/mol; ΔG > 0 so reaction will move toward reactants to achieve equilibrium
- -33.0 kJ/mol; ΔG < 0 so reaction will move toward products to achieve equilibrium
-

Feedback/Errata