Additional Reading Materials
Chapter 14: Equilibrium and Free Energy
Ch14.1 Le Châtelier’s Principle
Reactions proceed in both directions (reactants go to form products and products go to form reactants). We can tell a reaction is at equilibrium if the reaction quotient (Q) is equal to the equilibrium constant (K). If a system at equilibrium is subjected to a perturbance or stress (such as a change in concentration), the position of equilibrium changes. Since this stress affects the concentrations of the reactants and the products, Q will no longer equal to K. To re-establish equilibrium, the system will either shift toward the products (if Q < K) or the reactants (if Q > K) until Q returns to the same value as K.
This process is described by Le Châtelier’s principle: When a chemical system at equilibrium is disturbed, it returns to equilibrium by counteracting the disturbance. The disturbance causes a change in Q; the reaction will shift to re-establish Q = K.
Ch14.2 Effect of Change in Concentration on Equilibrium
A chemical system at equilibrium can be shifted out of equilibrium by adding or removing one or more of the reactants or products. The concentrations of both reactants and products then undergo additional changes to return the system to equilibrium.
The stress on the system in Figure 1 is the reduction of the equilibrium concentration of SCN−(aq) (lowering the concentration of one of the reactants would cause Q to be larger than K). As a consequence, Le Châtelier’s principle leads us to predict that the concentration of Fe(SCN)2+(aq) should decrease, thereby increasing the concentration of SCN−(aq) part way back to its original concentration, and increasing the concentration of Fe3+ above its initial equilibrium concentration.
The effect of a change in concentration on a system at equilibrium is illustrated further by the equilibrium of the chemical reaction:
The numeric values for this example have been determined experimentally. A mixture of gases at 400 °C with [H2] = [I2] = 0.221 M and [HI] = 1.563 M is at equilibrium. For this mixture, Qc = Kc = 50.0. If H2 is introduced into the system quickly such that its concentration doubles before it begins to react (new [H2] = 0.442 M), Qc is now [latex]\frac{1}{2}[/latex] of Kc:
Or by pluggin in the values:
The reaction will shift so that a new equilibrium is reached, at which [H2] = 0.374 M, [I2] = 0.153 M, and [HI] = 1.692 M. This gives:
We have stressed this system by introducing additional H2. The stress is relieved when the reaction shifts to the right, using up some (but not all) of the excess H2, reducing the amount of I2, and forming additional HI.
Ch14.3 Effect of Change in Volume on Equilibrium
For aqueous reactions, changing the solution volume by addition (or removal) of solvent is analogous to reducing (or increasing) the concentrations of all aqueous reaction species. Le Châtelier’s principle leads us to predict that the equilibrium position would shift towards the side with more solute particles when solvent is added, and shift towards the side with less solute particles when solvent is removed.
For example, when water is added to the following equilibrium such that the solution volume is doubled:
all the aqueous species concentrations are halved. Hence:
and the reaction would proceed towards the reactant side (the side with more solute particles) as equilibrium is re-established.
Ch14.4 Effect of Change in Pressure or Volume on Equilibrium
Sometimes we can change the position of equilibrium by changing the pressure of a system. However, changes in pressure have a measurable effect only in systems in which gases are involved, and then only when the chemical reaction produces a change in the total number of gas molecules in the system. An easy way to recognize such a system is to look for different numbers of moles of gas on the reactant and product sides of the equilibrium. While evaluating pressure (as well as related factors like volume), it is important to remember that equilibrium constants are defined with regard to concentration (for Kc) or partial pressure (for KP). Some changes to total pressure, like adding an inert gas that is not part of the equilibrium, will change the total pressure but not the partial pressures of the gases in the equilibrium constant expression. Thus, addition of a gas not involved in the equilibrium will not perturb the equilibrium.
Check out this link to see a dramatic visual demonstration of how equilibrium changes with pressure changes.
As we increase the pressure of a gaseous system at equilibrium, either by decreasing the volume of the system or by adding more of one of the components of the equilibrium mixture, we introduce a stress by increasing the partial pressures of one or more of the components. In accordance with Le Châtelier’s principle, a shift in the equilibrium that reduces the total number of molecules per unit of volume will be favored because this relieves the stress. The reverse reaction would be favored by a decrease in pressure.
Consider what happens when we increase the pressure on a system in which NO, O2, and NO2 are at equilibrium:
The formation of additional amounts of NO2 decreases the total number of molecules in the system because each time two molecules of NO2 form, a total of three molecules of NO and O2 are consumed. This reduces the total pressure exerted by the system and reduces the stress of the increased pressure. On the other hand, a decrease in the pressure on the system favors decomposition of NO2 into NO and O2, which tends to restore the pressure.
Now consider this reaction:
Because there is no change in the total number of molecules in the system during reaction, a change in pressure does not favor either formation or decomposition of gaseous nitrogen monoxide.
Ch14.5 Effect of Change in Temperature on Equilibrium
Changing concentration or pressure perturbs an equilibrium because the reaction quotient is shifted away from the equilibrium value. Changing the temperature of a system at equilibrium has a different effect: A change in temperature actually changes the value of the equilibrium constant. However, we can still qualitatively predict the effect of the temperature change by treating it as a stress on the system and applying Le Châtelier’s principle.
When hydrogen reacts with gaseous iodine, heat is released.
Because this reaction is exothermic, we can write it with heat as a product.
Increasing the temperature of the reaction increases the internal energy of the system, and has the effect of increasing the amount of one of the products of this reaction. The reaction shifts to the left to relieve the stress, and there is an increase in the concentration of H2 and I2 and a reduction in the concentration of HI. Lowering the temperature of this system reduces the amount of energy present, favors the production of heat, and favors the formation of hydrogen iodide.
When we change the temperature of a system at equilibrium, the equilibrium constant for the reaction changes. Lowering the temperature in the HI system increases the equilibrium constant: At the new equilibrium the concentration of HI has increased and the concentrations of H2 and I2 decreased. Raising the temperature decreases the value of the equilibrium constant, from Kc = 67.5 at 357 °C to Kc = 50.0 at 400 °C.
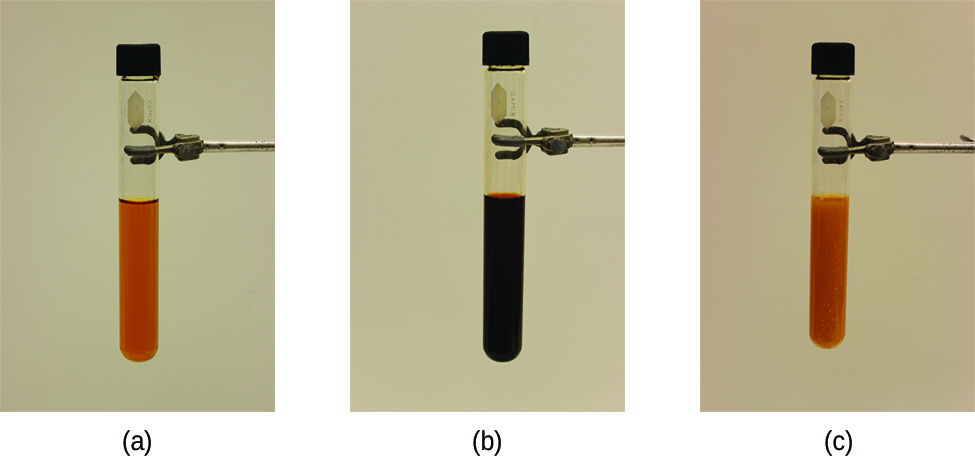
Temperature affects the equilibrium between NO2 and N2O4 in the reaction
The positive ΔH value tells us that the reaction is endothermic and can be written as
At higher temperatures, the gas mixture has a deep brown color, indicative of a significant amount of brown NO2 molecules. If, however, we put a stress on the system by cooling the mixture (withdrawing energy), the equilibrium shifts to the left to supply some of the energy lost by cooling. The concentration of colorless N2O4 increases, and the concentration of brown NO2 decreases, causing the brown color to fade.
This interactive animation allows you to apply Le Châtelier’s principle to predict the effects of changes in concentration, pressure, and temperature on reactant and product concentrations.
Ch14.6 Catalysts and Equilibrium
As we learned during our study of kinetics, a catalyst can speed up the rate of a reaction. Though this increase in reaction rate may cause a system to reach equilibrium more quickly (by speeding up the forward and reverse reactions), a catalyst has no effect on the value of an equilibrium constant nor on equilibrium concentrations.
Ch14.7 Free Energy and Equilibrium
The free energy change for a reaction may be viewed as a measure of its driving force. A negative ΔG represents a finite driving force for the reaction in the forward direction, while a positive ΔG represents a driving force in the reverse direction. When ΔG is zero, the forward and reverse driving forces are equal, and so the process occurs in both directions at the same rate (the system is at equilibrium).
The reaction quotient, Q, was introduced as a convenient measure of the status of an equilibrium system. When Q is lesser than the equilibrium constant, K, the reaction will proceed in the forward direction until equilibrium is reached and Q = K. Conversely, if Q < K, the process will proceed in the reverse direction until equilibrium is achieved.
The free energy change for a reaction taking place with reactants and products present under nonstandard conditions, ΔG, is related to the standard free energy change, ΔG°, according to the equation:
R is the gas constant (8.314 J/K mol), T is the absolute temperature (in kelvin), and Q is the reaction quotient. We may use this equation to predict the spontaneity for a process under any given set of conditions as illustrated in Example 1.
Example 1
Calculating ΔG under Nonstandard Conditions
What is the free energy change for the process shown here under the specified conditions?
T = 25 °C, [latex]\text{P}_{\text{N}_2} = 0.870\;\text{bar}[/latex], [latex]\text{P}_{\text{H}_2} = 0.250\;\text{bar}[/latex], and [latex]\text{P}_{\text{NH}_3} = 12.9\;\text{bar}[/latex]
Solution
The equation relating free energy change to standard free energy change and reaction quotient may be used directly:
Since the computed value for ΔG is positive, the reaction is nonspontaneous under these conditions.
Check Your Learning
Calculate the free energy change for this same reaction at 25 °C in a 5.00 L mixture containing 0.100 mol of each gas. Is the reaction spontaneous under these conditions?
Answer:
ΔG = 13.6 kJ/mol; no
For a system at equilibrium, Q = K and ΔG = 0, and the previous equation may be written as
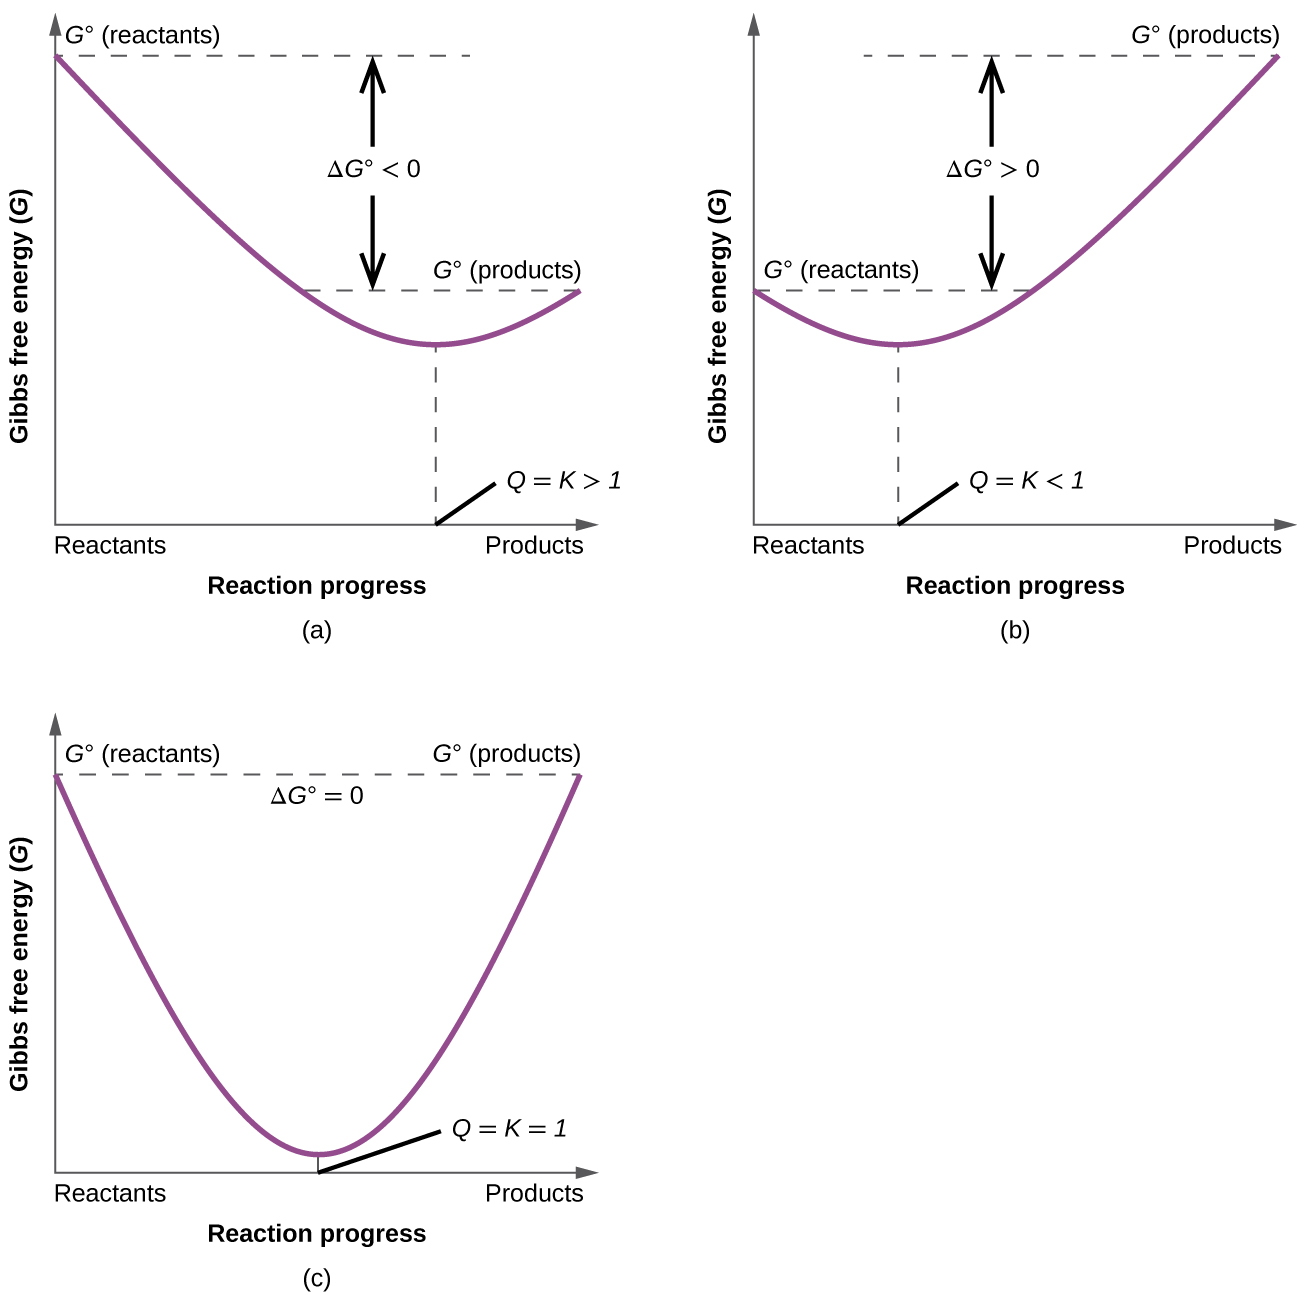
This form of the equation provides a useful link between these two essential thermodynamic properties, and it can be used to derive equilibrium constants from standard free energy changes and vice versa. The relations between standard free energy changes and equilibrium constants are summarized in Table 1.
| Kº | ΔG° | Comments |
|---|---|---|
| > 1 | < 0 | Products are more abundant at equilibrium. |
| < 1 | > 0 | Reactants are more abundant at equilibrium. |
| = 1 | = 0 | Reactants and products are equally abundant at equilibrium. |
| Table 1. Relations between Standard Free Energy Changes and Equilibrium Constants | ||
Note that the standard equilibrium constant, Kº, is the equilibrium constant (K) with each concentration divided by the standard-state concentration of 1 M and each pressure divided by the standard-state pressure of 1 bar. Hence, Kº is truly unitless.
Example 2
Calculating an Equilibrium Constant using Standard Free Energy Change
Given that the standard free energies of formation of Ag+(aq), Cl−(aq), and AgCl(s) are 77.1 kJ/mol, −131.2 kJ/mol, and −109.8 kJ/mol, respectively, calculate the equilibrium constant for the solubility of AgCl at 298.15 K.
Solution
The ΔG° for this reaction is first computed using standard free energies of formation for its reactants and products:
The equilibrium constant for the reaction may then be derived from its ΔG°:
Check Your Learning
Use the thermodynamic data provided in Appendix to calculate the equilibrium constant for the dissociation of dinitrogen tetroxide at 25 °C.
Answer:
K = 6.7
Ch14.8 Variations During a Reaction
To further illustrate the relation between these two essential thermodynamic concepts, consider the observation that reactions spontaneously proceed in a direction that ultimately establishes equilibrium. As may be shown by plotting the free energy (G) versus the extent of the reaction (for example, as reflected in the value of Q), equilibrium is established when the system’s free energy is minimized (Figure 2). If a system is present with reactants and products present in nonequilibrium amounts (Q ≠ K), the reaction will proceed spontaneously in the direction necessary to establish equilibrium.
Ch14.9 Effect of Temperature
Recall that the standard free energy change at different temperatures can be calculated from the enthalpy and entropy of the reaction:
Therefore:
and the standard equilibrium constant at different temperatures can also be calculated. Note that this assumes ΔH° and ΔS° do not vary as a function of temperature. This is an assumption we will generally make in this course, unless otherwise specified.
The fact that ΔG° and K are related provides us with another explanation of why equilibrium constants are temperature dependent. The above equation can be rearranged by dividing both sides by -RT:
For an exothermic reaction (ΔH° < 0), the magnitude of K decreases with increasing temperature, whereas for an endothermic reaction (ΔH° > 0), the magnitude of K increases with increasing temperature. The quantitative relationship expressed in this equation agrees with the qualitative predictions made by applying Le Chatelier’s principle. It also shows that the magnitude of ΔH° dictates how rapidly K changes as a function of temperature. In contrast, the magnitude and sign of ΔS° affect the magnitude of K but not its temperature dependence.
If we know the value of K at a given temperature and the value of ΔH° for a reaction, we can estimate the value of K at any other temperature, even in the absence of information on ΔS°. Suppose, for example, that K1 and K2 are the equilibrium constants for a reaction at temperatures T1 and T2, respectively:
Subtracting lnK1 from lnK2 would yield:
Thus calculating ΔH° from tabulated enthalpies of formation and measuring the equilibrium constant at one temperature (K1) allow us to calculate the value of the equilibrium constant at any other temperature (K2), assuming that ΔH° and ΔS° are independent of temperature.
Finally, we can see that the relation
has a linear “y = mx + b” form, and a plot of lnK° vs [latex]\frac{1}{T}[/latex] would yield a slope of [latex]-\frac{{\Delta}H^{\circ}}{R}[/latex] and an intercept of [latex]\frac{{\Delta}S^{\circ}}{R}[/latex]. This is the van’t Hoff plot. By experimentally measuring the concentrations of reactants and products at different temperatures, such a plot can provide the enthalpy and entropy of the reaction from the experimental data.
Ch14.10 Free Energy and Work
Recall that when we talk about the thermodynamics of a reaction, we are concerned primarily with the difference in energy between reactants (R) and products (P): whether the reaction as a whole is uphill or downhill. When we talk about kinetics, on the other hand, we are concerned with the rate of the reaction: how fast it goes from reactants to products, regardless of whether that transformation is energetically uphill or downhill.
When the energy level of the products is lower than that of the reactants, the Gibbs free-energy change for the reaction is negative (${\Delta}G^{\circ}_r$ < 0), and the reaction is exergonic, or energy releasing. We can also say the reaction is “thermodynamically favorable”, or, more informally, “downhill”.
Conversely, an endergonic reaction is one in which the products are higher in energy than the reactants, and energy is absorbed. An endergonic reaction has a positive ${\Delta}G^{\circ}_r$, and a Keq < 1 (Figure 3).
The Gibbs free energy has another very useful property. The decrease in free energy as a reaction occurs corresponds to the maximum possible quantity of useful work that can be obtained from the reaction (-ΔG = wmax).
Conversely, if a reaction has positive ΔG, work must be done on the system to force the nonspontaneous reaction to occur. The minimum work that must be done is given by ΔG. As an example of the utility of this interpretation of ΔG, consider the recovery of Al from Al2O3 ore:
The positive ΔG tells us that at least 1576.4 kJ of work must be done on 1 mol of Al2O3 to effect this change. In a modern aluminum manufacturing plant this work is supplied electrically, and the electricity is often provided by burning coal. Assuming coal to be mainly carbon, we can write:
Thus 1 mol C can do almost exactly one-quarter the work required to decompose 1 mol Al2O3 and we must burn at least 4 mol C to process each 1 mol Al2O3 ore. (In practice the aluminum smelting process is only 17 percent efficient, so it is necessary to burn nearly 6 times the theoretical 4 mol C.)
In other words, if you add the reaction equations and apply Hess’s Law, you will see that the overall reaction has a negative ΔG° when 4 mol C are used per mole of Al2O3:
In the context we have just described, free energy is energy that is available to do useful work, not energy that we can get for nothing. When a spontaneous process occurs and there is a free energy decrease, it is the availability of useful energy which decreases. According to the first law of thermodynamics, energy cannot be consumed in any process, but according to the second law, free (or available) energy is always consumed in a spontaneous process.
When we talk about consuming energy resources by burning fossil fuels, it is the availability of energy that is used up. The energy originally stored in a fuel is converted to heat energy and dispersed to the surroundings. Once this has happened its usefulness is lost. There is no way of abstracting this energy from the surroundings and using it to lift a weight or do other useful work, because that would correspond to the reversal of a spontaneous process. The second law thus adds a very important qualification to the first law. While the first law tells us that we cannot destroy energy, the second law tells as that we cannot recycle it either.
Ch14.11 Coupled Reactions
Many reactions are endergonic (i.e., not spontaneous (ΔG > 0)) and require energy to be externally applied to occur. However, these reaction can be coupled to a separate, exergonic (thermodynamically favorable (ΔG < 0)) reactions that ‘drive’ the thermodynamically unfavorable one by coupling or ‘mechanistically joining’ the two reactions often via a share intermediate. Since Gibbs Energy is a state function, the ΔG values for each half-reaction may be summed, to yield the combined ΔG of the coupled reaction.
For example, consider the decomposition of calcium carbonate:
The strongly positive ΔG° for this reaction makes it reactant-favored. If the temperature is raised above 837 ºC, this reaction becomes spontaneous and favors the products. Now, let’s consider a second and completely different reaction that can be coupled to this reaction. The combustion of coal:
If we add the above two reactions:
and apply Hess’s Law, the combined reaction is product-favored with ΔG° = −264.0 kJ/mol. This is because the reactant-favored reaction is linked to a strong spontaneous reaction so that both reactions yield products. Notice that the ΔG for the coupled reaction is the sum of the constituent reactions; this is a consequence of Gibbs energy being a state function.
Ch14.12 Free Energy and Biological Systems
In biological systems, it is common to interpret some enzyme-catalyzed reactions as two coupled half-reactions, one spontaneous and the other non-spontaneous. Organisms often use the hydrolysis of ATP (adenosine triphosphate) to generate ADP (adenosine diphosphate) as the spontaneous coupling reaction (Figure 4).
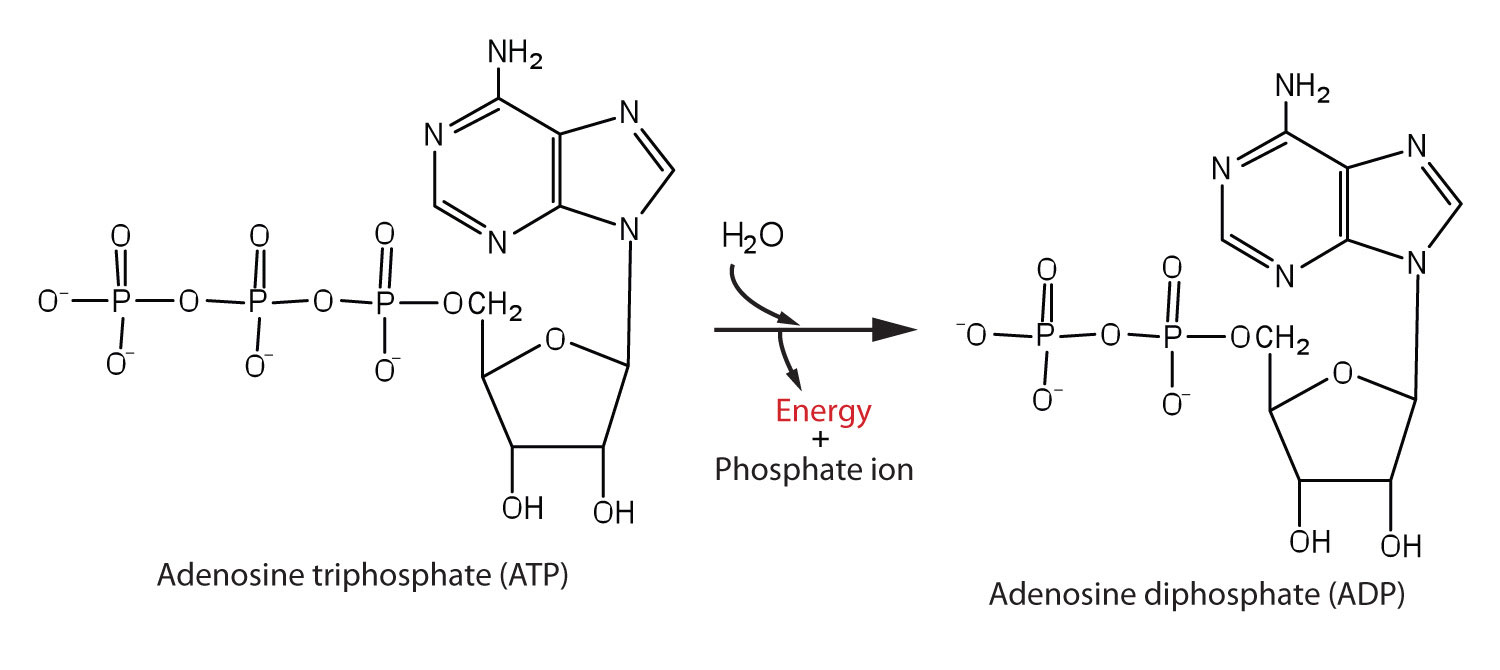
The phosphoanhydride bonds of ATP exhibit a large -ΔG of hydrolysis and are thus often termed “high energy” bonds. However, as with all bonds, energy is required to break these bonds. In this case, the thermodynamic Gibbs energy difference is strongly “energy releasing” when including the solvation thermodynamics of the phosphate ions, and the overall reaction ΔG is negative.
ATP is the major ‘energy’ molecule produced by metabolism, and it serves as a sort of ‘energy source’ in cells: ATP is dispatched to wherever a non-spontaneous reaction needs to occur so that the two reactions can be coupled to yield an overall reaction that would be thermodynamically favorable.
For example, ATP hydrolysis can be used to combine amino acids together to generate polypeptides (and proteins) as graphically illustrated by Figure 5.
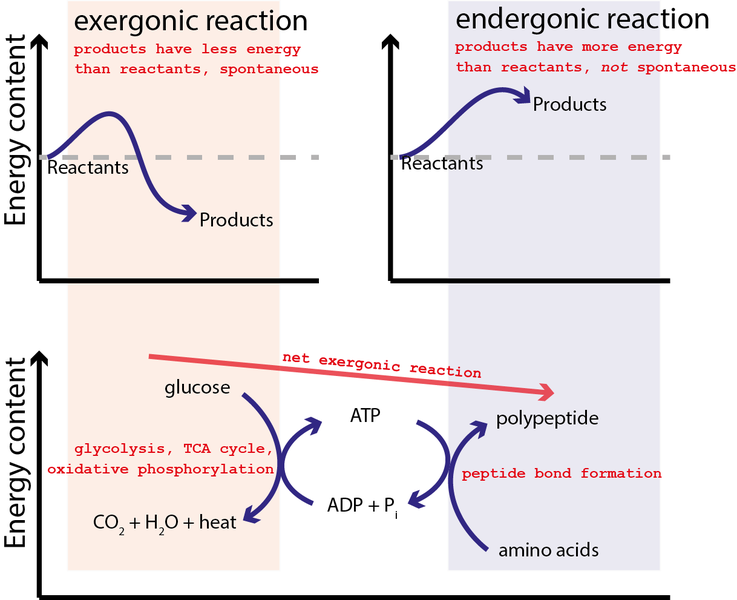
In this case, ATP formation reaction (reverse of the ATP hydrolysis reaction) is initially coupled to the reaction where glucose is oxidized by oxygen:
This reaction is strongly spontaneous with ΔG=−2880 kJ/mol or close to 100x greater energy capability than the hydrolysis of ATP. Hence, the equilibrium for this reaction so strongly favors the products that a single arrow is typically used in the chemical equation as it is essential irreversible. It may not be surprising that glucose and all sugars are very energetic molecules since they are the primary energy source for life.
Ch14.13 Kinetic Stability
A chemical reaction has kinetic and thermodynamic aspects. The quantity related to kinetics is the rate constant k, which is associated with the activation energy required for the reaction to proceed. Hence, kinetics is related to the reactivity of the reactants. The thermodynamic quantity is the energy difference resulting from the free energy (ΔG) given off during a chemical reaction—the stability of the products relative to the reactants.
Something that is unreactive will preferably stay in the form of reactants, which will require an input of energy to cause the reaction to go forward, converting reactants into products. A reactive species does not require an input of energy (or only minimal energy) to be converted from reactants to products, because its most stable and preferred state is that of the products.
Although kinetics describes the rates of reactions and how fast equilibrium is reached, it gives no information about conditions once the reaction equilibrates. In the same measure, thermodynamics only gives information regarding the equilibrium conditions of products after the reaction takes place, but does not explain the rate of reaction.
When discussing the concept of stability, it is necessary to distinguish between thermodynamic and kinetic stability.
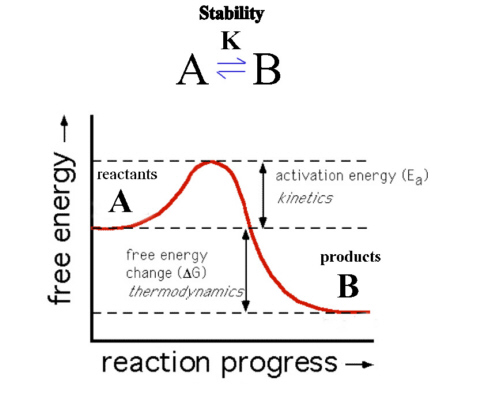
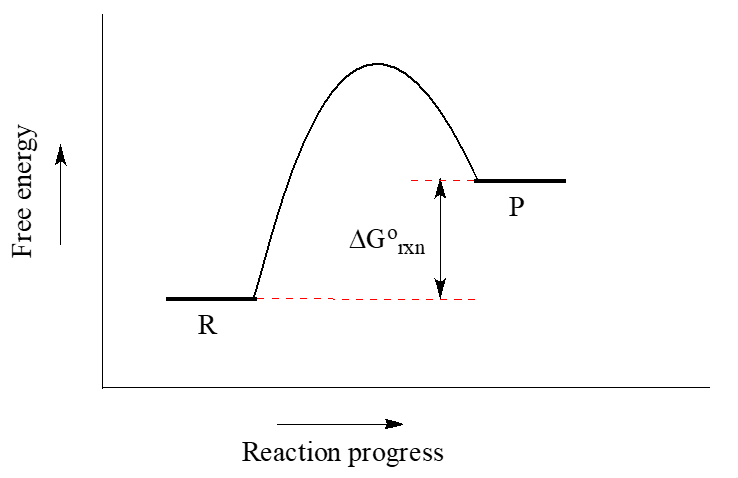
Consider Figure 6. Here product B is at lower energy than reactant A so that ΔG of the forward reaction is negative. The reaction should therefore favor the products and B is the more thermodynamically stable species.
The reaction as shown though has a barrier to the progress of the reaction (Ea) and so the reaction may proceed very slowly. The thermodynamics describes only the starting and ending position of the reaction and not the intermediate or transition state. If the kinetics is slow, reactant A would be described as being inert, i.e., kinetically stable, while if it proceeds quickly then A would be described as being labile.
For example, consider diamond and graphite, both composed of just carbon. In diamond we have the hardest known material. In graphite, we have one of the softest. This is all due simply to rearranging the way the atoms are bonded together. In diamond, each carbon is bonded to 4 others, in the rigid adamantane structure. In graphite each carbon is only bonded to 3 others in sheets of connected benzene rings. Because the sheets can slide over one another, graphite is slippery.
The relationship between diamond and graphite is a thermodynamic and kinetic one. At normal temperatures and pressures, graphite is more stable than diamond, and the fact that diamond exists at all is due to the very large activation barrier for conversion between the two. There is no easy mechanism for this conversion and so transforming diamond into graphite, or vice versa, requires almost as much energy as destroying the entire lattice and rebuilding it. Once diamond is formed, therefore, it cannot reconvert back to graphite because the barrier is too high. So diamond is said to be metastable, since it is kinetically stable, not thermodynamically stable. Diamond is created deep underground under conditions of extreme pressure and temperature. Under these conditions diamond is actually the more stable of the two forms of carbon, and so over a period of millions of years carbonaceous deposits slowly crystallise into single crystal diamond gemstones.
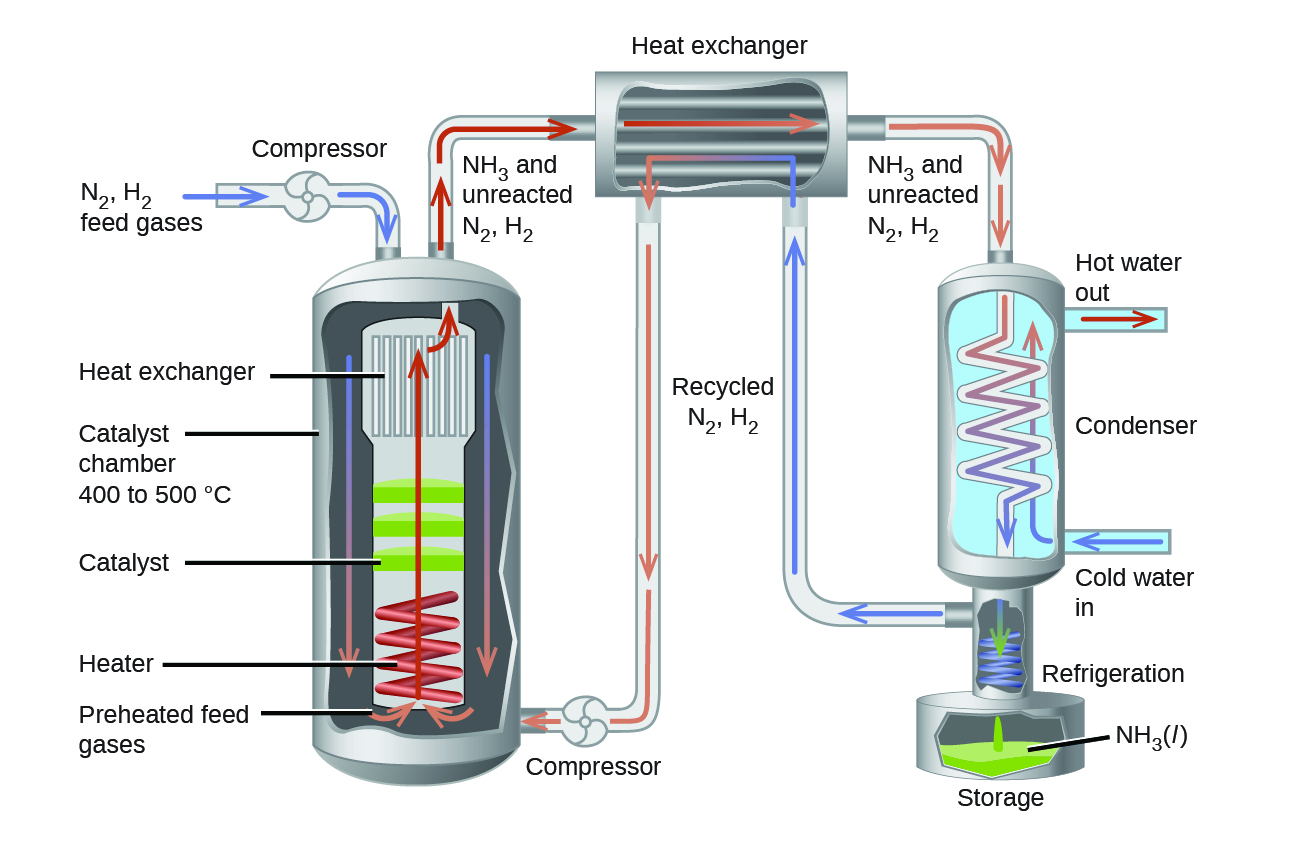
Ch14.14 Haber-Bosch Process
The interplay of various effects on a chemical equilibrium is illustrated in the industrial synthesis of ammonia from nitrogen and hydrogen:
A large quantity of ammonia is manufactured by this reaction. Each year, ammonia is among the top 10 chemicals, by mass, manufactured in the world. About 2 billion pounds are manufactured in the United States each year.
Ammonia plays a vital role in our global economy. It is used in the production of fertilizers and is, itself, an important fertilizer for the growth of corn, cotton, and other crops. Large quantities of ammonia are converted to nitric acid, which plays an important role in the production of fertilizers, explosives, plastics, dyes, and fibers, and is also used in the steel industry.
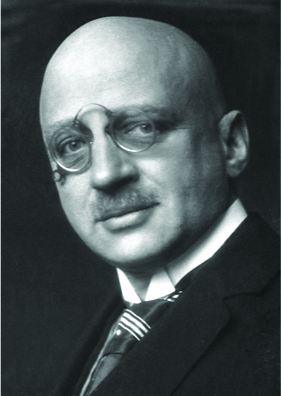
Fritz Haber
In the early 20th century, German chemist Fritz Haber (Figure 7) developed a practical process for converting diatomic nitrogen, which cannot be used by plants as a nutrient, to ammonia, a form of nitrogen that is easiest for plants to absorb.
The availability of nitrogen is a strong limiting factor to the growth of plants. Despite accounting for 78% of air, N2 is nutritionally unavailable due the tremendous stability of the nitrogen-nitrogen triple bond. For plants to use atmospheric nitrogen, the nitrogen must be converted to a more bioavailable form (this conversion is called nitrogen fixation).
Haber was born in Breslau, Prussia (presently Wroclaw, Poland) in December 1868. He went on to study chemistry and, while at the University of Karlsruhe, he developed what would later be known as the Haber process: the catalytic formation of ammonia from hydrogen and atmospheric nitrogen under high temperatures and pressures. For this work, Haber was awarded the 1918 Nobel Prize in Chemistry for synthesis of ammonia from its elements. The Haber process was a boon to agriculture, as it allowed the production of fertilizers to no longer be dependent on mined feed stocks such as sodium nitrate. Currently, the annual production of synthetic nitrogen fertilizers exceeds 100 million tons and synthetic fertilizer production has increased the number of humans that arable land can support from 1.9 persons per hectare in 1908 to 4.3 in 2008.
In addition to his work in ammonia production, Haber is also remembered by history as one of the fathers of chemical warfare. During World War I, he played a major role in the development of poisonous gases used for trench warfare. Regarding his role in these developments, Haber said, “During peace time a scientist belongs to the World, but during war time he belongs to his country.” Haber defended the use of gas warfare against accusations that it was inhumane, saying that death was death, by whatever means it was inflicted. He stands as an example of the ethical dilemmas that face scientists in times of war and the double-edged nature of the sword of science.
Like Haber, the products made from ammonia can be multifaceted. In addition to their value for agriculture, nitrogen compounds can also be used to achieve destructive ends. Ammonium nitrate has also been used in explosives, including improvised explosive devices. Ammonium nitrate was one of the components of the bomb used in the attack on the Alfred P. Murrah Federal Building in downtown Oklahoma City on April 19, 1995.
It has long been known that nitrogen and hydrogen react to form ammonia. However, it became possible to manufacture ammonia in useful quantities only in the early 20th century after the factors that influence its equilibrium were understood.
To be practical, an industrial process must give a large yield of product relatively quickly. One way to increase the yield of ammonia is to increase the pressure on the system in which N2, H2, and NH3 are at equilibrium or are coming to equilibrium.
The formation of additional amounts of ammonia reduces the total pressure exerted by the system and reduces the stress of the increased pressure.
Although increasing the pressure of a mixture of N2, H2, and NH3 will increase the yield of ammonia, at low temperatures, the rate of formation of ammonia is slow. At room temperature, for example, the reaction is so slow that if we prepared a mixture of N2 and H2, no detectable amount of ammonia would form during our lifetime. Furthermore, the formation of ammonia from hydrogen and nitrogen is an exothermic process:
Thus, increasing the temperature to increase the rate lowers the yield. If we lower the temperature to shift the equilibrium to favor the formation of more ammonia, equilibrium is reached slower because of the large decrease in reaction rate with decreasing temperature.
Part of the slower rate caused by operating at lower temperatures can be recovered by using a catalyst. The net effect of the catalyst on the reaction is to cause equilibrium to be reached more rapidly.
In the commercial production of ammonia, conditions of about 500 °C, 150–900 atm, and the presence of a catalyst are used to give the best compromise among rate, yield, and the cost of the equipment necessary to produce and contain high-pressure gases at high temperatures (Figure 8).