
Additional Reading Materials
Chapter 16: Buffers and Titrations
Ch16.1 Buffer Solutions
A mixture of a weak acid and its conjugate base (or a mixture of a weak base and its conjugate acid) is called a buffer solution, or a buffer. Buffer solutions resist a change in pH when small amounts of a strong acid or a strong base are added (Figure 1). A solution of acetic acid and sodium acetate (CH3COOH + CH3COONa) is an example of a buffer that consists of a weak acid and its conjugate base. An example of a buffer that consists of a weak base and its conjugate acid is a solution of ammonia and ammonium chloride (NH3(aq) + NH4Cl(aq)).
Ch16.2 How Buffers Work
A mixture of acetic acid and sodium acetate is acidic because the Ka of acetic acid is greater than the Kb of its conjugate base acetate. It is a buffer because it contains both the weak acid and its conjugate base, and it acts to keep the hydronium ion concentration (and the pH) almost constant when either a small amount of a strong acid or a strong base is added. If we add a base such as sodium hydroxide, the hydroxide ions react with the few hydronium ions present. Then more of the acetic acid reacts with water, restoring the hydronium ion concentration almost to its original value:
The pH changes very little. If we add an acid such as hydrochloric acid, most of the hydronium ions from the hydrochloric acid combine with acetate ions, forming acetic acid molecules:
Thus, there is very little increase in the concentration of the hydronium ion, and the pH remains practically unchanged (Figure 2).
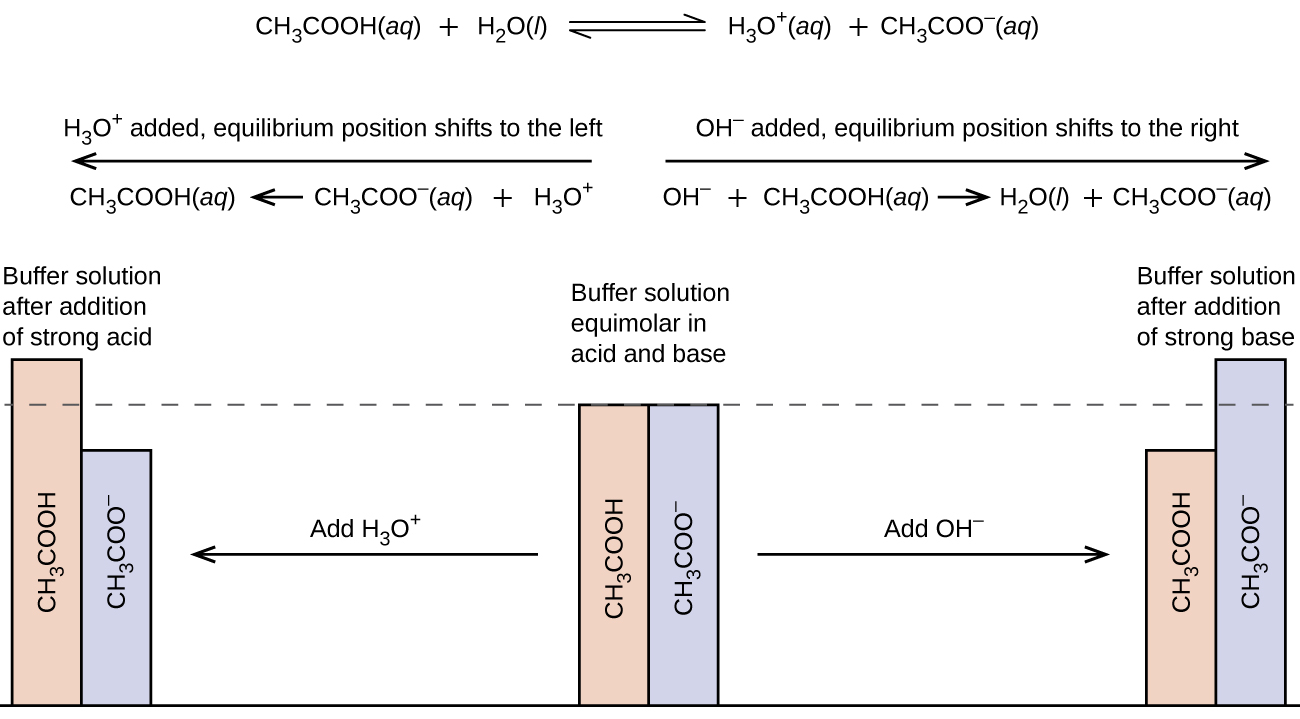
A mixture of ammonia and ammonium chloride is basic because the Kb of ammonia is greater than the Ka if the ammonium ion. If we add a base (hydroxide ions), ammonium ions in the buffer react with the hydroxide ions to form ammonia and water and reduce the hydroxide ion concentration almost to its original value:
If we add an acid (hydronium ions), ammonia molecules in the buffer mixture react with the hydronium ions to form ammonium ions and reduce the hydronium ion concentration almost to its original value:
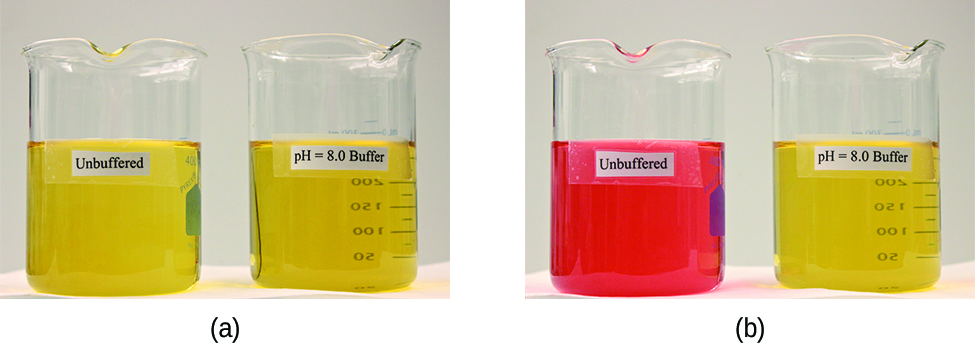
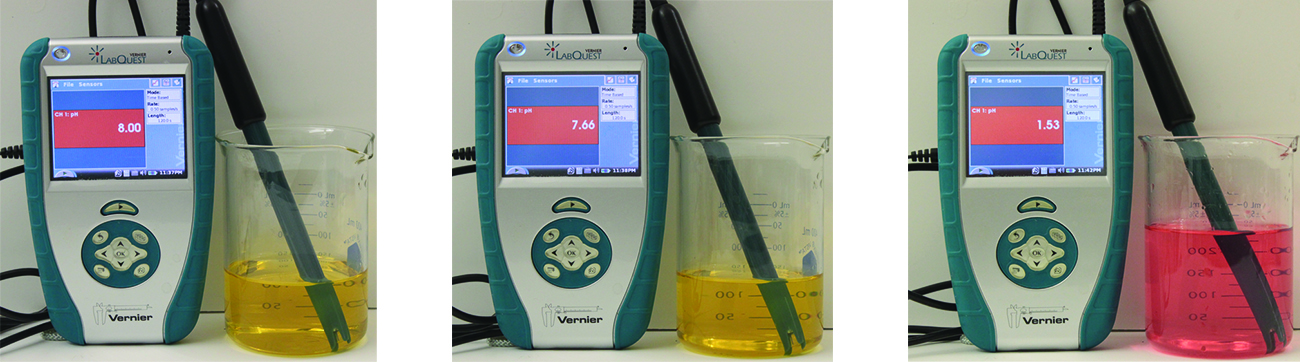
The three parts of the following example illustrate the change in pH that accompanies the addition of base to a buffered solution of a weak acid and to an unbuffered solution of a strong acid.
Example 1
pH Changes in Buffered and Unbuffered Solutions
Acetate buffers are used in biochemical studies of enzymes and other chemical components of cells to prevent pH changes that might change the biochemical activity of these compounds.
(a) Calculate the pH of an acetate buffer that is a mixture with 0.10 M acetic acid and 0.10 M sodium acetate. (CH3CO2H has Ka = 1.8 × 10⁻⁵)
(b) Calculate the pH after 1.0 mL of 0.10 M NaOH is added to 100 mL of this buffer, giving a solution with a volume of 101 mL.
(c) For comparison, calculate the pH after 1.0 mL of 0.10 M NaOH is added to 100 mL of a solution of an unbuffered solution with a pH of 4.74 (a 1.8 × 10⁻⁵–M solution of HCl). The volume of the final solution is 101 mL.
Solution
(a) To determine the pH of the buffer solution we use a typical equilibrium calculation:
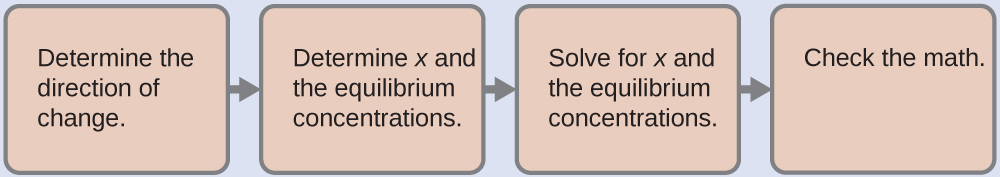
- Determine the direction of change. The equilibrium in a mixture of H3O+, CH3CO2–, and CH3CO2H is:
[latex]\text{CH}_3\text{CO}_2\text{H}(aq)\;+\;\text{H}_2\text{O}(l)\;{\rightleftharpoons}\;\text{H}_3\text{O}^{+}(aq)\;+\;\text{CH}_3\text{CO}_2^{\;\;-}(aq)[/latex]
The equilibrium constant for CH3CO2H is Ka = 1.8 × 10⁻⁵. With initial concentrations of [CH3CO2H] = [CH3CO2–] = 0.10 M and [H3O+] = ~0 M, the reaction shifts to the right to form H3O+.
- Determine x and equilibrium concentrations. A table of changes and concentrations is as follows:
![This table has two main columns and four rows. The first row for the first column does not have a heading and then has the following in the first column: Initial concentration ( M ), Change ( M ), Equilibrium ( M ). The second column has the header of “[ C H subscript 3 C O subscript 2 H ] [ H subscript 2 O ] equilibrium arrow H subscript 3 O superscript plus sign [ C H subscript 3 C O subscript 2 superscript negative sign ].” Under the second column is a subgroup of four columns and three rows. The first column has the following: 0.10, negative x, 0.10 minus sign x. The second column is blank. The third column has the following: approximately 0, x, x. The fourth column has the following: 0.10, x, 0.10 plus sign x.](https://wisc.pb.unizin.org/app/uploads/sites/126/2017/08/CNX_Chem_14_06_ICETable16_img.jpg)
- Solve for x and the equilibrium concentrations. We find:
[latex]x = 1.8\;\times\;10^{-5}\;M[/latex]
and
[latex][\text{H}_3\text{O}^{+}] = 0\;+\;x = 1.8\;\times\;10^{-5}\;M[/latex]Thus:
[latex]\text{pH} = -\text{log}[\text{H}_3\text{O}^{+}] = -\text{log}(1.8\;\times\;10^{-5}) = 4.74[/latex]
- Check the work. If we calculate all calculated equilibrium concentrations, we find that the equilibrium value of the reaction coefficient, Q = Ka.
(b) First, we calculate the concentrations of an intermediate mixture resulting from the complete reaction between the acid in the buffer and the added base. Then we determine the concentrations of the mixture at the new equilibrium:
![Eight tan rectangles are shown in four columns of two rectangles each that are connected with right pointing arrows. The first rectangle in the upper left is labeled “Volume of N a O H solution.” An arrow points right to a second rectangle labeled “Moles of N a O H added.” A second arrow points right to a third rectangle labeled “Additional moles of N a C H subscript 3 C O subscript 2.” Just beneath the first rectangle in the upper left is a rectangle labeled “Volume of buffer solution.” An arrow points right to another rectangle labeled “Initial moles of C H subscript 3 C O subscript 2 H.” This rectangle points to the same third rectangle, which is labeled “ Additional moles of N a C H subscript 3 C O subscript 2.” An arrow points right to a rectangle labeled “ Unreacted moles of C H subscript 3 C O subscript 2 H.” An arrow points from this rectangle to a rectangle below labeled “[ C H subscript 3 C O subscript 2 H ].” An arrow extends below the “Additional moles of N a C H subscript 3 C O subscript 2” rectangle to a rectangle labeled “[ C H subscript 3 C O subscript 2 ].” This rectangle points right to the rectangle labeled “[ C H subscript 3 C O subscript 2 H ].”](https://wisc.pb.unizin.org/app/uploads/sites/126/2017/08/CNX_Chem_14_06_steps2_img.jpg)
- Determine the moles of NaOH.
[latex]0.0010\;\rule[0.75ex]{0.7em}{0.1ex}\hspace{-0.7em}\text{L}\;\times\;(\frac{0.10\;\text{mol\;NaOH}}{1\;\rule[0.375ex]{0.5em}{0.1ex}\hspace{-0.5em}\text{L}}) = 1.0\;\times\;10^{-4}\;\text{mol\;NaOH}[/latex]
- Determine the moles of CH2CO2H. Before reaction, 0.100 L of the buffer solution contains:
[latex]0.100\;\rule[0.75ex]{0.7em}{0.1ex}\hspace{-0.7em}\text{L}\;\times\;(\frac{0.100\;\text{mol\;CH}_3\text{CO}_2\text{H}}{1\;\rule[0.375ex]{0.5em}{0.1ex}\hspace{-0.5em}\text{L}}) = 1.00\;\times\;10^{-2}\;\text{mol\;CH}_3\text{CO}_2\text{H}[/latex]
- Solve for the amount of NaCH3CO2 produced. The 1.0 × 10⁻⁴ mol of NaOH reacts with 1.0 × 10⁻² mol of CH3CO2H, leaving:
[latex](1.0\;\times\;10^{-2}\;mol)\;-\;(0.01\;\times\;10^{-2}\;mol) = 0.99\;\times\;10^{-2}\;\text{mol\;CH}_3\text{CO}_2\text{H}[/latex]
and producing 1.0 × 10⁻⁴ mol of NaCH3CO2.
This makes a total of:
[latex](1.0\;\times\;10^{-2}\;mol)\;+\;(0.01\;\times\;10^{-2}\;mol) = 1.01\;\times\;10^{-2}\;\text{mol\;NaCH}_3\text{CO}_2[/latex] - Find the molarity of the products. After reaction, CH3CO2H and NaCH3CO2 are contained in 101 mL of the intermediate solution, so:
[latex][\text{CH}_3\text{CO}_2\text{H}] = \frac{9.9\;\times\;10^{-3}\;\text{mol}}{0.101\;\text{L}} = 0.098\;M[/latex][latex][\text{NaCH}_3\text{CO}_2] = \frac{1.01\;\times\;10^{-2}\;\text{mol}}{0.101\;\text{L}} = 0.100\;M[/latex]
Now we calculate the pH after the intermediate solution, which has 0.098 M of CH3CO2H and 0.100 M of NaCH3CO2, comes to equilibrium. The calculation is very similar to that in part (a):

This series of calculations gives a pH = 4.75. Thus the addition of the base barely changes the pH of the solution.
(c) This 1.8 × 10⁻⁵–M solution of HCl has the same hydronium ion concentration as the 0.10-M solution of acetic acid-sodium acetate buffer described in part (a). The solution contains:
As shown in part (b), 1 mL of 0.10 M NaOH contains 1.0 × 10⁻⁴ mol of NaOH. When the NaOH and HCl solutions are mixed, the HCl is the limiting reagent in the reaction. All of the HCl reacts, and the amount of NaOH that remains is:
The concentration of NaOH is:
The pOH of this solution is:
The pH is:
The pH changes from 4.74 to 10.99 in this unbuffered solution. This compares to the change of 4.74 to 4.75 that occurred when the same amount of NaOH was added to the buffered solution described in part (b).
Check Your Learning
Show that adding 1.0 mL of 0.10 M HCl changes the pH of 100 mL of a 1.8 × 10⁻⁵M HCl solution from 4.74 to 3.00.
Answer:
Initial pH of 1.8 × 10⁻⁵M HCl; pH = −log[H3O+] = −log[1.8 × 10⁻⁵] = 4.74
Moles of H3O+ in 100 mL of 1.8 × 10⁻⁵M HCl: 1.8 × 10⁻⁵ moles/L × 0.100 L = 1.8 × 10⁻⁶ mol
Moles of H3O+ added by addition of 1.0 mL of 0.10 M HCl: 0.10 moles/L × 0.0010 L = 1.0 × 10⁻⁴ mol.
Final pH:
If we add an acid or a base to a buffer that is a mixture of a weak base and its conjugate acid, the calculations of the changes in pH are analogous.
Ch16.3 The Henderson-Hasselbalch Equation
The ionization-constant expression for a solution of a weak acid can be written as:
Rearranging to solve for [H3O+], we get:
Taking the negative logarithm of both sides of this equation, we arrive at:
which can be written as
This equation relates the pH, the Ka of a weak acid, and the concentrations of the weak acid and its conjugate base in a buffered solution. Scientists often use this expression, called the Henderson-Hasselbalch equation, to calculate the pH of buffer solutions.
It is important to note that the “x is small” approximation must be valid to use this equation, hence [conj base] and [conj acid] each should exceed the Ka by at least 100. Additionally, the Henderson-Hasselbalch equation applies to buffered solutions in which [latex]\frac{[conj base]}{[conj acid]}[/latex] ratio is between 0.1 and 10, which is the effective buffer range as discussed in the next section.
Lawrence Joseph Henderson and Karl Albert Hasselbalch
Lawrence Joseph Henderson (1878–1942) was an American physician, biochemist and physiologist, to name only a few of his many pursuits. He obtained a medical degree from Harvard and then spent 2 years studying in Strasbourg, then a part of Germany, before returning to take a lecturer position at Harvard. He eventually became a professor at Harvard and worked there his entire life. He discovered that the acid-base balance in human blood is regulated by a buffer system formed by the dissolved carbon dioxide in blood. He wrote an equation in 1908 to describe the carbonic acid-carbonate buffer system in blood. Henderson was broadly knowledgeable; in addition to his important research on the physiology of blood, he also wrote on the adaptations of organisms and their fit with their environments, on sociology and on university education. He also founded the Fatigue Laboratory, at the Harvard Business School, which examined human physiology with specific focus on work in industry, exercise, and nutrition.
In 1916, Karl Albert Hasselbalch (1874–1962), a Danish physician and chemist, shared authorship in a paper with Christian Bohr in 1904 that described the Bohr effect, which showed that the ability of hemoglobin in the blood to bind with oxygen was inversely related to the acidity of the blood and the concentration of carbon dioxide. The pH scale was introduced in 1909 by another Dane, Sørensen, and in 1912, Hasselbalch published measurements of the pH of blood. In 1916, Hasselbalch expressed Henderson’s equation in logarithmic terms, consistent with the logarithmic scale of pH, and thus the Henderson-Hasselbalch equation was born.
Ch16.4 Selection of Suitable Buffer Mixtures
There are two useful rules of thumb for selecting buffer mixtures:
- A good buffer mixture should have about equal concentrations of both of its components. A buffer solution has generally lost its usefulness when one component of the buffer pair is less than about 10% of the other. Figure 3 shows an acetic acid-acetate ion buffer as base is added. The initial pH is 4.74. A change of 1 pH unit occurs when the acetic acid concentration is reduced to 11% of the acetate ion concentration.
![A graph is shown with a horizontal axis labeled “Added m L of 0.10 M N a O H” which has markings and vertical gridlines every 10 units from 0 to 110. The vertical axis is labeled “p H” and is marked every 1 unit beginning at 0 extending to 11. A break is shown in the vertical axis between 0 and 4. A red curve is drawn on the graph which increases gradually from the point (0, 4.8) up to about (100, 7) after which the graph has a vertical section up to about (100, 11). The curve is labeled [ C H subscript 3 C O subscript 2 H ] is 11 percent of [ C H subscript 3 CO subscript 2 superscript negative].](https://wisc.pb.unizin.org/app/uploads/sites/126/2017/08/CNX_Chem_14_06_buffer.jpg)
Figure 3. The graph, an illustration of buffering action, shows change of pH as an increasing amount of a 0.10-M NaOH solution is added to 100 mL of a buffer solution in which, initially, [CH3CO2H] = [CH3CO2−] = 0.10 M. - Weak acids and their salts are better as buffers for pHs less than 7; weak bases and their salts are better as buffers for pHs greater than 7.
Blood is an important example of a buffered solution, with the principal acid and conjugate base responsible for the buffering action being carbonic acid, H2CO3, and the bicarbonate ion, HCO3–. When an excess of H3O+ enters the blood stream, it is removed primarily by the reaction:
When an excess of the OH– enters, it is removed by the reaction:
The pH of human blood thus remains very near 7.35, that is, slightly basic. Variations are usually less than 0.1 of a pH unit. A change of 0.4 of a pH unit is likely to be fatal.
Medicine: The Buffer System in Blood
The normal pH of human blood is about 7.4. The carbonate buffer system in the blood uses the following equilibrium reaction:
The concentration of carbonic acid, H2CO3 is approximately 0.0012 M, and the concentration of the hydrogen carbonate ion, HCO3–, is around 0.024 M. Using the Henderson-Hasselbalch equation and the pKa of carbonic acid at body temperature, we can calculate the pH of blood:
The fact that the H2CO3 concentration is significantly lower than that of the HCO3– ion may seem unusual, but this imbalance is due to the fact that most of the by-products of our metabolism that enter our bloodstream are acidic. Therefore, there must be a larger proportion of base than acid, so that the capacity of the buffer will not be exceeded.
Lactic acid is produced in our muscles when we exercise. As the lactic acid enters the bloodstream, it is neutralized by the HCO3– ion, producing H2CO3. An enzyme then accelerates the breakdown of the excess carbonic acid to carbon dioxide and water, which can be eliminated by breathing. In fact, in addition to the regulating effects of the carbonate buffering system on the pH of blood, the body uses breathing to regulate blood pH. If the pH of the blood decreases too far, an increase in breathing removes CO2 from the blood through the lungs driving the equilibrium reaction such that [H3O+] is lowered. If the blood is too alkaline, a lower breath rate increases CO2 concentration in the blood, driving the equilibrium reaction the other way, increasing [H3O+] and restoring an appropriate pH.
View information on the buffer system encountered in natural waters.
Ch16.5 Buffer Capacity
Buffer solutions do not have an unlimited capacity to keep the pH relatively constant (Figure 4). If we add so much base to a buffer that the weak acid is exhausted, no more buffering action toward the base is possible. On the other hand, if we add an excess of acid, the weak base would be exhausted, and no more buffering action toward any additional acid would be possible. In fact, we do not even need to exhaust all of the acid or base in a buffer to overwhelm it; its buffering action will diminish rapidly as a given component nears depletion.
The buffer capacity is the amount of acid or base that can be added to a given volume of a buffer solution before the pH changes significantly, usually by one unit. Buffer capacity depends on the amounts of the weak acid and its conjugate base that are in a buffer mixture. For example, 1 L of a solution that is 1.0 M in acetic acid and 1.0 M in sodium acetate has a greater buffer capacity than 1 L of a solution that is 0.10 M in acetic acid and 0.10 M in sodium acetate even though both solutions have the same pH. The first solution has more buffer capacity because it contains more acetic acid and acetate ion.
Ch16.6 Titration
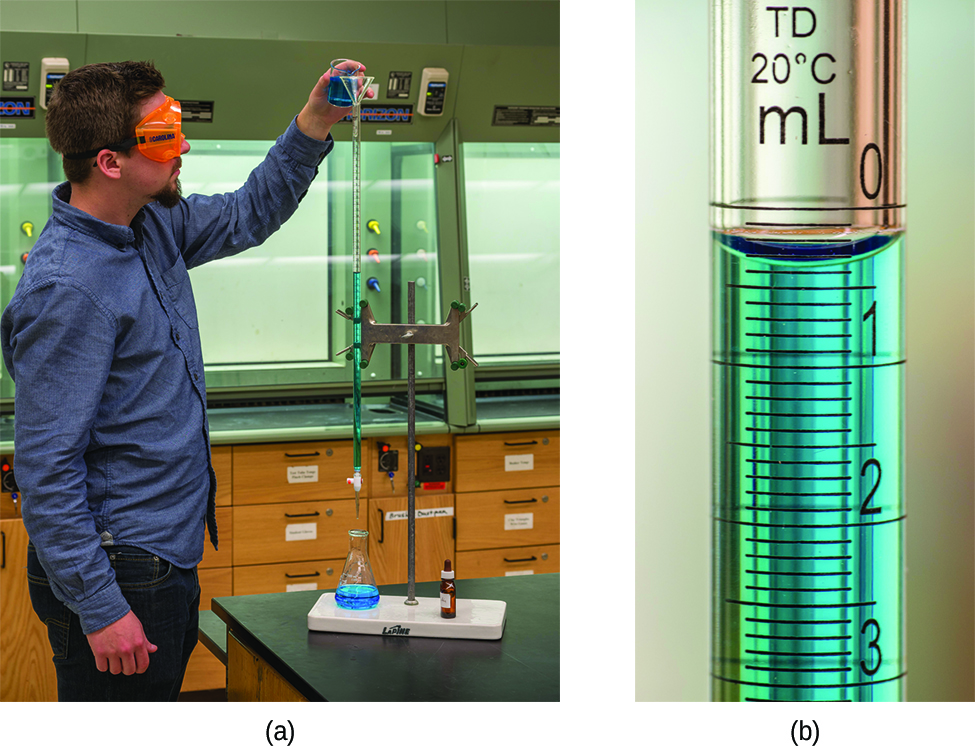
A typical titration analysis involves the use of a buret (Figure 5) to make incremental additions of a solution containing a known concentration of some substance (the titrant) to a sample solution containing the substance whose concentration is to be measured (the analyte). The titrant and analyte undergo a chemical reaction of known stoichiometry, and so measuring the volume of titrant solution required for complete reaction with the analyte (the equivalence point of the titration) allows calculation of the analyte concentration. The equivalence point of a titration may be detected visually if a distinct change in the appearance of the sample solution accompanies the completion of the reaction. More commonly, special dyes called indicators are added to the sample solutions to impart a change in color at or very near the equivalence point of the titration. Equivalence points may also be detected by measuring some solution property that changes in a predictable way during the course of the titration. Regardless of the approach taken to detect a titration’s equivalence point, the volume of titrant actually measured is called the end point. Properly designed titration methods typically ensure that the difference between the equivalence and end points is negligible. Though any type of chemical reaction may serve as the basis for a titration analysis, precipitation, acid-base, and redox are most common.
Example 2
Titration Analysis
The end point in a titration of a 50.00-mL sample of aqueous HCl was reached by addition of 35.23 mL of 0.250 M NaOH titrant. The titration reaction is:
[latex]\text{HCl}(aq) + \text{NaOH}(aq) \longrightarrow \text{NaCl}(aq) + \text{H}_2\text{O}(l)[/latex]
What is the molarity of the HCl?
Solution
As for all reaction stoichiometry calculations, the key issue is the relation between the molar amounts of the chemical species of interest as depicted in the balanced chemical equation.
For this exercise, the calculation will follow the following outlined steps:
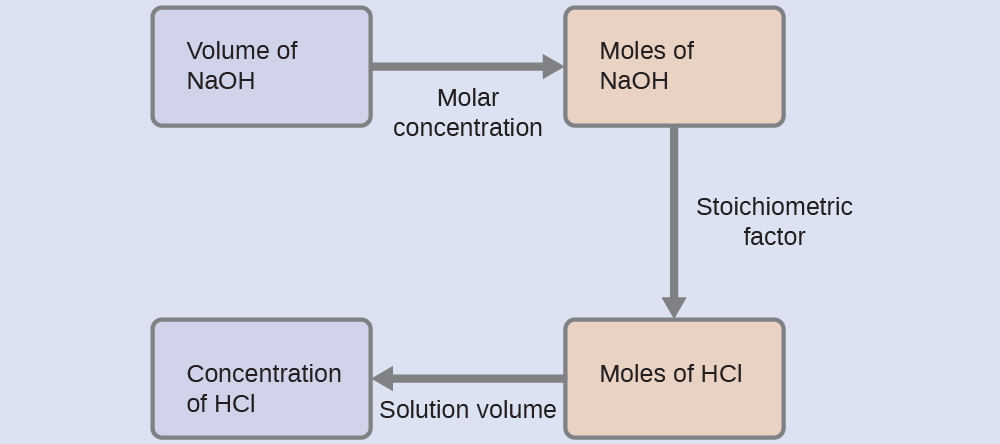
The molar amount of HCl is calculated to be:
Using the provided volume of HCl solution, the HCl concentration is:
Check Your Learning
A 20.00-mL sample of aqueous oxalic acid, H2C2O4, was titrated with a 0.09113-M solution of potassium permanganate, KMnO4.
A volume of 23.24 mL was required to reach the end point. What is the oxalic acid molarity?
Answer:
0.2648 M
Ch16.7 Titration Curve
Titrations can be used to quantitatively analyze solutions for their acid or base concentrations. Here, we will explore the changes in the concentrations of the acidic and basic species present in a solution during the process of a titration.
Example 3
Calculating pH for Titration Solutions: Strong Acid/Strong Base
A titration is carried out for 25.00 mL of 0.100 M HCl (strong acid) with 0.100 M of a strong base NaOH the titration curve is shown in Figure 6. Calculate the pH at these volumes of added base solution:
(a) 0.00 mL
(b) 12.50 mL
(c) 25.00 mL
(d) 37.50 mL
Solution
Since HCl is a strong acid, we can assume that all of it dissociates. The initial concentration of H3O+ is 0.100 M. When the base solution is added, it also dissociates completely, providing OH− ions. The H3O+ and OH− ions neutralize each other, so only those of the two that were in excess remain, and their concentration determines the pH. Thus, the solution is initially acidic (pH < 7), but eventually all the hydronium ions are neutralized, and the solution becomes neutral. As more base is added further, the solution turns basic.
The total initial amount of the hydronium ions is:
Once X mL of the 0.100-M base solution is added, the number of moles of the OH− ions introduced is:
The total volume becomes:
The number of moles of H3O+ becomes:
The concentration of H3O+ is:
The preceding calculations work if [latex]\text{n}(\text{H}_3\text{O}^{+})_0\;-\;\text{n(OH}^{-})_0\;{\textgreater}\;0[/latex]. When [latex]\text{n}(\text{H}_3\text{O}^{+})_0 = \text{n(OH}^{-})_0[/latex], the H3O+ ions from the acid and the OH− ions from the base mutually neutralize. At this point, the only hydronium ions left are those from the autoionization of water. Therefore, in this case:
Finally, when [latex]\text{n(OH}^{-})_0\;{\textgreater}\;\text{n}(\text{H}_3\text{O}^{+})_0[/latex], we calculate: [latex]\text{n(OH}^{-}) = \text{n(OH}^{-})_0\;-\;\text{n}(\text{H}_3\text{O}^{+})_0[/latex]
In this case:
Let us now consider the four specific cases presented in this problem:
(a) X = 0 mL
pH = −log(0.100) = 1.000
(b) X = 12.50 mL
pH = −log(0.0333) = 1.477
(c) X = 25.00 mL
Since [latex]\text{n}(\text{H}_3\text{O}^{+})_0 = \text{n(OH}^{-})_0[/latex], pH = 7.000, as described earlier.
(d) X = 37.50 mL
pH = 14 − pOH = 14 + log([OH−]) = 14 + log(0.0200) = 12.30
Check Your Learning
Calculate the pH for the strong acid/strong base titration between 50.0 mL of 0.100 M HNO3(aq) and 0.200 M NaOH (titrant) at the listed volumes of added base: 0.00 mL, 15.0 mL, 25.0 mL, and 40.0 mL.
Answer:
0.00 mL: 1.000; 15.0 mL: 1.5111; 25.0 mL: 7.000; 40.0 mL: 12.523
In the above example, we calculated pH at four points during a titration. Table 1 shows a detailed sequence of changes in the pH of a strong acid and a weak acid in a titration with NaOH.
| Volume of 0.100 M NaOH Added (mL) | Moles of NaOH Added | pH Values 0.100 M HCl | pH Values 0.100 M CH3CO2H |
|---|---|---|---|
| 0.0 | 0.0 | 1.00 | 2.87 |
| 5.0 | 0.00050 | 1.18 | 4.14 |
| 10.0 | 0.00100 | 1.37 | 4.57 |
| 15.0 | 0.00150 | 1.60 | 4.92 |
| 20.0 | 0.00200 | 1.95 | 5.35 |
| 22.0 | 0.00220 | 2.20 | 5.61 |
| 24.0 | 0.00240 | 2.69 | 6.13 |
| 24.5 | 0.00245 | 3.00 | 6.44 |
| 24.9 | 0.00249 | 3.70 | 7.14 |
| 25.0 | 0.00250 | 7.00 | 8.72 |
| 25.1 | 0.00251 | 10.30 | 10.30 |
| 25.5 | 0.00255 | 11.00 | 11.00 |
| 26.0 | 0.00260 | 11.29 | 11.29 |
| 28.0 | 0.00280 | 11.75 | 11.75 |
| 30.0 | 0.00300 | 11.96 | 11.96 |
| 35.0 | 0.00350 | 12.22 | 12.22 |
| 40.0 | 0.00400 | 12.36 | 12.36 |
| 45.0 | 0.00450 | 12.46 | 12.46 |
| 50.0 | 0.00500 | 12.52 | 12.52 |
| Table 1. pH Values in the Titrations of a Strong Acid with a Strong Base and of a Weak Acid with a Strong Base. In each case, the titration involves 25.00 mL of 0.100 M acid with 0.100 M NaOH. | |||
The simplest acid-base reactions are those of a strong acid with a strong base. Table 1 shows data for the titration of a 25.0-mL sample of 0.100 M hydrochloric acid with 0.100 M sodium hydroxide. The values of the pH measured after successive additions of NaOH are also graphed in Figure 6, in a form that is called a titration curve. The pH increases slowly at first, increases rapidly in the middle portion of the curve, and then increases slowly again. The point of inflection (located at the midpoint of the vertical part of the curve) is the equivalence point for the titration. It indicates when equivalent quantities of acid and base are present. For the titration of a strong acid with a strong base, the equivalence point occurs at a pH of 7.00 and the points on the titration curve can be calculated using solution stoichiometry.
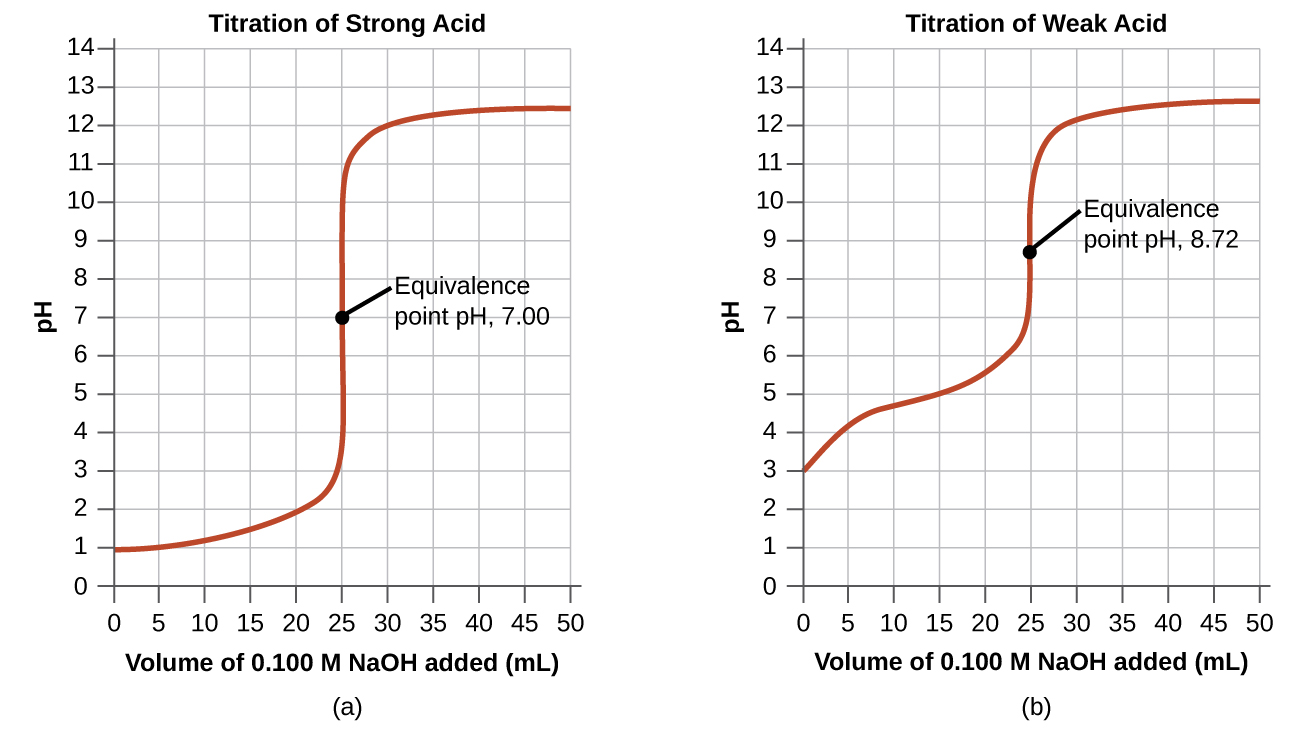
The titration of a weak acid with a strong base (or of a weak base with a strong acid) is somewhat more complicated than that just discussed, but it follows the same general principles. Let us consider the titration of 25.0 mL of 0.100 M acetic acid (a weak acid) with 0.100 M sodium hydroxide and compare the titration curve with that of the strong acid. Table 1 gives the pH values during the titration, Figure 6 shows the titration curve.
Although the initial volume and molarity of the acids are the same, there are important differences between the two titration curves. The pH for the weak acid begins at a higher value (less acidic) and maintains higher pH values up to the equivalence point. This is because acetic acid is a weak acid, which is only partially ionized. The pH at the equivalence point is also higher (8.72 rather than 7.00) due to the presence of acetate, a weak base that raises the pH:
After the equivalence point, the two curves are identical because the pH is dependent on the excess of hydroxide ion in both cases.
Example 4
Titration of a Weak Acid with a Strong Base
The titration curve shown in Figure 6 is for the titration of 25.00 mL of 0.100 M CH3CO2H with 0.100 M NaOH. The reaction can be represented as:
(a) What is the initial pH before any amount of the NaOH solution has been added? Ka = 1.8 × 10⁻⁵ for CH3CO2H.
(b) Find the pH after 25.00 mL of the NaOH solution have been added.
(c) Find the pH after 12.50 mL of the NaOH solution has been added.
(d) Find the pH after 37.50 mL of the NaOH solution has been added.
Solution
(a) Assuming that the dissociated amount is small compared to 0.100 M, we find that:
(b) After 25.00 mL of NaOH are added, the number of moles of NaOH and CH3CO2H are equal. All of the CH3CO2H has been converted to CH3CO2–. The concentration of CH3CO2– is:
The equilibrium now is the basicity equilibrium for CH3CO2–:
we can determine Kb by the Ka of its conjugate acid:
Let us denote the concentration of each of the products of this reaction, CH3CO2H and OH−, as x. Using the assumption that x is small compared to 0.0500 M:
Note that the pH at the equivalence point of this titration is significantly greater than 7.
(c) In this case, only 12.50 mL of the base solution has been introduced, and so only half of all the CH3CO2H is converted into CH3CO2–. The total initial number of moles of CH3CO2H is 0.02500 L × 0.100 M = 0.00250 mol, and after adding the NaOH, the numbers of moles of CH3CO2H and CH3CO2– are both approximately equal to 0.00250 mol – 0.001250 mol = 0.001250 mol.
Since the amount of the added base is smaller than the original amount of the acid, the equivalence point has not been reached, the solution is essentially a buffer, and we can use the Henderson-Hasselbalch equation:
(as the concentrations of CH3CO2– and CH3CO2H are the same)
Hence, pH = pKa at the halfway point in a titration of a weak acid.
(d) After 37.50 mL of NaOH is added, the amount of NaOH is 0.03750 L × 0.100 M = 0.003750 mol. Since this is past the equivalence point, the excess hydroxide ions will make the solution basic, and we can again use stoichiometric calculations to determine the pH:
So:
Note that this result is the same as for the strong acid-strong base titration example provided, since the amount of the strong base added moves the solution past the equivalence point.
Check Your Learning
Calculate the pH for the weak acid/strong base titration between 50.0 mL of 0.100 M HCOOH(aq) (formic acid) and 0.200 M NaOH (titrant) at the listed volumes of added base: 0.00 mL, 15.0 mL, 25.0 mL, and 30.0 mL.
Answer:
0.00 mL: 2.37; 15.0 mL: 3.92; 25.00 mL: 8.29; 30.0 mL: 12.097
Ch16.8 Acid-Base Indicators
Certain organic substances change color in dilute solution when the hydronium ion concentration reaches a particular value. For example, phenolphthalein is a colorless substance in any aqueous solution with [H3O+] > 5.0 × 10⁻⁹M (pH < 8.3). In more basic solutions (pH > 8.3), it is red or pink. Substances such as phenolphthalein, which can be used to determine the pH of a solution, are called acid-base indicators. Acid-base indicators are either weak organic acids or weak organic bases.
The equilibrium in a solution of the acid-base indicator methyl orange, a weak acid, can be represented by an equation in which we use HIn as a simple representation for the complex methyl orange molecule:
The anion of methyl orange, In−, is yellow, and the nonionized form, HIn, is red. When we add acid to a solution of methyl orange, the increased hydronium ion concentration shifts the equilibrium toward the nonionized red form, in accordance with Le Châtelier’s principle. If we add base, we shift the equilibrium towards the yellow form. This behavior is analogous to the action of buffers.
An indicator’s color is the visible result of the ratio of the concentrations of the two species In− and HIn. If most of the indicator (typically about 60−90% or more) is present as In−, then we see the color of the In− ion, which would be yellow for methyl orange. If most is present as HIn, then we see the color of the HIn molecule: red for methyl orange. For methyl orange, we can rearrange the equation for Ka and write:
This shows us how the ratio of [latex]\frac{[\text{In}^{-}]}{[\text{HIn}]}[/latex] varies with the concentration of hydronium ion, and can be rearranged:
The last formula is the same as the Henderson-Hasselbalch equation, which can be used to describe the equilibrium of indicators.
When [H3O+] has the same numerical value as Ka, the ratio of [In−] to [HIn] is equal to 1, meaning that 50% of the indicator is present in the red form (HIn) and 50% is in the yellow ionic form (In−), and the solution appears orange in color. When the hydronium ion concentration increases to 8 × 10⁻⁴M (a pH of 3.1), the solution turns red. No change in color is visible for any further increase in the hydronium ion concentration (decrease in pH). At a hydronium ion concentration of 4 × 10⁻⁵M (a pH of 4.4), most of the indicator is in the yellow ionic form, and a further decrease in the hydronium ion concentration (increase in pH) does not produce a visible color change. The pH range between 3.1 (red) and 4.4 (yellow) is the color-change interval of methyl orange; the pronounced color change takes place between these pH values.
There are many different acid-base indicators that cover a wide range of pH values and can be used to determine the approximate pH of an unknown solution by a process of elimination. Universal indicators and pH paper contain a mixture of indicators and exhibit different colors at different pHs. Figure 7 presents several indicators, their colors, and their color-change intervals.
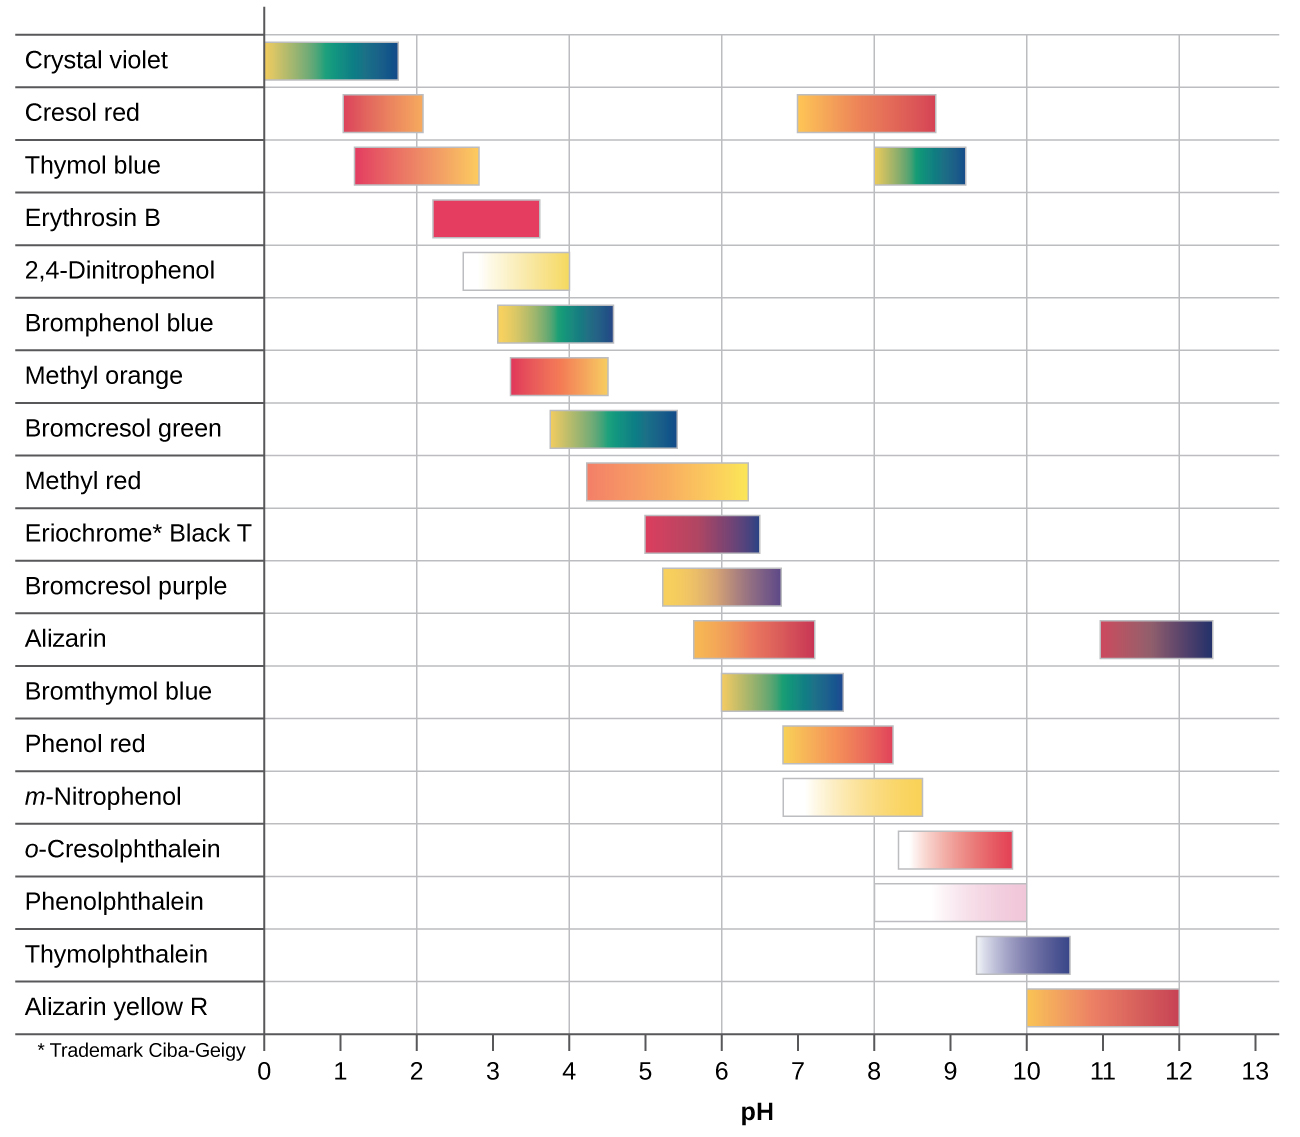
Titration curves help us pick an indicator that will provide a sharp color change at the equivalence point. The best selection would be an indicator that has a color change interval that brackets the pH at the equivalence point of the titration.
The color change intervals of three indicators are shown in Figure 8. The equivalence points of both the titration of HCl and of CH3CO2H are located in the color-change interval of phenolphthalein. We can use it for titrations of either acid with strong base.
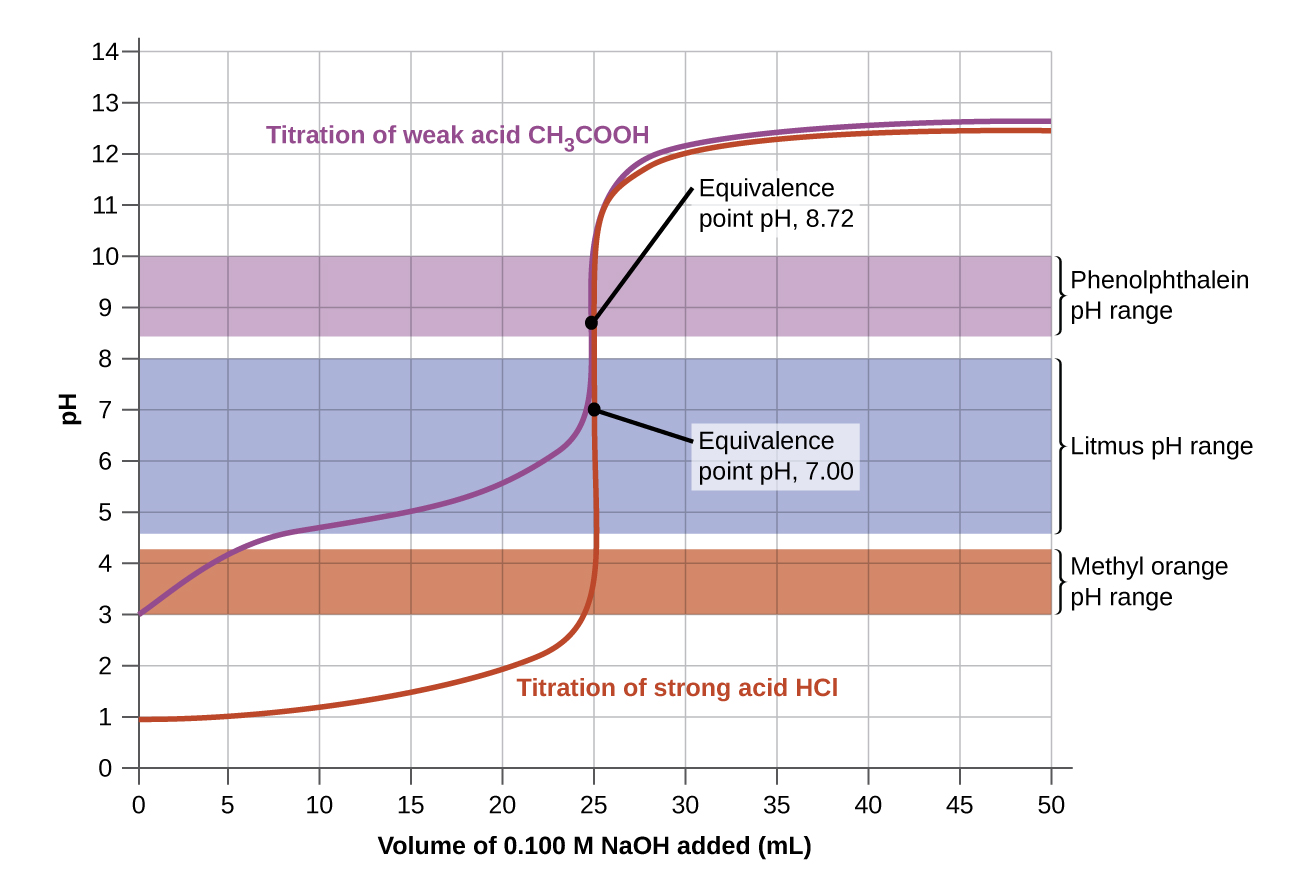
Litmus is a suitable indicator for the HCl titration because its color change brackets the equivalence point. However, we should not use litmus for the CH3CO2H titration because the pH is within the color-change interval of litmus when only about 12 mL of NaOH has been added, and it does not leave the range until 25 mL has been added. The color change would be very gradual, taking place during the addition of 13 mL of NaOH, making litmus useless as an indicator of the equivalence point.
We could use methyl orange for the HCl titration, but it would not give very accurate results: (1) It completes its color change slightly before the equivalence point is reached (but very close to it, so this is not too serious); (2) it changes color, as Figure 8 shows, during the addition of nearly 0.5 mL of NaOH, which is not so sharp a color change as that of litmus or phenolphthalein; and (3) it goes from yellow to orange to red, making detection of a precise endpoint much more challenging than the colorless to pink change of phenolphthalein. Figure 8 shows us that methyl orange would be completely useless as an indicator for the CH3CO2H titration. Its color change begins after about 1 mL of NaOH has been added and ends when about 8 mL has been added. The color change is completed long before the equivalence point is reached and hence provides no indication of the equivalence point.
We base our choice of indicator on a calculated pH, the pH at the equivalence point. At the equivalence point, equimolar amounts of acid and base have been mixed, and the calculation becomes that of the pH of a solution of the salt resulting from the titration.
Ch16.9 Titration of Polyprotic Acids and Bases
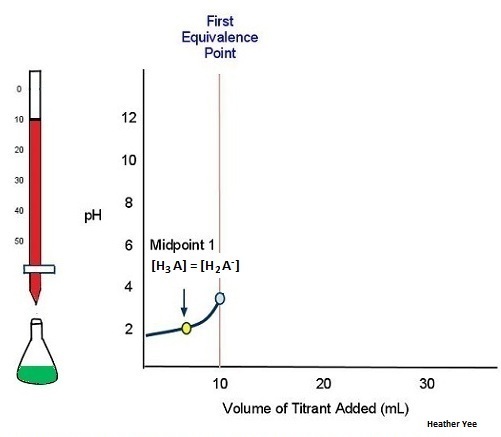
When a monoprotic acid is titrated, there is an equivalence, or stoichiometric, point, which is when the moles of the monoprotic strong base added equal of the moles of weak acid present. However, when a weak polyprotic acid is titrated, there are multiple equivalence points because the equivalence point will occur when an H+ is dissociated. Therefore, the number of equivalence points depends on the number of H+ atoms that can be removed from the molecule.
The midpoint in a titration curve is when the number of moles of strong base added equals half of the moles of the weak acid that are present. For this reason, the midpoint is half of the equivalence point. Moreover, there are as many midpoints as there are equivalence points. At the midpoint, pH equals the value of pKa because there is 50:50 mixture of the weak acid and the strong base. To quantify this, the Henderson-Hasselbalch equation can be used:
Since the solution is a 50:50 mixture, [A–] = [HA]. Therefore:
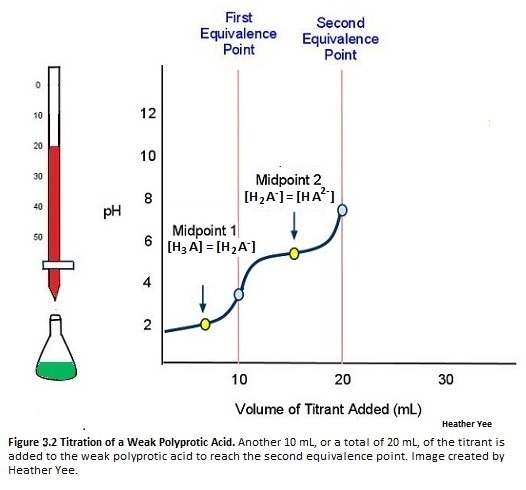
When a strong monoprotic base is added to a solution of a polyprotic acid, the neutralization reaction occurs in stages. The most acidic group is titrated first, followed by the next most acidic, and so forth. If the pKa values are separated by at least three pKa units, then the overall titration curve shows well-resolved “steps” corresponding to the titration of each proton.
As an example, consider the tiration of a generic weak polyprotic acid H3A (e.g. H3PO4) with a strong monoprotic base (e.g. NaOH). Since there are 3 acidic protons in H3A, there is expected to be three equivalence points. Illustrated in Figure 9 is when sufficient titrant has been added to the weak polyprotic acid to reach the first equivalence point:
As more titrant is added to the weak polyprotic acid solution, another H+ dissociates. The titration curve crosses another midpoint and reaches the second equivalence point (Figure 10):
The titration is finally complete when all three equivalence points have been reached (Figure 11).
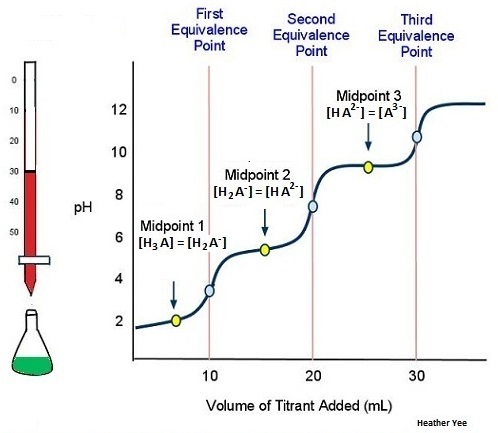
An actual titration of the triprotic acid H3PO4 with NaOH is illustrated in Figure 12 and shows two well-defined steps: the first midpoint corresponds to pKa1, and the second midpoint corresponds to pKa2. Because HPO42− is such a weak acid, pKa3 has such a high value that the third step cannot be resolved using 0.100 M NaOH as the titrant.

The titration curve for the reaction of a polyprotic base with a strong acid is the mirror image of the curve shown in Figures 9-12. The initial pH is high, but as acid is added, the pH decreases in steps if the successive pKb values are well separated.
