
Unit One
Day 2: Quantum Theory
If you have not yet worked through the Introduction, please do so before beginning this section. As you work through this section, if you find that you need a bit more background material to help you understand the topics at hand, you can consult “Chemistry: The Molecular Science” (5th ed. Moore and Stanitski) Sections 5-2a and 5-3, and/or Chapter 1.3-1.5 and Chapter 2.1 in the Additional Reading Materials section.
D2.1 The Photoelectric Effect
Activity 1: Preparation—Photoelectric Effect
Planck’s quantum theory was able to predict accurately the distribution of wavelengths emitted by a blackbody at various temperatures. However, Planck found it difficult to justify his assumption that vibration energies had to be multiples of a minimum energy—a quantum. When Albert Einstein used Planck’s quantum hypothesis to explain a different phenomenon, the photoelectric effect, the validity of quantum theory became clearer.
Exercise 1: Quanta and Laser Light (Review)
Before doing any calculation or looking at the hint, write in your class notebook an explanation of how you plan to work out the problem. Do all the steps in the calculation in your notebook. Once you have arrived at an answer, then submit your results below and click the “Check” button to see if it is correct. If one or more parts of your answer is incorrect, go over your work in your notebook carefully and check for errors. “Retry” with your new answer. Look at the hint (click on it to expand for view) only after you have attempted to answer the question at least twice.
Determine how many quanta of radiation are emitted by a 5.0 mW red (λ = 632.8 nm) laser pointer each second. It is useful to know that 1 W = 1 J s-1.
Number of quanta per second = [Number] × 10[exponent] s-1
When electromagnetic radiation shines on a metal, such as sodium, electrons can be emitted and an electric current (a flow of electrons) can occur. This is called the photoelectric effect. The effect is complicated: for some wavelengths no electrons are emitted, but at other wavelengths electrons are emitted.
Exercise 2: Photoelectric Effect Simulation
Watch this photoelectric effect animation, where sodium is already selected, to answer the questions below. Write down your observations as you watch the animation, and then answer the questions in your course notebook.
- For which colors of visible light are electrons emitted by sodium? Determine the maximum wavelength at which electrons are emitted.
- At a wavelength where electrons are emitted, describe the shape of a graph of number of electrons emitted vs. light intensity.
- Determine the shape of a graph of electron energy vs. light frequency. How does this graph differ from the electrons vs. intensity graph?
- Based on your observations, draw a rough graph with labeled axes to show how the number of electrons emitted varies with wavelength of light. How would the graph change if the intensity of light increased?
If you would like to experiment with the simulation further, download and save the simulation program, go to the location where you saved it, and double-click on the file name (photoelectric_en.jar) to install and run it. You need to have Java installed for this to work.
Additional Practice
- Assume that the intensity of light corresponds with the amplitude of light waves and try to explain the observations you made using the simulation.
- Above a maximum wavelength no electrons are emitted
- Electron current increases with light intensity
- Above a threshold frequency electron energy increases with frequency of light
- Assume that light comes in quanta and the energy of a quantum of light is [latex]h\nu[/latex] (or [latex]\dfrac{hc}{\lambda}[/latex]). Does this idea enable all three observations to be explained? Write an explanation in your own words.
- Use this quantum assumption (number 2) to calculate the minimum energy required to cause an electron to be emitted from the surface of a sample of sodium.
- Suggest additional experiments you can do using the simulation to help confirm your response to question 2. Do those experiments and report the results.
Activity 2: Summary of Photoelectric Effect Results
In your course notebook, write a brief summary of the results you obtained from experimenting with the photoelectric effect simulation. Also write a summary of how your experimental results can be interpreted based on the idea that light consists of quanta. Compare what you wrote with the summary below [also available at this link] and, if necessary, revise what you wrote.
Exercise 3: Photoelectric Effect
Based on Einstein’s explanation of the photoelectric effect, decide whether each statement below is true or false. If a statement is true, but only under certain conditions, write down the conditions required to make it true. If a statement is false, rewrite the statement to make it true.
Additional Practice
It takes 5.86 × 10⁻¹⁹ J to free one electron from the surface of magnesium metal. Can the diode from a Blu-Ray player (405 nm light) generate a photoelectric effect from magnesium?
Activity 3: Wrap-up—Photoelectric Effect
D2.2 Line Spectra
Activity 4: Preparation—Atomic Spectra and Bohr Theory
When solids, liquids, or high-pressure gases are heated sufficiently, they radiate light, producing a continuous spectrum in which there is significant intensity across a broad range of wavelengths. These continuous spectra can often be approximated by blackbody radiation curves.
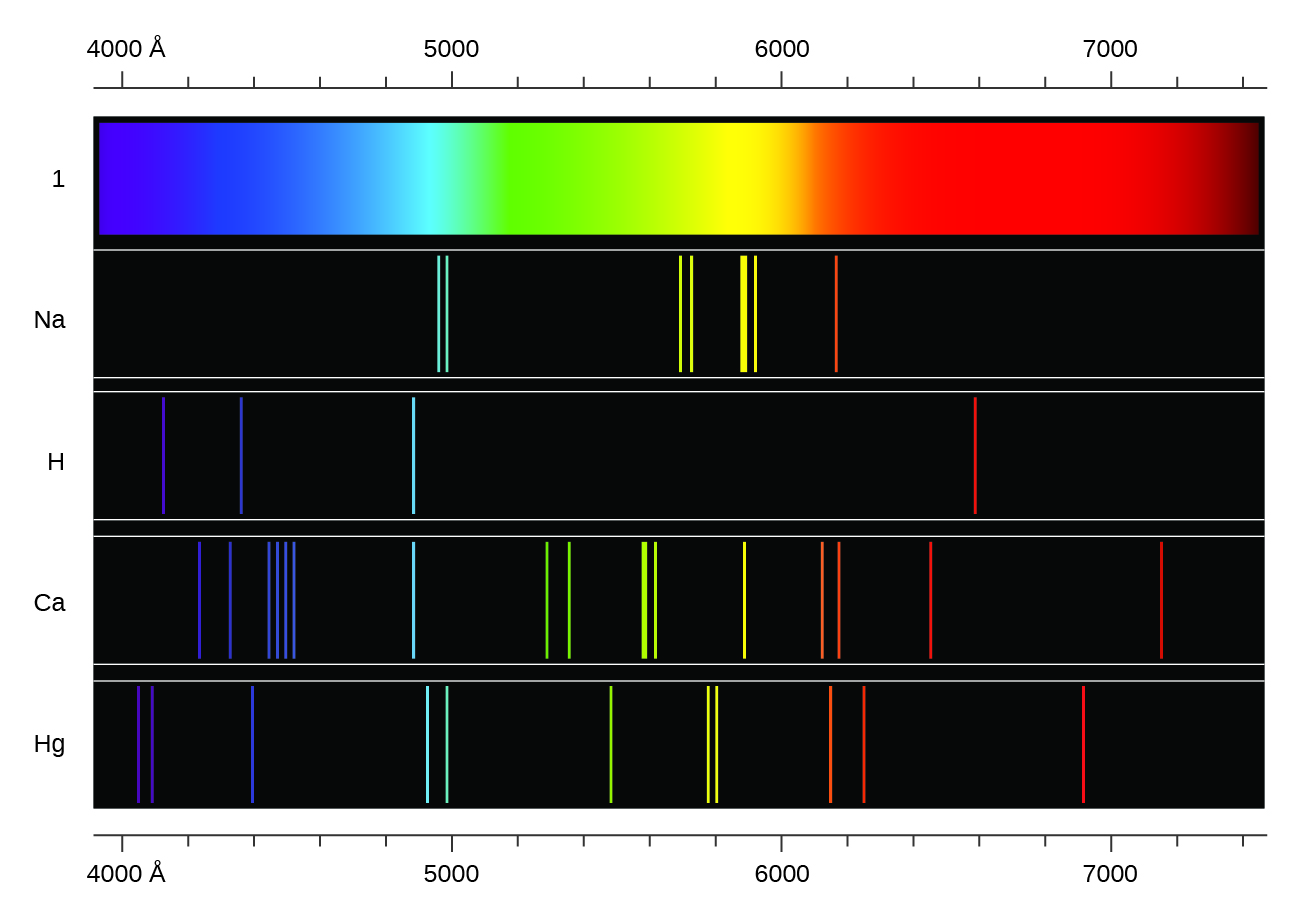
Heating a gaseous element at low pressure, or passing an electric current through the gas, produces a line spectrum, which consists of very sharp peaks (lines) at a few specific wavelengths and no emission whatsoever at the rest of the wavelengths. (The colors of “neon” signs are produced by passing electric current through low-pressure gases.) Each element displays its own characteristic set of lines, as shown in Figure 1. For example, when electricity passes through a tube containing hydrogen gas at low pressure, the H2 molecules are broken apart into separate H atoms and we see a blue-pink color. Passing the blue-pink light through a prism produces the line spectrum in Figure 1: the blue-pink color consists of four discrete visible wavelengths.
In 1885, Johann Balmer discovered an equation that related the four visible wavelengths of light emitted by hydrogen atoms to the integers 3, 4, 5, and 6. For the nth line:
Other discrete lines for the hydrogen atom were found in the ultraviolet and infrared regions. Johannes Rydberg generalized Balmer’s work and developed an empirical formula that predicted all hydrogen emission lines, not just visible ones, where, n1 and n2 are integers, n2 < n1, and R∞ is the Rydberg constant (1.097 × 10⁷ m−1).
Because the wavelengths of hydrogen emission lines were measured to very high accuracy, the Rydberg constant could be determined very precisely. That a simple formula involving integers could account for such precise measurements seemed astounding at the time.
Exercise 4: Hydrogen Atom Emissions
D2.3 Energy Levels: The Bohr Model
Why do emission spectra for low-pressure gases consist of sharp peaks (lines) at certain wavelengths and zero emission everywhere else? How can the Rydberg equation, a simple equation involving integers, calculate the exact wavelengths of such emissions? These questions can be answered if we assume that an electron in a hydrogen atom can have only certain specific energies but cannot have any other energy values—that is, if we assume that there are specific energy levels for an electron in a hydrogen atom.
In 1913, Niels Bohr used Planck’s and Einstein’s ideas that energy is quantized and photon energies are proportional to their frequency to explain hydrogen-atom energy levels. The Bohr model assumed that in a hydrogen atom the electron moved around the nucleus in specific orbits, each with a different distance from the nucleus. Based on Coulomb’s law, the farther the electron is from the nucleus, the higher its energy is, so each orbit corresponded to a different energy. Instead of allowing for all possible values for the orbit energies, Bohr assumed that only certain energies could occur; that is, the energies were quantized. Bohr found that the orbit energies were inversely proportional to the square of an integer:
The proportionality constant k (k = 2.179 × 10⁻¹⁸ J) can be calculated from fundamental values such as the charge and mass of an electron and Planck’s constant.
Exercise 5: Hydrogen-Atom Energies
Calculate the energy of a hydrogen atom when the electron
- has n = 7; E7 = [number] × 10[exponent] J
- has n = 3; E3 = [number] × 10[exponent] J
Bohr further assumed that the atom would only emit or absorb a photon if the electron moved from one orbit to a different orbit. The energy absorbed or emitted corresponded to a difference between the orbit energies:
where Ei and Ef are the initial and final orbit energies.
A positive value of [latex]\Delta E[/latex] means that the atom’s energy increases, corresponding to absorption of a photon with the photon energy added to the atom’s initial energy. A negative [latex]\Delta E[/latex] indicates that the atoms has less energy after the change—the energy is lost through emission of a photon. The energy of the photon is the absolute value of [latex]\Delta E[/latex], [latex]|\Delta E|[/latex]; the sign of [latex]\Delta E[/latex] indicates photon emission (negative) or absorption (positive). Combining the two preceding equations gives:
or
which is identical to the Rydberg equation with [latex]R_{\infty} = –\dfrac{k}{hc}[/latex].
When Bohr calculated the Rydberg constant,
and compared it with the experimentally accepted value, he got excellent agreement. That is, the Bohr model was able to calculate the wavelengths of hydrogen-atom emission lines very accurately. This excellent agreement with experimental results implied that the Bohr model should be taken seriously.
Exercise 6: Hydrogen-Atom Electronic Transition
Calculate
- the change in energy of a hydrogen atom when an electron transitions from n = 7 to n = 3.
- ΔE = [number] × 10[exponent] J
- the wavelength of the photon that results from this change.
Additional Practice
Is the photon emitted or absorbed? Compare the photon wavelength with the wavelength calculated using the Rydberg equation.
D2.4 Hydrogen-Atom Energy Levels
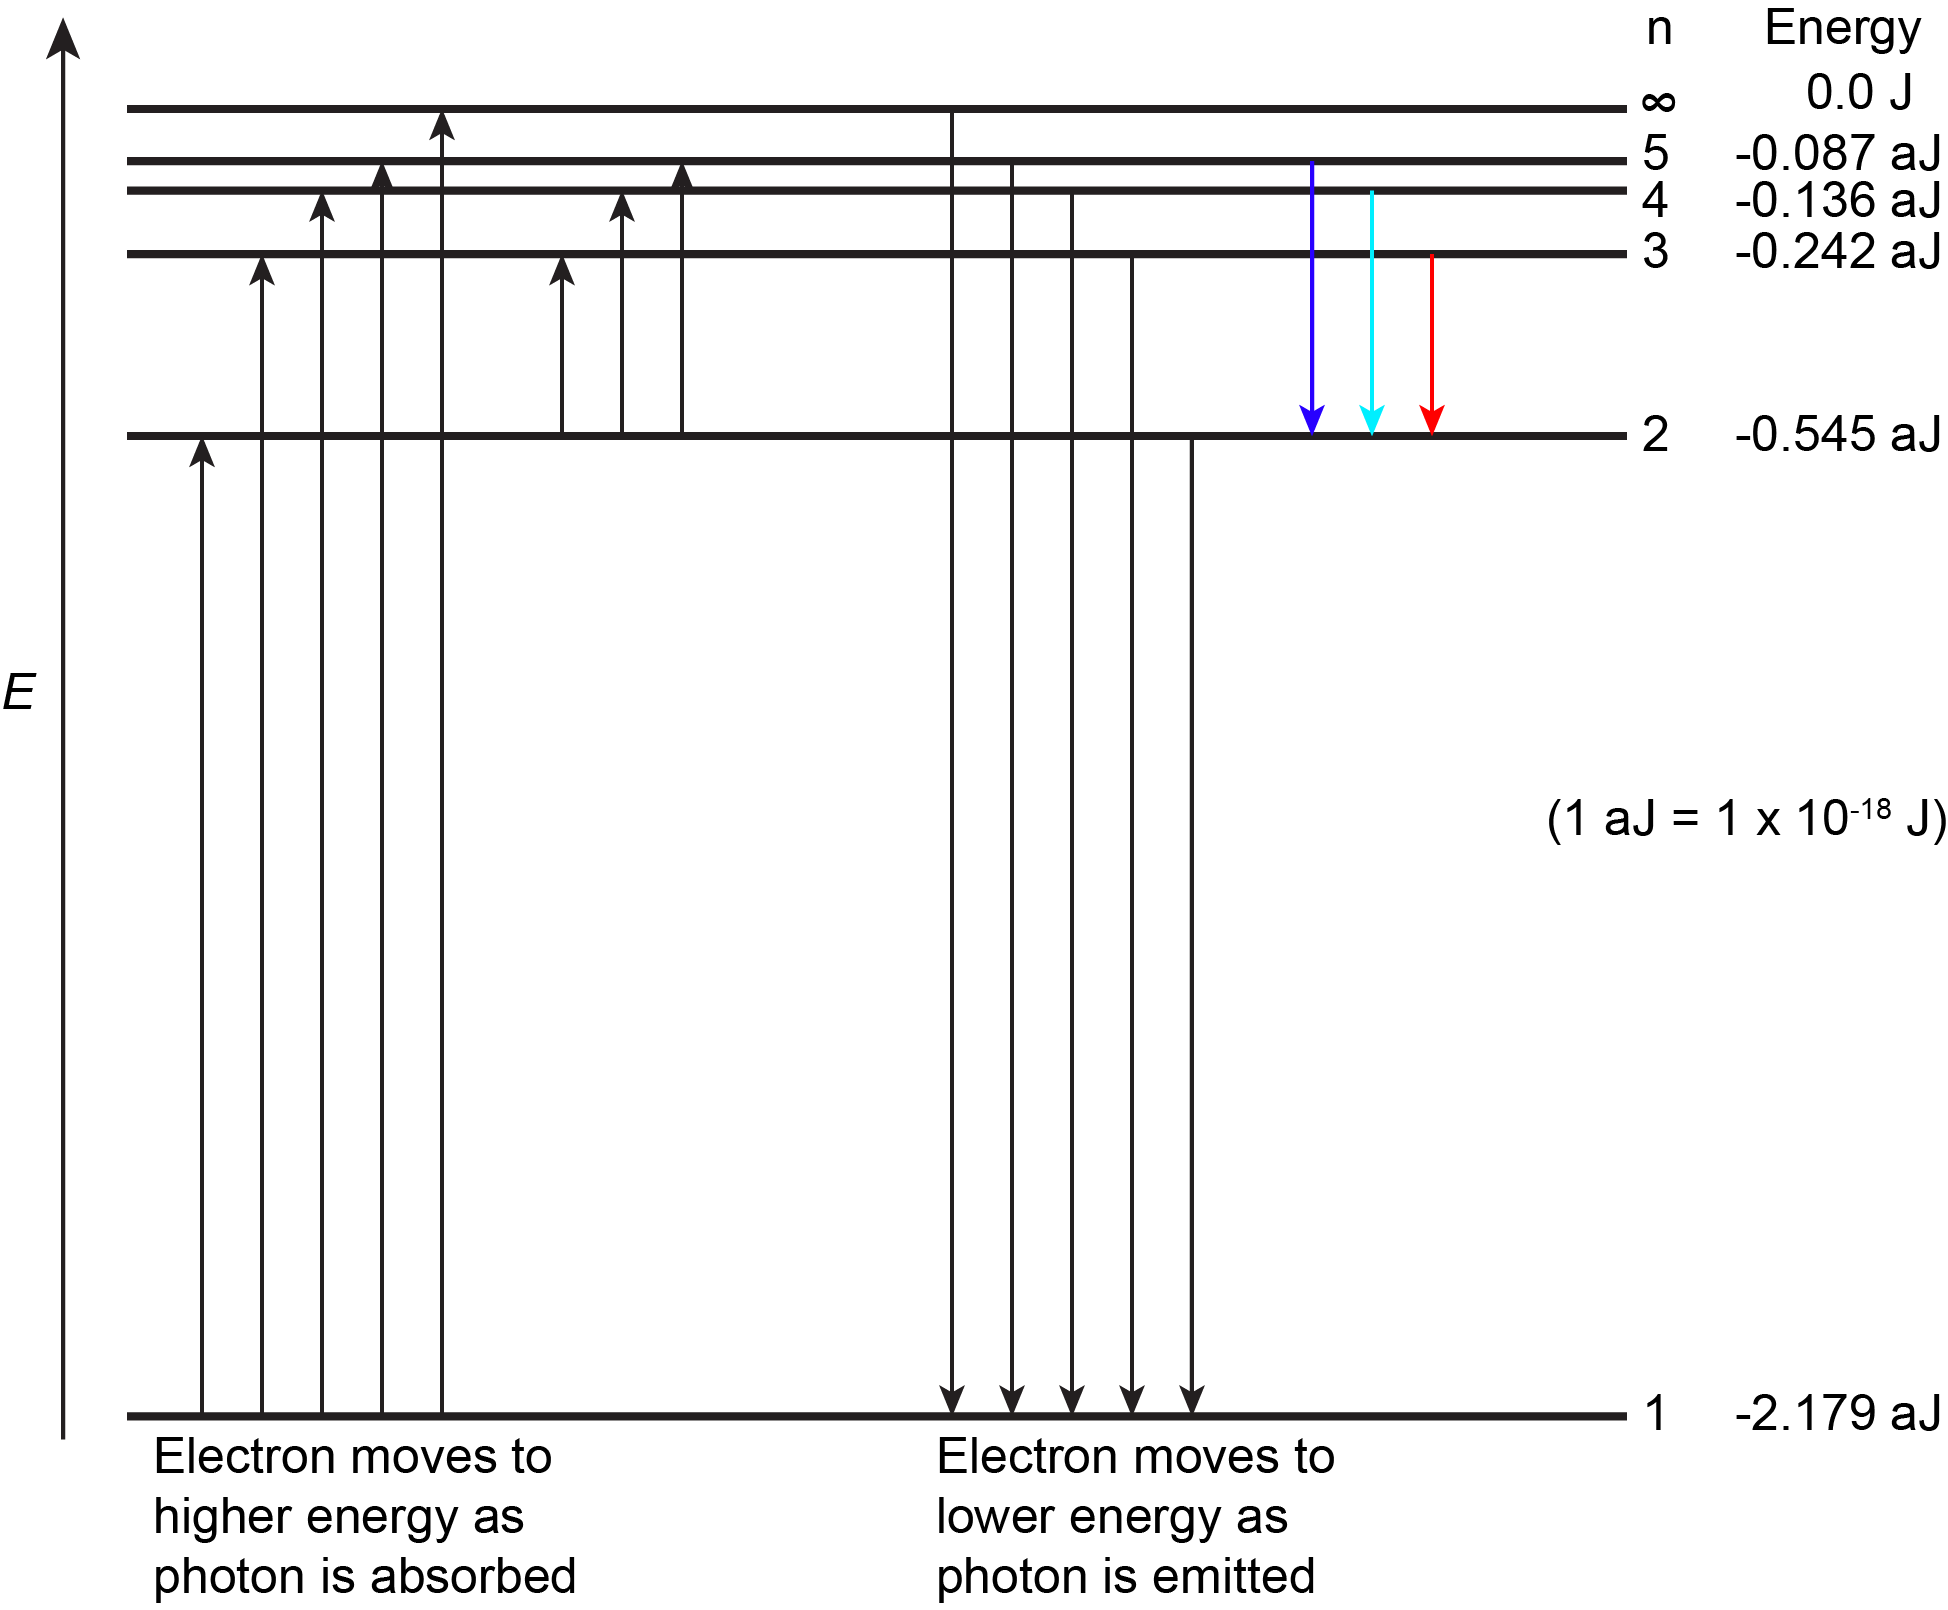
The lowest few energy levels for a hydrogen atom are shown in Figure 2.
An atom is most stable when it has the lowest possible energy. Thus, the electron in a hydrogen atom usually has n = 1, in which case the atom is said to be in its ground electronic state (or simply ground state). If the atom receives energy from an outside source, it is possible for the electron to move to a higher n value (higher energy) and the atom is now in an excited electronic state (or simply an excited state).
If a photon is absorbed by an atom, the energy of the photon moves the electron from a lower energy level up to a more excited one. When an atom is in an excited state the extra energy can be released as one quantum if the electron returns to its ground state (say, from n = 5 to n = 1), or it can be released as two or more smaller quanta if the electron falls to an intermediate state then to the ground state (say, from n = 5 to n = 4, emitting one photon, then to n = 1, emitting a second photon).
As an electron’s energy increases (as n increases), the electron is found at greater distances from the nucleus (the radius, r, of the Bohr orbit increases). This is a corollary of Coulomb’s law: if the electron is farther from the nucleus, the electrostatic attraction between electron and nucleus decreases, and the electron is held less tightly in the atom. Note that as n gets larger and the electron gets farther from the nucleus, energies get closer to zero, and so the limits [latex]n \longrightarrow \infty[/latex] and [latex]r \longrightarrow \infty[/latex] imply that E = 0 corresponds to ionization of the H atom—complete removal of the electron from the nucleus. Thus, for hydrogen in the ground state n = 1, the ionization energy is:
D2.5 Bohr Model Summary
Bohr’s model of the hydrogen atom includes several important features of all models used to describe the distribution of electrons in an atom:
- The energies of electrons (energy levels) in an atom are quantized, described by quantum numbers: integer numbers having only specific allowed values and used to characterize the arrangement of electrons in an atom.
- An electron’s energy increases with increasing distance from the nucleus.
- The discrete energies (lines) in the spectra of the elements result from electronic transitions among quantized energy levels.
Bohr’s model works very well, as long as there is only a single electron outside an atomic nucleus. For example, it can also be applied to the single-electron ions He+, Li2+, Be3+, and so forth, which differ from hydrogen only in their nuclear charges. Such single-electron ions are collectively referred to as hydrogen-like ions. The energy expression for hydrogen-like atoms/ions is a generalization of the hydrogen-atom energy, in which Z is the nuclear charge (+1 for hydrogen, +2 for He, +3 for Li, and so on) and k has a value of 2.179 × 10⁻¹⁸ J.
Unfortunately, neither Bohr nor anyone else was able to extend his theory to the next simplest atom, He, which has two electrons or to the rest of the atoms in the periodic table. The only line spectra that could be explained using the Bohr model were for species with a single electron. The quantum ideas that accounted for blackbody radiation, the photoelectric effect, and the line spectra of hydrogen-like atom had to be extended further, which involved a quantum mechanical model of the atom.
Activity 5: Wrap-up—Atomic Spectra and Bohr Theory
Podia Question
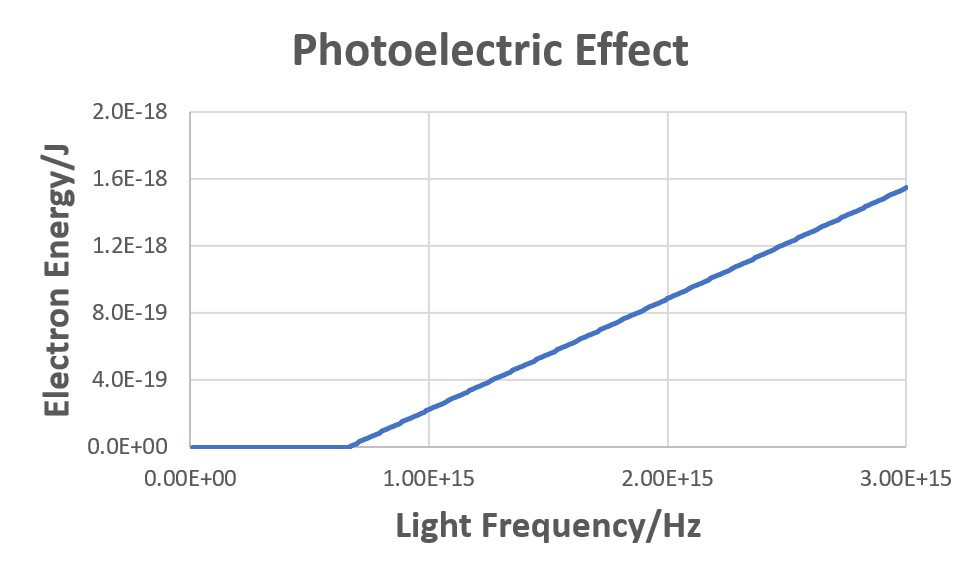 In the photoelectric effect animation, electrons emitted from the metal surface moved faster (had greater energy) the shorter the wavelength of the incident light was. The graph at the right expresses this quantitatively, plotting electron energy vs frequency of light for a particular metal. For each question below show all mathematical work and explain briefly and clearly, using scientifically appropriate language, how you arrive at each result.
- Write an equation that relates electron energy, Eelec, threshold energy, Ethresh (the minimum energy required to eject an electron), and photon energy, Ephot.
- Based on the equation you wrote, figure out the value of the slope of the graph where it is non-zero. (Base your answer on the equation you wrote, not on the graph.)
- For light with wavelength 400 nm the electron energy is found to be 5.76 × 10⁻²⁰ J. Calculate the minimum energy required to eject an electron from the surface of the metal.
Two days before the next whole-class session, this Podia question will become live on Podia, where you can submit your answer.
