
Unit Four
Day 39: Voltaic Cells
As you work through this section, if you find that you need a bit more background material to help you understand the topics at hand, you can consult “Chemistry: The Molecular Science” (5th ed. Moore and Stanitski) Chapter 17-3 through 17-5, and/or Chapter 17.4-17.5 in the Additional Reading Materials section.
D39.1 Voltaic Cell Potential
the potential difference is 0.46 V when the concentrations of copper(II) ions and silver(I) ions are both 1 M.
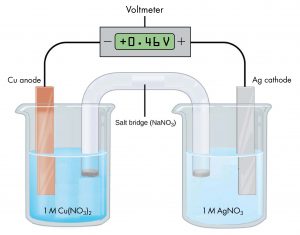
Because the half-cell on the left is the anode, oxidation occurs there and electrons lost from copper atoms cause this electrode to be electrically negative compared with the silver electrode. If the wire from the more negative copper electrode is connected to the negative terminal of the meter (and the wire from the more positive silver electrode is connected to the positive terminal of the meter) the meter reads +0.46 V. This is called the cell potential. The cell potential is a measure of the energy per unit charge available from a redox reaction. Recall that the unit V = J/C.
If the wires were reversed, a typical meter would read −0.46 V. This provides an experimental way to determine which half-cell is the cathode and which is the anode. When the meter’s negative terminal is connected to the left half-cell and the positive terminal is connected to the right half-cell, a positive cell potential indicates that the left half cell is the anode and the right half cell is the cathode. Thus, oxidation occurs in the left half-cell and reduction occurs in the right half-cell. This implies that electrons would flow from the anode to the cathode if the meter did not have a high resistance. To summarize Figure 1:
- If the electrode in the left half-cell is connected to the negative terminal on the meter, the electrode in the right half-cell is connected to the positive terminal on the meter, and the meter gives a positive reading, the left half-cell is the anode and the right half-cell is the cathode.
- The cell potential, +0.46 V in this case, depends on the substances involved in each half-cell, the concentrations of the solutions, and the partial pressures of gases; a positive cell potential indicates how much work the cell can do per unit electric charge moving though the circuit.
- When a voltaic cell produces electric current, a redox reaction occurs with the oxidation half-reaction in the anode half-cell and a reduction reaction in the cathode half-cell.
- Electrons flow from the anode half-cell to the cathode half-cell.
- The salt bridge must be present to complete an electric circuit so that oxidation and reduction occur and current can flow; in the salt bridge anions move toward the anode half-cell and cations move toward the cathode half-cell.
Exercise 1: Voltaic Cell Terminology
Complete the following statements.
D39.2 Cell Notation and Example Voltaic Cells
Drawing diagrams, like Figure 1 above, to define a voltaic cell takes a lot of time. Cell notation is an abbreviation that summarizes the important information about a cell. In cell notation, a vertical line, |, denotes a phase boundary and a double line, ||, a salt bridge. The anode electrode is written to the left, followed by the anode solution, then the salt bridge, then the cathode solution, and, finally, the cathode electrode to the right. The cell notation for the galvanic cell in Figure 1 is related to a drawing of the cell in Figure 2.
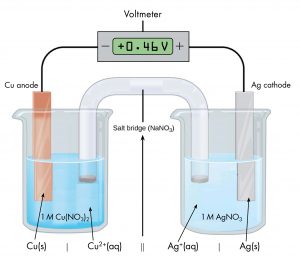
Note that spectator ions, such as NO3−, are not included in the cell notation and that the simplest form of each half-reaction is used (that is, the coefficients of 2 in the silver half-reaction are omitted). When known, the initial concentrations of ions are usually included.
Some redox reactions involve species that are poor conductors of electricity, such as solid salts or gases. For such substances an electrode is used that does not participate in the reactions. Frequently, the electrode is platinum, gold, or graphite, all of which are inert to many chemical reactions. One such system is shown in Figure 3. Magnesium undergoes oxidation at the anode on the left and hydrogen ions undergo reduction at the cathode on the right. The reaction may be summarized as:
Reduction: 2H+(aq) + 2e− ⟶ H2(g)
Overall: Mg(s) + 2H+(aq) ⟶ Mg2+(aq) + H2(g)
The cell uses an inert platinum wire for the cathode, so the cell notation is:
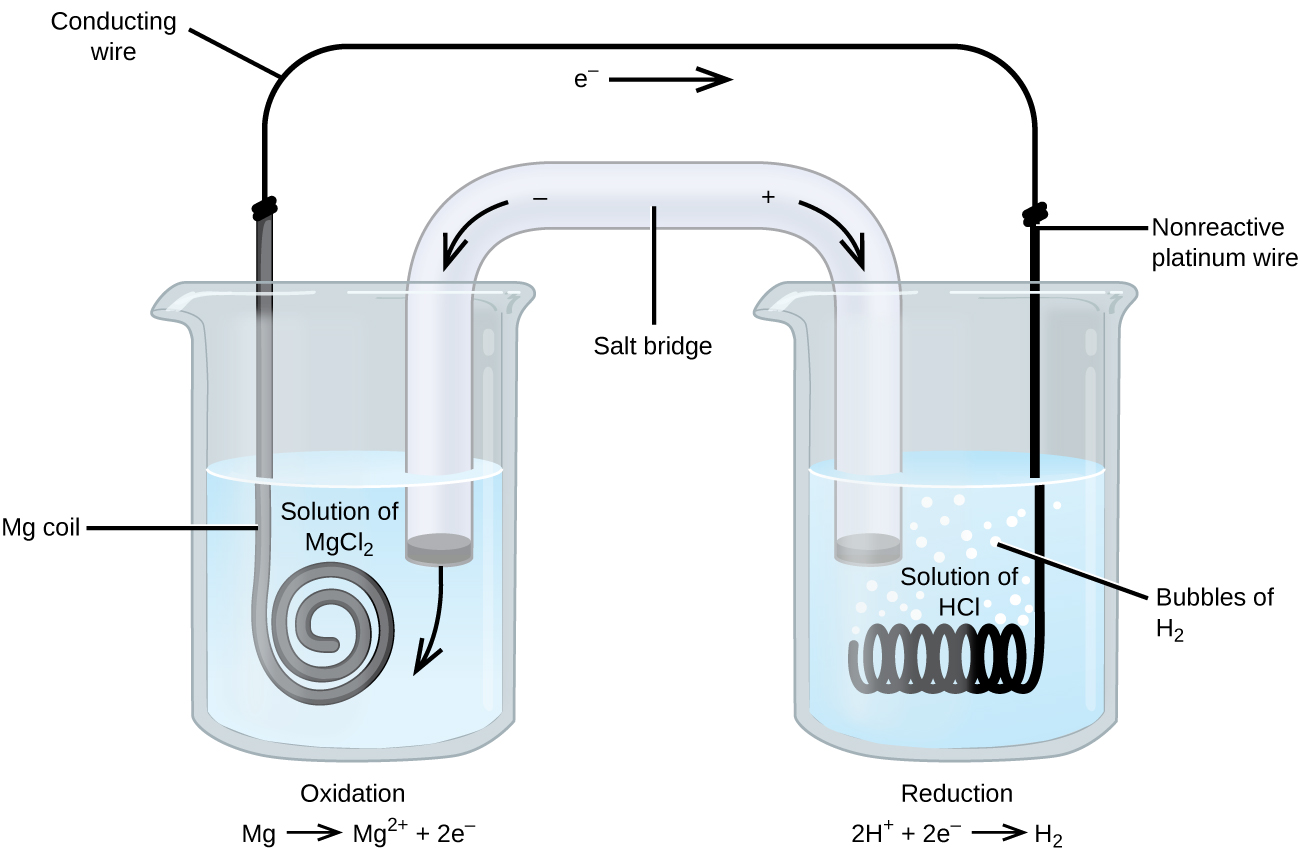
The magnesium electrode is an active electrode because it participates in the redox reaction. Inert electrodes, like the platinum electrode in Figure 3, do not participate in the redox reaction but must be present so that current can flow through the cell. Platinum and gold are among the least reactive metals so they are good choices for inert electrodes.
Example 1
Writing Cell Notation
Consider a galvanic cell based on this reaction:
Write the oxidation and reduction half-reactions and write the reaction using cell notation. Which reaction occurs at the anode? at the cathode?
Solution
By inspection, Fe2+ undergoes oxidation when one electron is lost to form Fe3+, and MnO4− is reduced as it gains five electrons to form Mn2+. Balancing the charge gives
Cell notation uses the simplest form of each of the equations, and starts with the reaction at the anode. It is necessary to use an inert electrode, such as platinum, because there is no metal present to conduct the electrons from the anode to the cathode. No concentrations were specified so:
Oxidation occurs at the anode and reduction at the cathode.
Check Your Learning
This cell notation describes a voltaic cell that generates electric current. Write the balanced net ionic equation for the reaction that occurs when the cell generates electricity.
[latex]\text{Cr}(\text{s})\;{\mid}\;\text{Cr}^{3+}(\text{aq})\;{\parallel}\;\text{Cu}^{2+}(\text{aq})\;{\mid}\;\text{Cu}(\text{s})[/latex]
Answer:
[latex]2\;\text{Cr}(s)\;+\;3\;\text{Cu}^{2+}(\text{aq}) \;\longrightarrow \; 2\;\text{Cr}^{3+}(\text{aq})\;+\;3\;\text{Cu}(s)[/latex]
Exercise 2: Cell Notation
A historically important voltaic cell is the Daniell cell, a variant of which, the gravity cell, was used to power telegraph communication in the late 19th century. In a Daniell cell, zinc reacts with copper(II) ions to generate electric current. Here is a diagram of a gravity cell.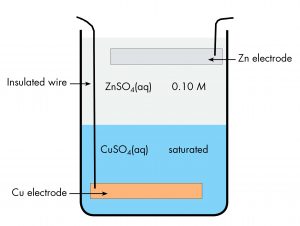
There is a copper electrode at the bottom of a jar with an insulated wire connecting it to the outside. The bottom half of the jar contains saturated copper(II) sulfate solution. The upper half of the jar contains dilute zinc sulfate solution, which is less dense than the copper(II) sulfate and can be carefully poured onto the copper(II) sulfate without mixing the solutions. At the top of the zinc sulfate solution is a zinc electrode, suspended from the rim of the jar. Current flows in a wire connecting the copper electrode to the zinc electrode. There is no salt bridge, but ions can move in either direction across the interface between the two solutions.
Write the cell notation for the gravity cell.
D39.3 Standard Half-Cell Potentials
The cell potential in Figure 1 (+0.46 V) results from the difference in the electrical potential between the half-cells. It is not possible to measure directly the potential of a single half-cell. However, it is useful to tabulate potentials for single half-cells because from such a table the potential for a cell constructed from any two half cells in the table can be calculated as the difference between the two half-cell values from the table.
To create such a table, all half-cell potentials are determined relative to the same reference half-cell. That half-cell is assigned the value of zero and is called the standard hydrogen electrode (SHE) (Figure 4). It consists of hydrogen gas at 1 bar pressure bubbling through a solution with 1 M hydrogen ion concentration. Platinum, which is chemically inert, is used as the electrode. The half-reaction chosen as the reference is:
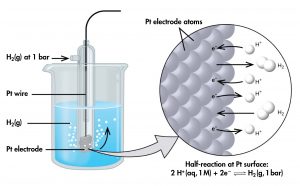
If a cell is set up with the SHE on the left and the half-cell whose potential we want to tabulate on the right, then the reading on the potentiometer is E° (pronounced E-standard), the standard half-cell potential for the half-cell on the right. (The superscript “°” denotes standard-state conditions: 1 bar for gases, 1 M for solutes. Unless specified, the temperature is assumed to be 25 ºC.)
For example, a voltaic cell consisting of a SHE and a Cu2+ | Cu(s) half-cell can be used to determine the standard half-cell potential for Cu2+ | Cu(s). The cell is shown in Figure 5.
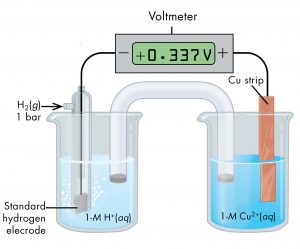
The cell notation for this cell is
The reactions are:
The cell potential, E°cell, which is measured by the potentiometer, is the difference between the potential of the cathode half-cell and the anode half-cell:
From the measured E°cell = 0.337 V, we can calculate E° of the |Cu2+(aq, 1 M) | Cu(s) half-cell:
As another example, consider the cell shown in Figure 6, with cell notation
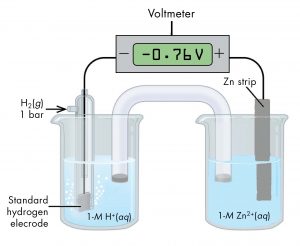
According to the cell notation, the half-cell on the left is the anode and the half-cell on the right is the cathode. Therefore, E° of the Zn2+(aq, 1 M) | Zn(s) half-cell is:
E°cell = E°cathode – E°anode
The standard hydrogen electrode is rather dangerous because hydrogen is very flammable; it is rarely used in the laboratory. Its main significance is that it establishes the zero for standard half-cell potentials. Most standard half-cell potentials are measured by setting up a cell with one half-cell of known standard potential and one half-cell of unknown standard potential.
D39.4 Using Standard Half-Cell Potentials
Based on the methods in the preceding section, standard half-cell potentials have been determined for many half-cells. This table gives half-cell potentials for selected half-cells. Click on the table to open a version that can be enlarged or printed.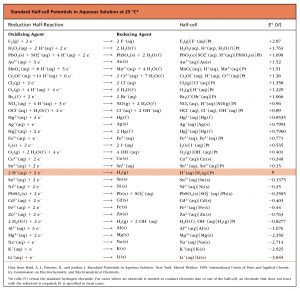 There are several important features of this table:
- The strongest oxidizing agents (the substances most easily reduced) have the largest positive E° values and are at the top of the table on the left side of a reduction half-reaction. For example, F2(g) is a very strong oxidizing agent.
- The strongest reducing agents (the substances most easily oxidized) have the most negative E° values and are at the bottom of the table on the right side of a reduction half-reaction. For example, Li(s) and K(s) are very strong reducing agents.
- An oxidation-reduction reaction is product-favored when a stronger oxidizing agent reacts with a stronger reducing agent. This results in a positive value of E°cell when the oxidation half-reaction is combined with the reduction half-reaction. Therefore, this table can be used to predict whether a specific redox reaction is product-favored.
Once a table of standard half-cell potentials has been set up, it can be used to determine the E°cell for any voltaic cell. For example, for the cell
[latex]E_{\text{cell}}^{\circ} = E_{\text{cathode}}^{\circ}\;-\;E_{\text{anode}}^{\circ} = E_{\text{Ag}^{+}/\text{Ag}}^{\circ}\;-\;E_{\text{Cu}^{2+}/\text{Cu}}^{\circ} = 0.80\;\text{V}\;-\;0.34\;\text{V} = 0.46\;\text{V}[/latex]
Because the value of E°cell is positive, the reaction that occurs when this cell produces electric current is product-favored. The reaction can be obtained from the cell notation by writing the oxidation half-reaction and the reduction half-reaction, multiplying each half-reaction by an appropriate number to balance electrons, and summing the two reactions. In this case the half-reactions are
Oxidation: Cu(s) → Cu2+(aq) + 2 e−
Reduction: Ag+(aq) + e− → Ag(s)
Multiplying the reduction half-reaction by 2 and summing gives the overall reaction.
Cu(s) + 2 Ag+(aq) → Cu2+(aq) + 2 Ag(s)
Notice that even though the second half-reaction is multiplied by 2, the E° is not multiplied by 2 when E°cell is calculated. This is because electrical potential is a ratio of energy per coulomb of charge transferred (V = J/C). If the half-reaction is doubled, both energy and charge transferred are doubled, leaving the ratio energy/charge constant.
E° for many reduction reactions are included in the appendix. Tables like these make it possible to determine the E°cell for many redox reactions. Moreover, by comparing the standard potentials, we can discern which species is easier to reduce/harder to oxidize/is a stronger oxidizing agent (higher/more positive E°) and which species is easier to oxidize/harder to reduce/is a stronger reducing agent (lower/more negative E°).
Exercise 3: Using Standard Half-cell Potentials
Use the table of standard half-cell potentials to answer these questions. (When entering formulas, leave subscripts on the line and put charges in parentheses; for example, Hg22+ is entered as Hg2(2+).)
Podia Question
Use data from the table of standard half-cell potentials to determine whether this redox reaction is product-favored.
2 NO3−(aq) + 8 H+(aq) + 3 Cd(s) ⇌ 2 NO(g) + 3 Cd2+(aq) + 4 H2O(l)
Suggested approach: write the cell notation for a voltaic cell based on this reaction and determine whether E°cell is positive.
Two days before the next whole-class session, this Podia question will become live on Podia, where you can submit your answer.
