D2.3 Atomic Energy Levels
Why should a hydrogen atom emit only four specific colors of visible light? To understand this better, we need to know more about the energy of the atom and how energy depends on atomic structure. An atom consists of a tiny nucleus surrounded by one or more electrons. The simplest atom, a hydrogen atom, has one proton as the nucleus and one electron outside the nucleus. According to Coulomb’s law, the electron and proton attract.
Exercise: Electrostatic Potential Energy
Activity: Line Spectra and Energies
Think about the implications of line spectra. If a hydrogen atom emits only four specific wavelengths in the visible region, what does this imply regarding the energies of the emitted photons? Why should only these four wavelengths be emitted, but none of the other possible wavelengths? Write your explanation in your notebook.
Write in your notebook, then left-click here for an explanation.
Each emitted wavelength corresponds to a specific photon energy. The energy is given by ![]() .
.
For the four lines in the visible range of the hydrogen-atom spectrum, the wavelengths and photon energies are:
- 656.4 nm, 302.6 × 10⁻²¹ J
- 486.2 nm, 408.6 × 10⁻²¹ J
- 434.1 nm, 457.6 × 10⁻²¹ J
- 410.2 nm, 484.2 × 10⁻²¹ J
When a photon is emitted, the energy of the atom must decrease by the quantity of energy emitted; that is, by the photon energy. Thus, there must be specific decreases in energy for the atom and they are equal to 302.6 zJ, 408.6 zJ, 457.6 zJ, and 484.2 zJ. ( 1 zJ = 10−21 J)
These specific decreases in energy are possible if the electron in a hydrogen atom can only have specific values of energy; that is, energy levels.
The model currently used to describe the distribution of electrons in an atom has these attributes:
- The energies of electrons in an atom are restricted to energy levels, which are specific allowed energies.
- Each line in the spectrum of an element results when an electron’s energy changes from one energy level to another; a change from one electronic energy level to another is called an electronic transition.
- Electrons are distributed in regions centered on the nucleus, called shells; each shell has a different average distance from the nucleus.
- As described by Coulomb’s law, an electron’s energy increases with increasing average distance from the nucleus; that is, with increasing size of an electron shell.
- Both energy levels and shells are described by quantum numbers, numbers restricted to specific allowed values; the electron energies are said to be quantized, restricted to discrete energy levels.
An atom is most stable when it has the lowest possible energy. The lowest energy electronic state of an atom is called its electronic ground state (or simply ground state). Any higher energy state of an atom is called an electronic excited state (or simply an excited state).
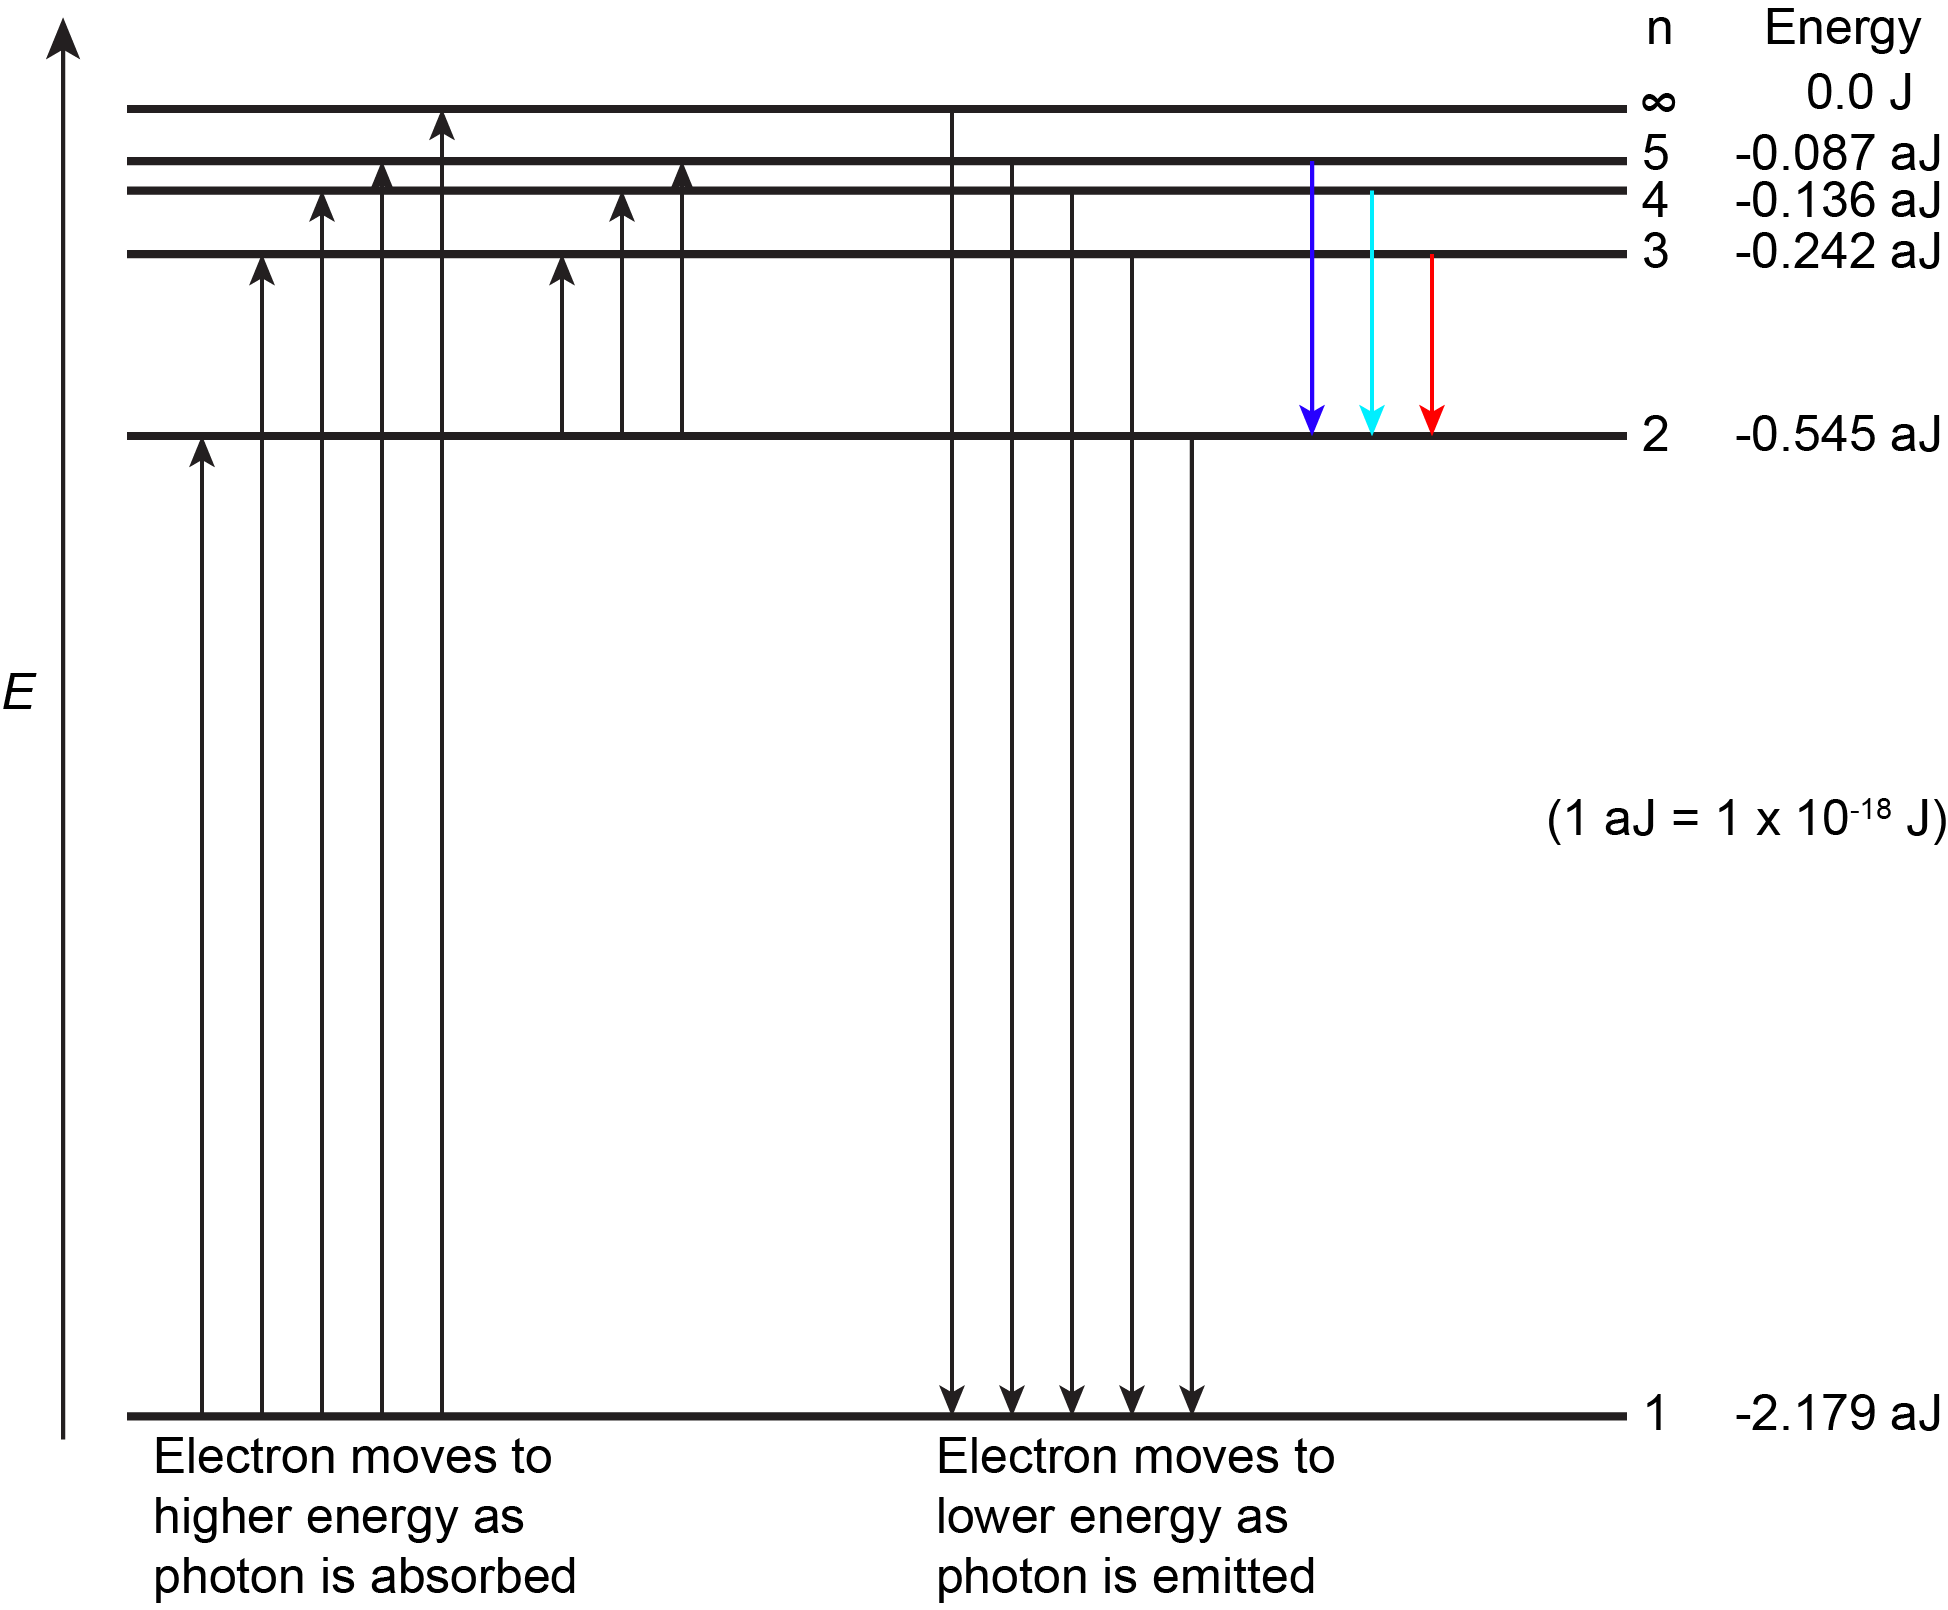
The figure below shows the first few energy levels of a hydrogen atom. The atom is in its ground state when its electron is in the n = 1 (lowest energy) level. When a photon is absorbed by a ground state hydrogen atom, as shown on the left side of the figure, the energy of the photon moves the electron to a higher n (higher energy) level, and the atom is now in an excited state.
An atom in an excited state can release the extra energy as a single photon if the electron returns to its ground state (say, from n = 5 to n = 1), or the energy can be released as two or more lower energy photons if the electron falls to an intermediate state then to the ground state (say, from n = 5 to n = 2, emitting one photon, then from n = 2 to n = 1, emitting a second photon).

Please use this form to report any inconsistencies, errors, or other things you would like to change about this page. We appreciate your comments. 🙂 (Note that we cannot answer questions via the google form. If you have a question, please post it on Piazza.)

