D6.1 Covalent Bonding: Molecular Orbitals
Applying Core Ideas: Comparing Hydrogen Atoms and Helium Atoms
The boiling point of helium is 4.22 K (−268.93 °C), a consequence of very weak London dispersion forces (LDFs) between He atoms. Even when two He atoms are only a short distance apart, there is very little attraction.
When two H atoms get close there is a much stronger attraction: the two atoms become a H2 molecule by forming a covalent chemical bond. For the H2 molecules to have enough energy to break that bond, separating the two H atoms, the temperature needs to be similar to the temperature of the Sun (5778 K)!
Why do He atoms behave so differently from H atoms? We need to refine our models of structure and energy still further. This is done in the next sections.
Activity: Covalent Chemical Bonds
If you wrote that a covalent bond involves sharing electrons between atoms, that’s a good start. But how does sharing electrons hold atoms together?
Just as a balance of coulombic attractions and repulsions affects the electrons and nucleus in an atom, coulombic interactions affect electrons and nuclei in a molecule. The major difference is that in a molecule, each electron interacts with two or more nuclei. This additional interaction provides the stabilization that allows the molecule to exist. If a collection of separate atoms were more stable than a molecule, the molecule would simply fall apart into individual atoms.
Just as electrons occupy stable atomic orbitals around a single nucleus in an atom, electrons occupy stable orbitals around multiple nuclei in a molecule. An orbital that extends over two or more atomic nuclei is called a molecular orbital (MO); in the MO model, a molecular orbital forms when atomic orbitals (AOs) overlap (or interpenetrate).
Bonding Molecular Orbital
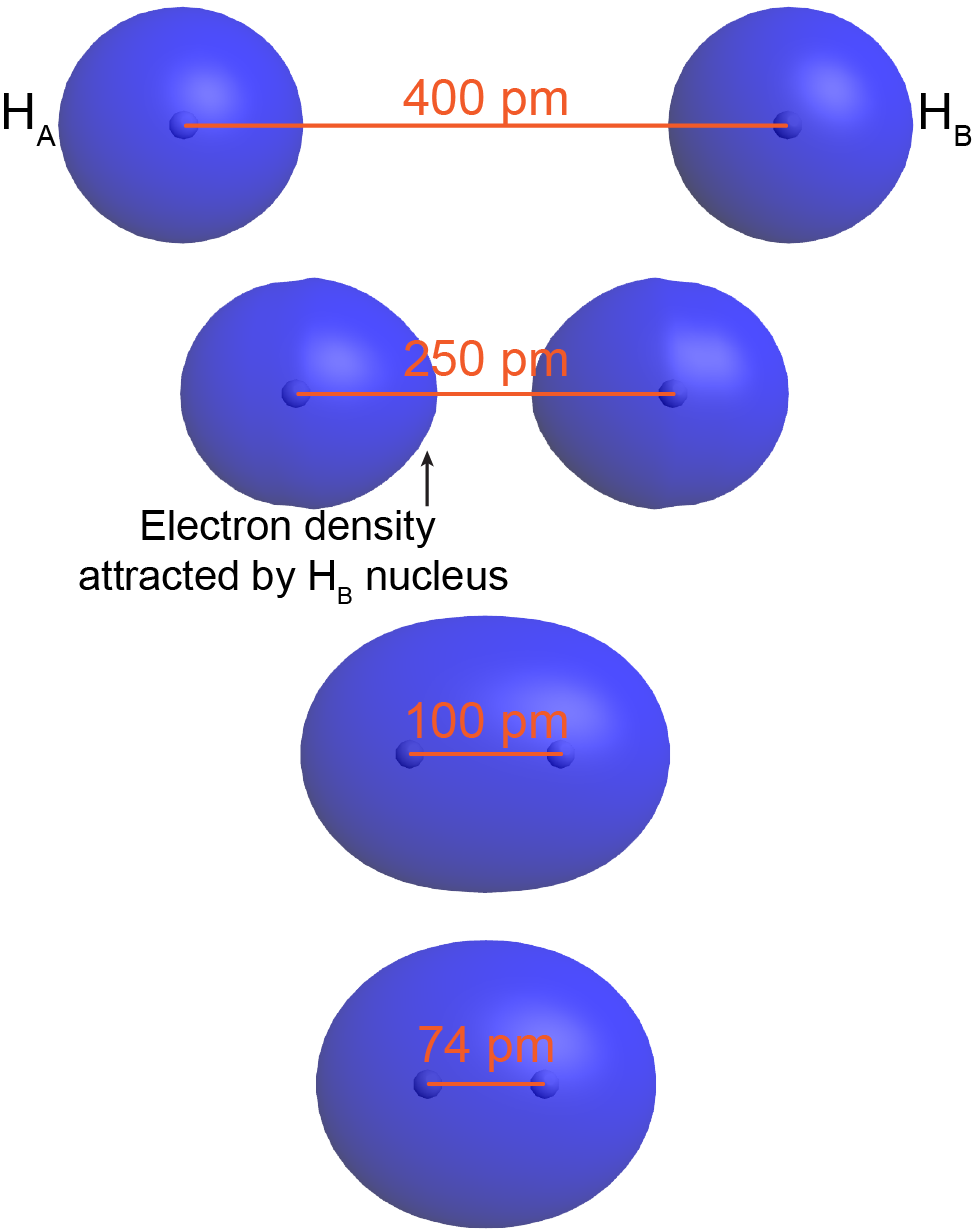
To understand this better, think about the formation of a H2 molecule from two ground-state hydrogen atoms (labeled as HA and HB in Figure: Bond Formation). When HA is sufficiently far away from HB—for example, more than 400 pm apart—its electron (eA) occupies the lowest-energy atomic orbital, the 1s orbital. The same is true for HB.

As HA and HB get closer, eA begins to experience significant coulombic attraction towards HB’s nucleus. For example, at 250 pm apart, the orbital occupied by eA is no longer spherical around HA’s nucleus but rather is distorted with more electron density on the side towards HB. Although HB’s nucleus attracts eA less than HA’s nucleus (because HB’s nucleus is screened by eB), there still is a net increase in the positive charge interacting with eA. This lowers eA’s potential energy. The same argument applies to eB.
When the two atoms are even closer—for example, 100 pm apart—eA and eB become delocalized over both nuclei: both electrons occupy a molecular orbital, which surrounds both nuclei. Notice that in this H2 molecular orbital, there is significant electron density in between the two nuclei, attracting both nuclei. This lowers the overall energy relative to the energy of the two separate hydrogen atoms.
As the two atoms get closer still, there is a minimum in the overall energy for the molecule. For H2, the minimum is at 74 pm. At internuclear distances smaller than 74 pm, the energy rises again due to increasing electron-electron and nucleus-nucleus repulsions. In a ground-state H2 molecule the distance between nuclei of two bonded atoms, the bond length, is 74 pm.
Figure: E vs Distance for H2 (below) allows you to explore how the electron density changes as two H atoms interact to form H2 (or how an H2 molecule dissociates into two separate H atoms). The blue dot on the potential energy curve shows the corresponding internuclear distance (bond length) and potential energy of the molecule. The ground-state H2 molecule is more stable than the two separated ground-state H atoms. (The energy of the separated atoms is set to be 0 kJ/mol in the figure.) The magnitude of the energy reduction, 436 kJ/mol, is called the bond energy, the energy required to break the bond, completely separating the atoms.
What we have just described is one of two ways that the two H 1s atomic orbitals can overlap/combine to form an H2 molecular orbital. It occurs when the two 1s atomic orbitals are in-phase. In-phase means that wave functions describing electrons A and B both have maxima in the same direction at the same time.
Antibonding Molecular Orbital
Left-click here for optional information
Click here for more information about in-phase and out-of-phase overlap.

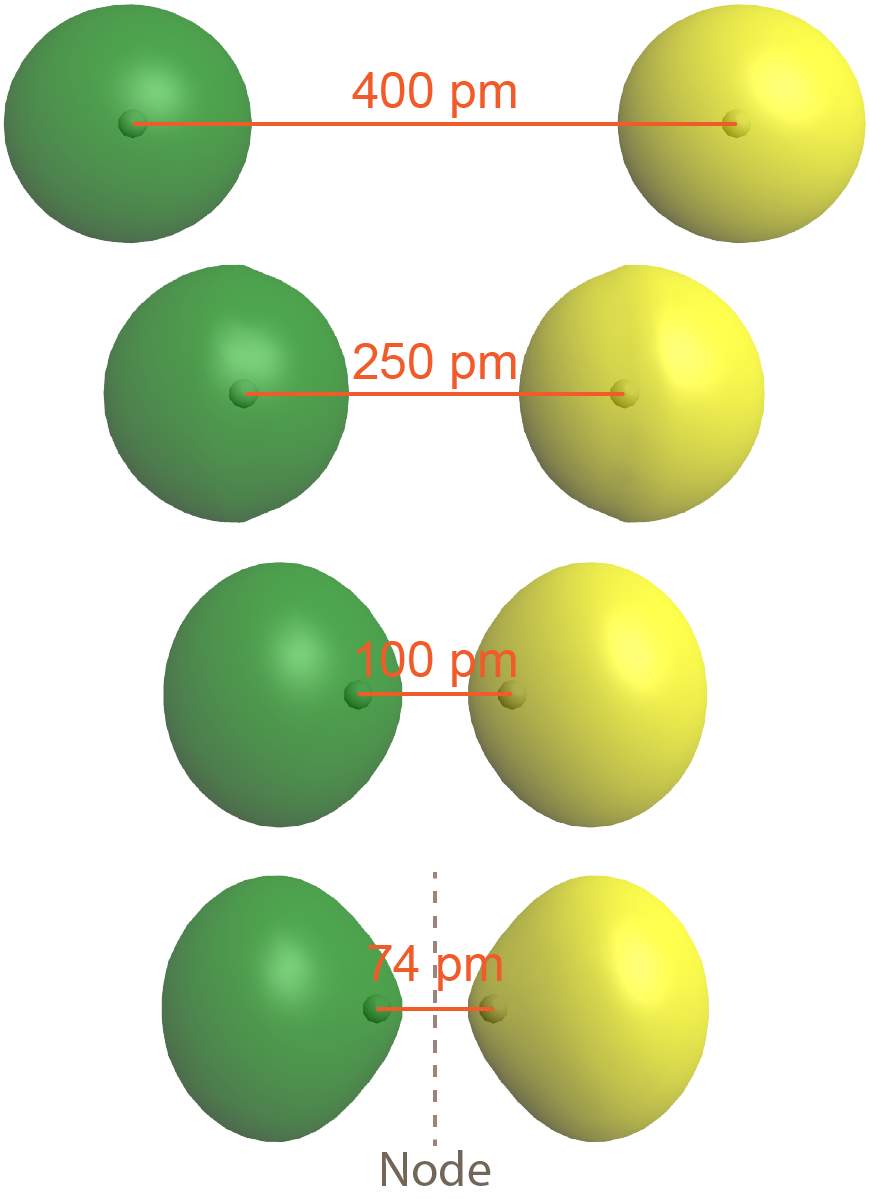
The second possibility is that the two overlapping 1s atomic orbitals are out-of-phase, which means that one atomic wave function is positive and the other atomic wave function is negative. This is shown in Figure: Antibonding MO (right), where the two phases (positive and negative) are shown in green and yellow.
The result is a molecular orbital with a node, where electron density is zero, halfway between the two H atoms. This node is a plane perpendicular to the internuclear axis (a line connecting the two nuclei). Note that the bottom depiction in the figure is a single molecular orbital with one node, just as the bottom depiction in Figure: Bond Formation is a single molecular orbital but without a node.
As is true of atomic orbitals, a molecular orbital with more nodes has higher energy, which makes sense because the presence of the node reduces electron density between the nuclei (compared to the electron densities of the individual atoms). This reduction in electron density results in less electron-nucleus attraction than if the atomic orbitals had not interacted at all.
Drawing AOs and MOs
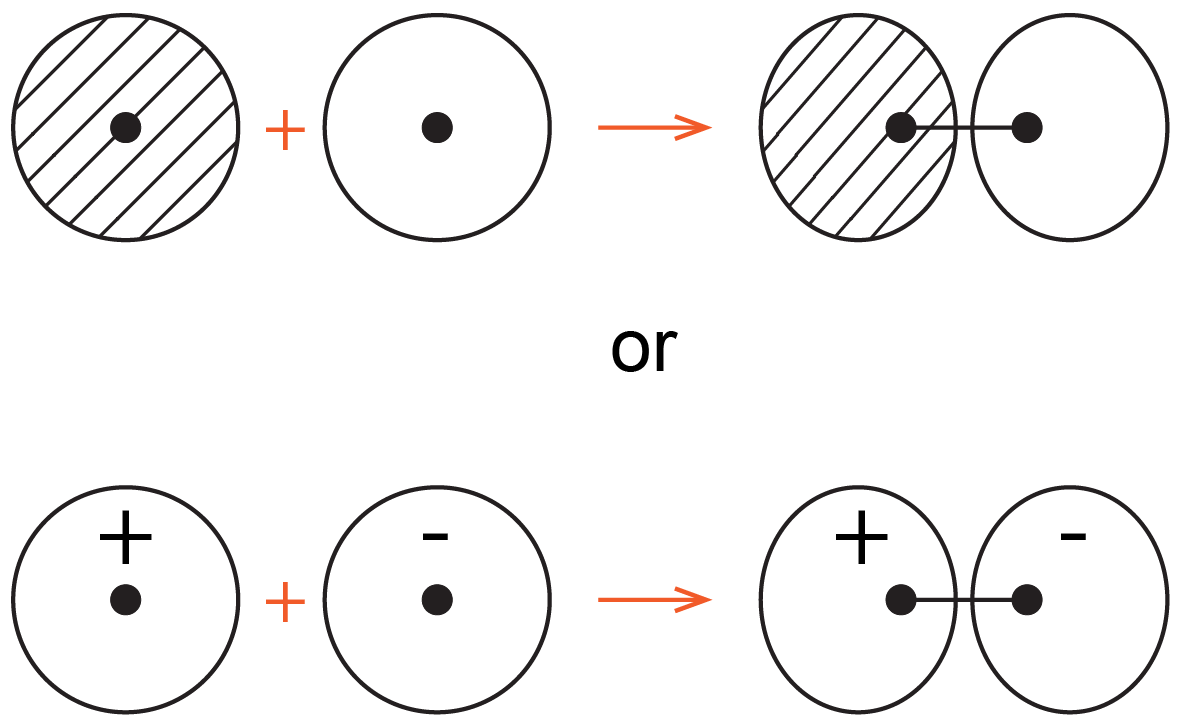
Chemists often use simple 2D drawings to show both the shape and phase of atomic orbitals (AOs) and molecular orbitals (MOs). So the sphere of a 1s AO is drawn as a circle and its phase is indicated by two different colors, or shading/no shading, or plus/minus sign. For example, formation of the bonding MO from two 1s AOs can be drawn as:

where the black dots represent H nuclei, the circles with hatching (or + sign) represent boundary-surface plots of H 1s AOs, each with positive phase, and the oval with hatching (or + sign) represents the bonding MO, also with positive phase.
Activity: Molecular Orbital Formation
Make a diagram analogous to the one above to show formation of the antibonding MO. Use both shading/no shading and +/− to designate phases.
Draw a diagram, then left-click here for an explanation.
The sigma antibonding molecular orbital can be drawn as shown below.

The opposite phase on the second atom results in a node between the nuclei and antibonding character for the molecular orbital. Diagrams like these are easy to draw so they are often used in discussions of chemical bonding.
Please use this form to report any inconsistencies, errors, or other things you would like to change about this page. We appreciate your comments. 🙂 (Note that we cannot answer questions via the google form. If you have a question, please post it on Piazza.)

