
D23.3 Gibbs Free Energy and Reaction Quotient
The relationship between Gibbs free energy, Q, and K is illustrated graphically in the figure below. The x-axis is the extent of reaction, the fraction of reactants that has been converted to products. The extent of reaction varies from 0 when there are only reactants (far left, Q = 0) to 1 when there are only products (far right Q = ∞). The y-axis is the Gibbs free energy, and Δy between two points on the plot corresponds to ΔrG (change in Gibbs free energy at nonstandard state). The Δy between the two ends of the plot corresponds to ΔrG° (∑ΔfG°(products) − ∑ΔfG°(reactants)). The slope of the graph at any point is Δy/Δx = ΔrG/Δx.
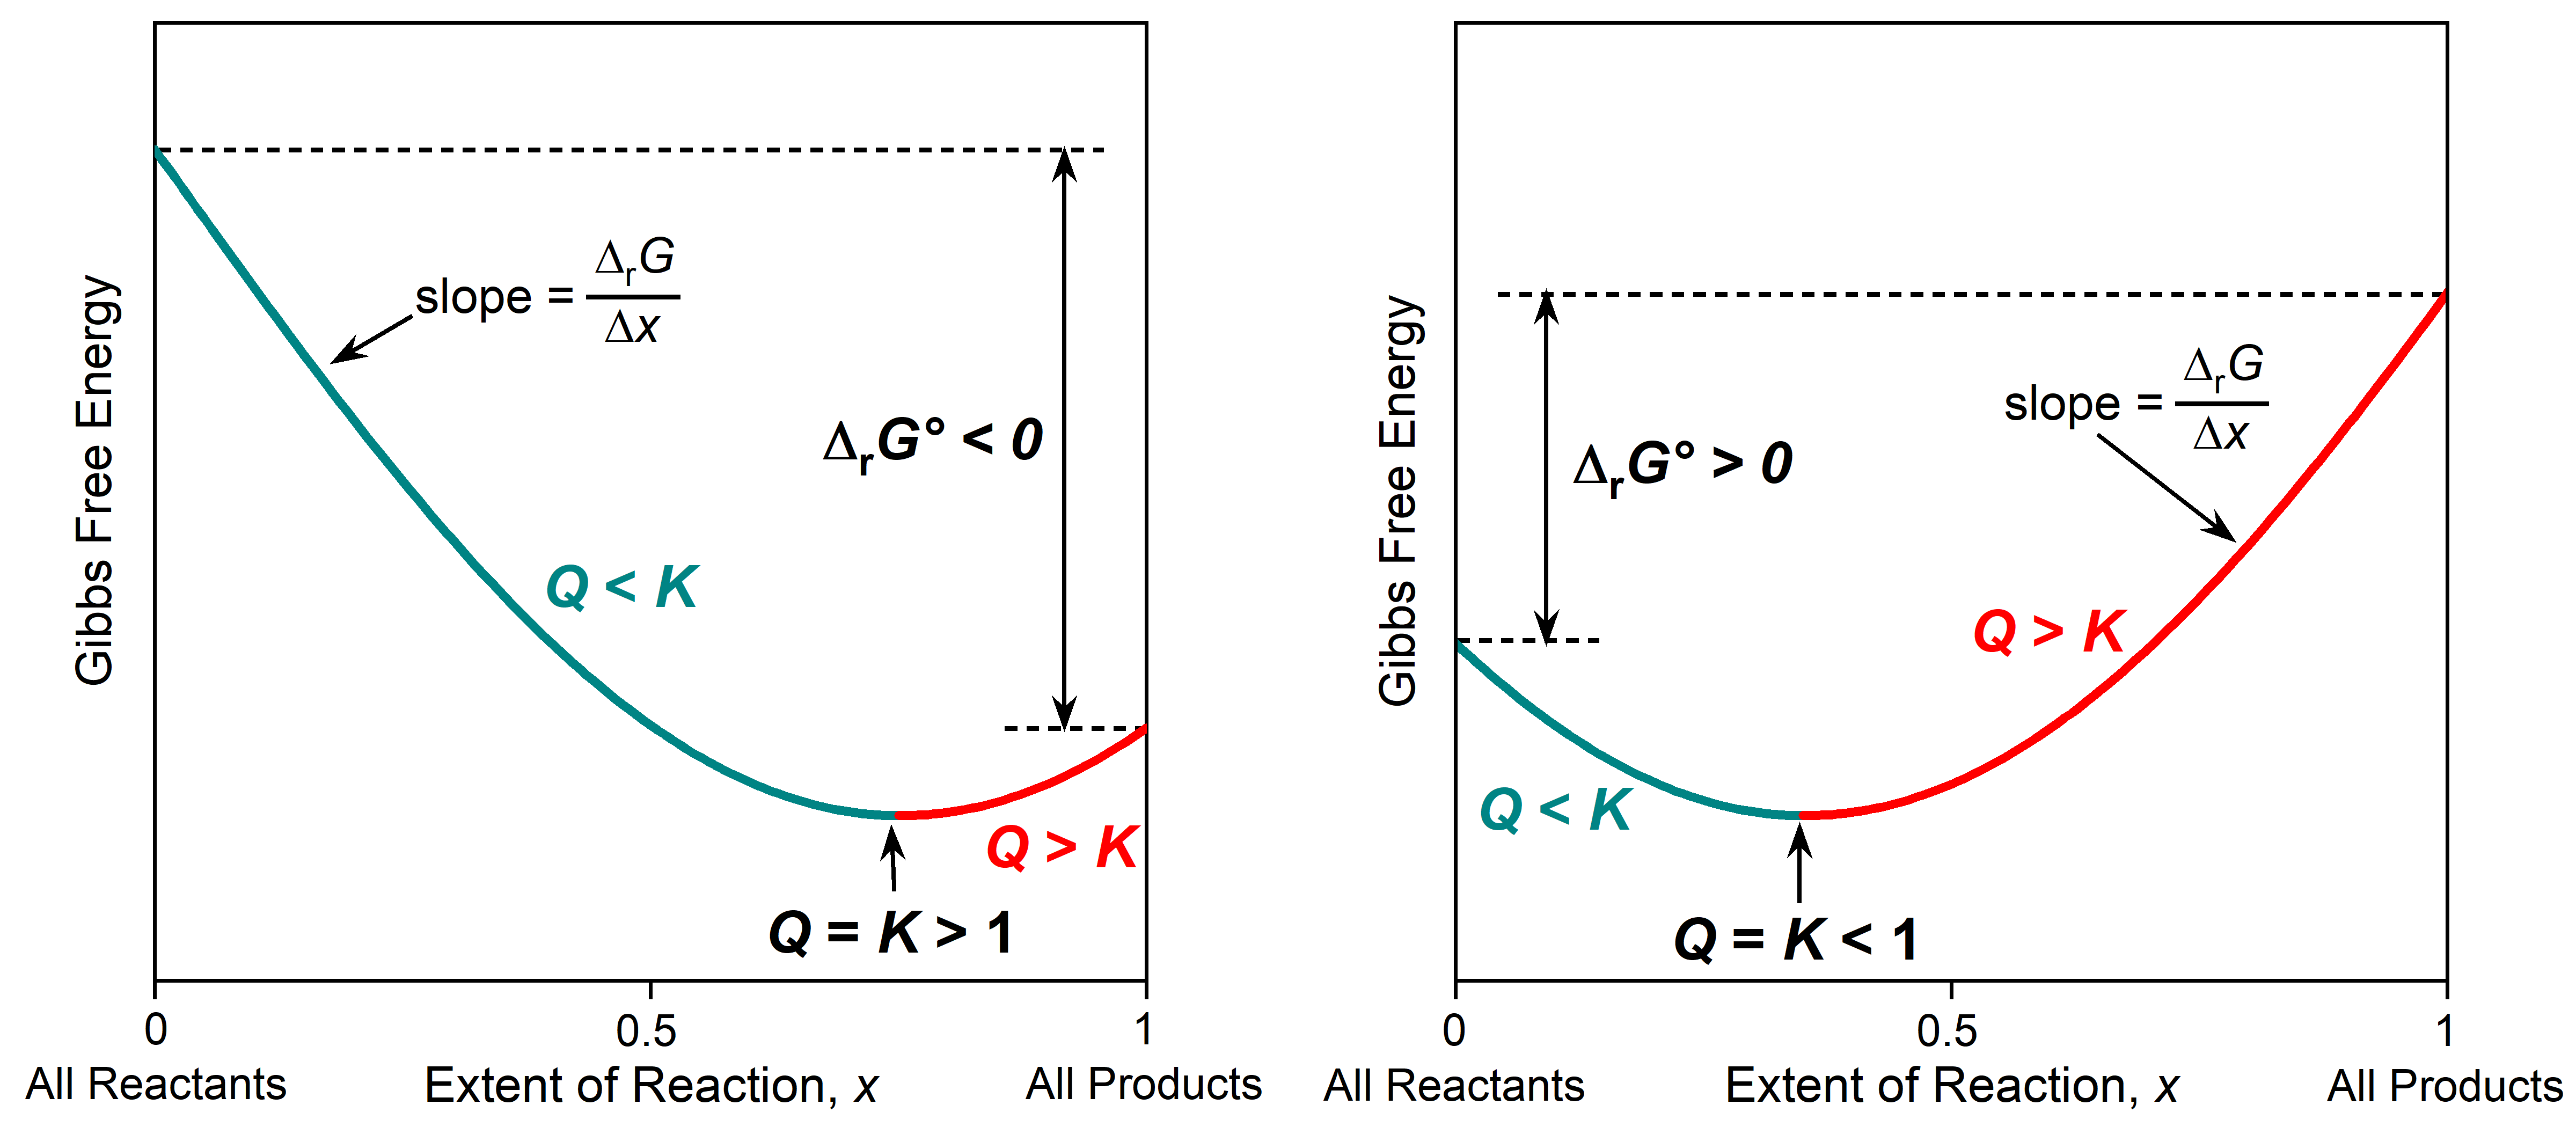
The part of the plot that is cyan corresponds to reaction mixtures where Q < K. In this region the slope, ΔrG/Δx, is negative, so as the reaction proceeds forward (from reactants to products), then each incremental progress of the reaction (positive Δx) has a negative ΔrG. This predicts spontaneous forward reaction.
The part of the plot that is red corresponds to reaction mixtures where Q > K. In this region the slope, ΔrG/Δx, is positive, so as the reaction proceeds forward (from reactants to products), then each incremental progress of the reaction (positive Δx) has a positive ΔrG. This predicts spontaneous reverse reaction.
At the very bottom of the curve (minimum Gibbs free energy) the system is at equilibrium with Q = K. At the minimum in the curve the slope is zero, so ΔrG must be zero; the reaction is not spontaneous in either direction. You can think of such a plot as a Gibbs free energy valley. The reaction proceeds spontaneously toward the lowest Gibbs free energy, going down the side of this valley and reaching equilibrium at the very bottom.
Where equilibrium lies along the x-axis depends on K and the sign of ΔrG°. When K > 1 and ΔrG° < 0, the equilibrium (minimum in the curve) is further to the right, indicating that there are more products than reactants in the equilibrium mixture. When K < 1 and ΔrG° > 0, the equilibrium is further to the left, indicating that reactants predominate in the equilibrium mixture.
The Gibbs free energy change for a small increment in extent of reaction at any point along the extent-of-reaction curve involves adjusting ΔrG° by the factor RT(lnQ):
At equilibrium, Q = K and ΔrG = 0, therefore:
which gives
Exercise: Gibbs Free Energy—Nonstandard Conditions
Please use this form to report any inconsistencies, errors, or other things you would like to change about this page. We appreciate your comments. 🙂 (Note that we cannot answer questions via the google form. If you have a question, please post it on Piazza.)
