
D1.5 Matter, Energy, Models
In this course you will be asked to examine data and draw conclusions, to explain phenomena by applying basic principles, and to build models from which you can predict physical and chemical properties. Two important and interconnected ideas are fundamental:
- The spatial arrangement (structure) of atomic-level particles can predict macroscopic properties and chemical reactivity;
- Energies of atomic-level particles can be used to explain atomic-level structures and macroscopic energy changes.
Atomic-scale particles adopt structures with minimum energy, unless energy is transferred to them from an external source. Therefore it is useful to be able to calculate quantitatively or predict qualitatively whether one situation has higher or lower energy than another. Chemistry often involves electrically-charged atomic-scale particles, such as protons, electrons, or ions. The potential energy of two point electric charges (charges that occupy a single geometric point) can be calculated using an equation derived from Coulomb’s law:

In this equation ke is a proportionality constant equal to 8.99 × 10⁹ J·m/C2, Q1 and Q2 are electric charge values (with units of coulomb, C), and r is the distance between the charges (with units of meter, m). Thus, the magnitude of the potential energy of two charged particles is proportional to the magnitude of each charge and is inversely proportional to the distance between the charges. The energy is positive if the charges of the two particles have the same sign (both positive or both negative). The energy is negative if the charges are opposite—opposite charges attract and lower potential energy is the result. The direct proportionality to electric charge and inverse proportionality to distance enable qualitative predictions: larger opposite charges closer together result in lower energy and hence greater stability.
Exercise: Potential Energy of Charged Particles
For all exercises, before doing any calculation or looking at any hint, write in your class notebook an explanation of how you plan to work out the problem. Do all the steps in the calculation in your notebook. Once you have arrived at an answer, submit your results below and click the “Check” button to see if it is correct. If one or more parts of your answer is incorrect, go over your work in your notebook carefully and check for errors. “Retry” with your new answer. Look at the solution (click on it to expand for view) only after you have made attempts at answering the question.
Activity: Potential Energy and Distance between Ions
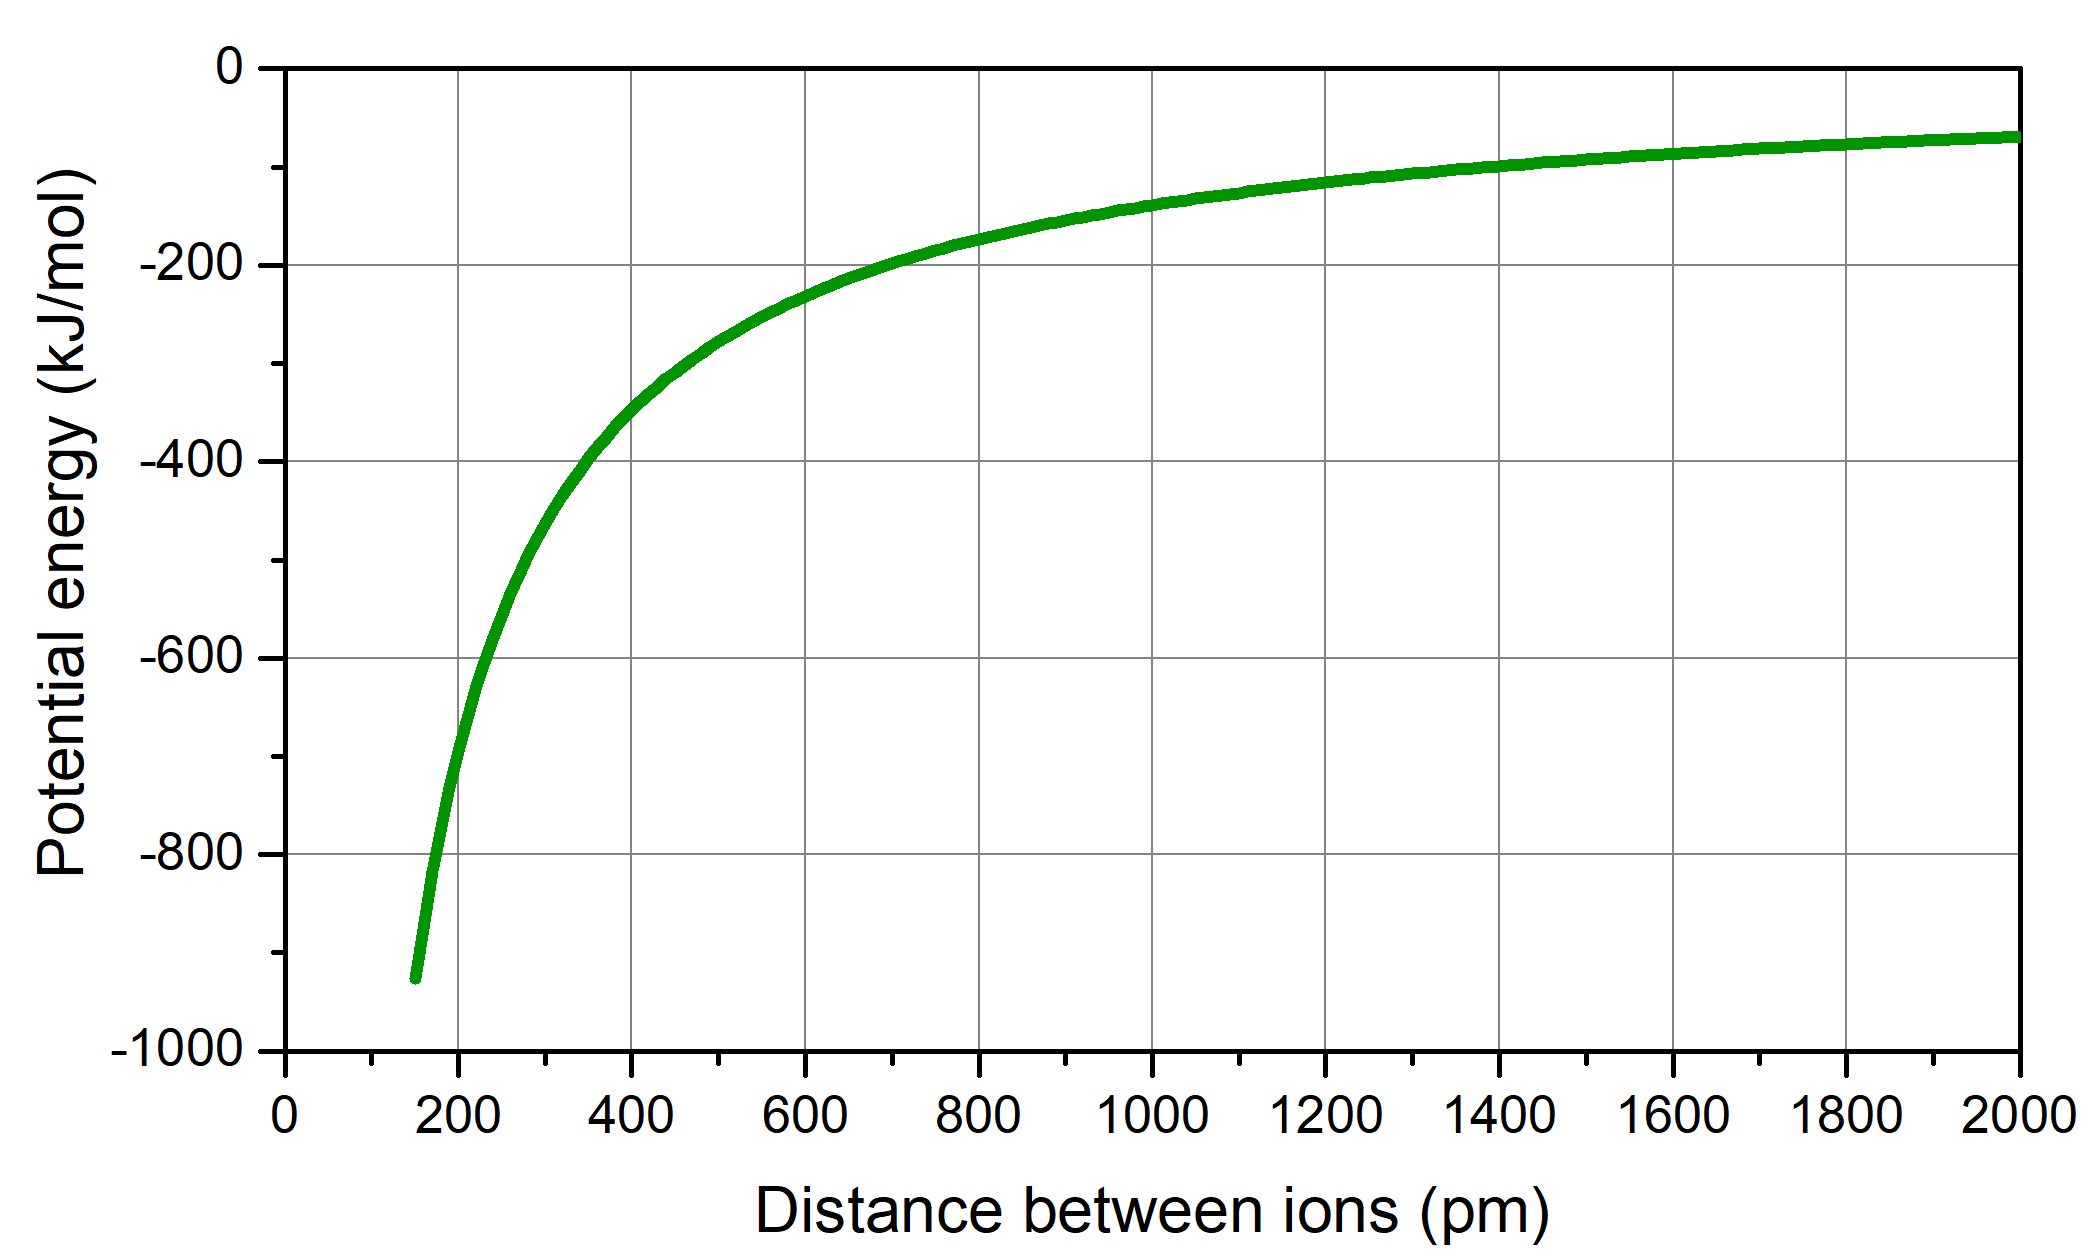
In your notebook, draw a graph showing the relationship between potential energy and distance between a sodium ion and a chloride ion. Make the vertical axis potential energy and the horizontal axis distance. Describe the graph in words.
Draw and write in your notebook. Then left-click here for an explanation
The potential energy calculated using Coulomb’s law is close to zero when the two ions are very far apart. The curve goes down (potential energy is more negative) as the two ions get closer to each other. Your curve should look similar to the figure below.
Activity: Evaluating and Modifying a Model
The Coulomb’s law equation and the graph you just drew constitute a mathematical model for the behavior of a sodium ion and a chloride ion. Think about this model and the idea that atomic-scale structures are most stable when energy is lowest. Based on the model, determine the distance between a sodium ion and a chloride ion that gives greatest stability. Does this distance make sense? Why or why not?
If not, how could the Coulomb’s-law model be modified to improve its agreement with experimental observations?
Think. Write in your notebook. Then left-click here for an explanation
According to the graph, a sodium ion and a chloride ion would be most stable if the distance between them was zero, because that’s where the potential energy is lowest. However, a crystal of NaCl does not have zero volume, which it would necessarily be if the distance between ions making up the crystal were zero. The zero-distance prediction does not make sense.
The model works partially—the ions do attract each other—but it is not completely accurate because Coulomb’s law applies to point charges, that is, charges concentrated at a single point. Thus, the charges Coulomb’s law refers to occupy zero volume and could approach so that the distance between them is zero.
The model needs to be modified to take into account of the fact that ions like sodium and chloride are not point charges. Each ion has a net charge because it has lost or gained one electron, but, in each ion there are lots of electrons that were not lost or gained and there is a positively charged atomic nucleus.
When the electrons of one ion come close to the electrons of the other ion, the like-charged electrons repel. This is also a consequence of Coulomb’s law, but much more complicated than two point charges. The repulsion of the electrons is shown by the red curve in the figure below. When the repulsion (red curve) is added to the attraction between the ions (green curve), the result is the blue curve, which passes through a minimum.
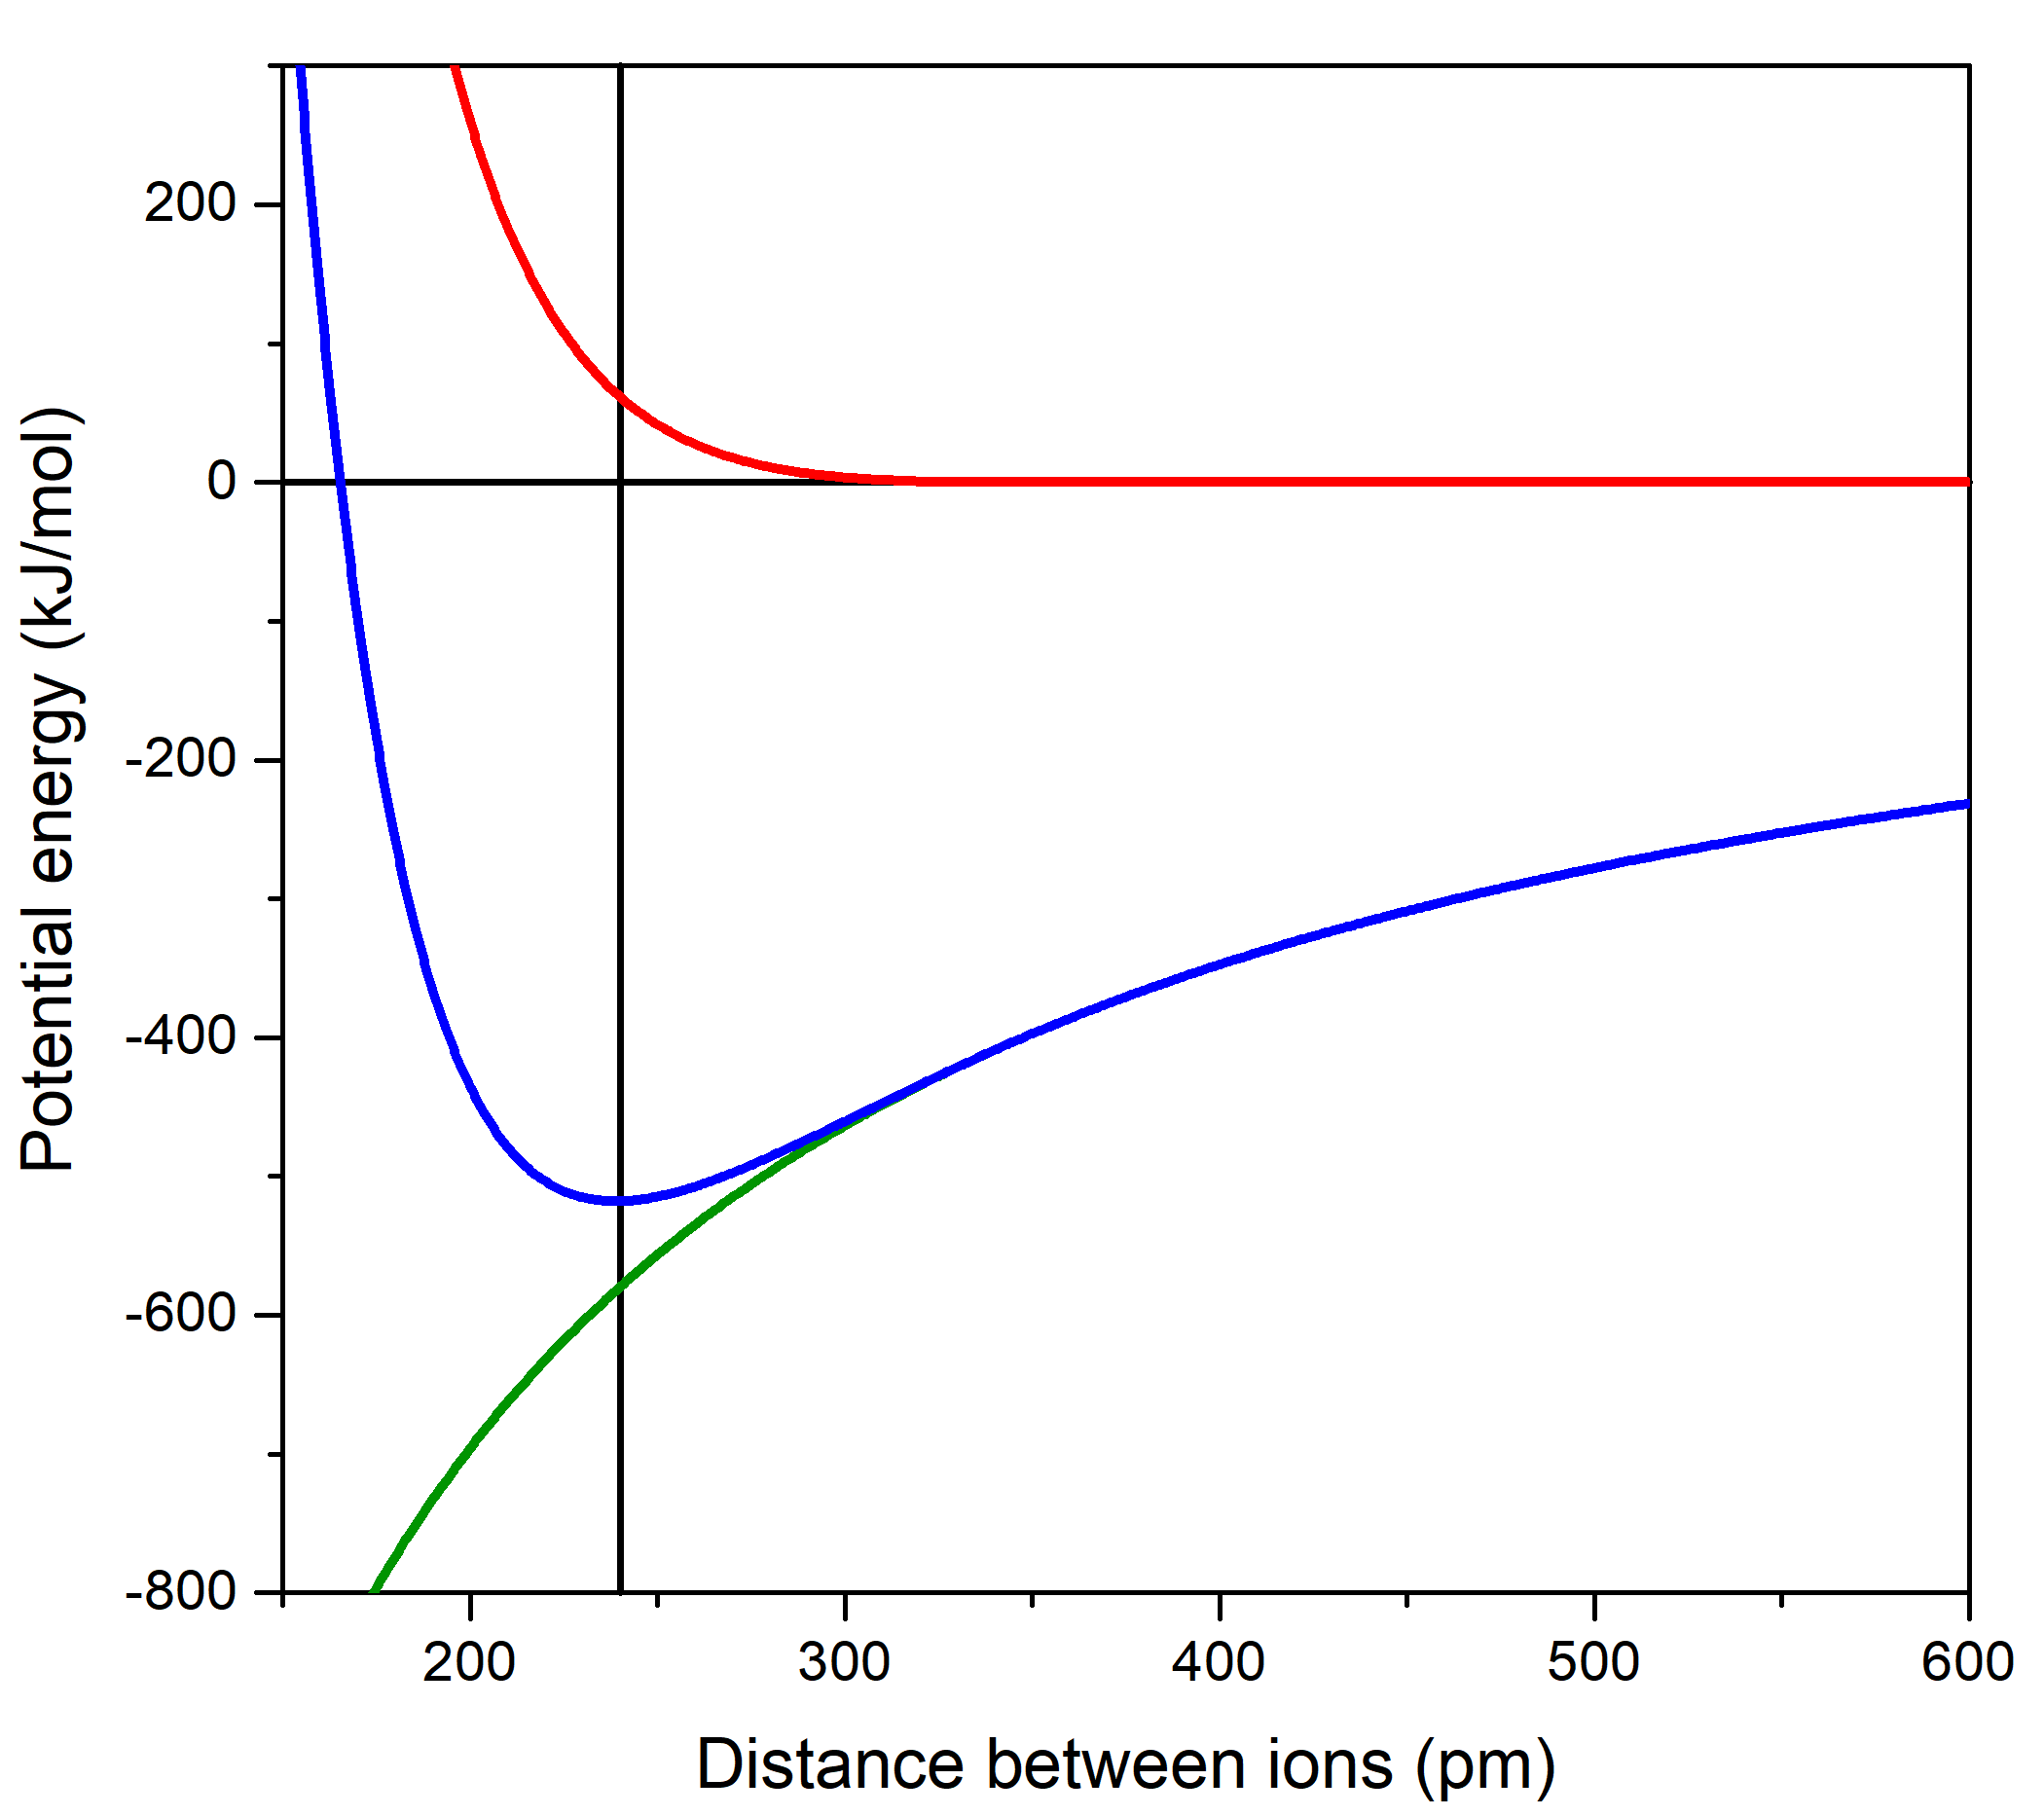
At the atomic level, particles are most stable when energy is minimum. This happens for a sodium ion and a chloride ion when the ions are 240 pm apart (lowest point in the blue curve in the above Activity). Curves like this can be used to describe attractive forces between atoms, molecules, or ions. Particles attract each other so their potential energy decreases as they get closer, but eventually there are repulsive forces that prevent them from being in the same place at the same time. The balance of these forces results in a curve with a minimum at some distance of separation. The depth of the minimum indicates how strongly the particles attract.
Please use this form to report any inconsistencies, errors, or other things you would like to change about this page. We appreciate your comments. 🙂 (Note that we cannot answer questions via the google form. If you have a question, please post it on Piazza.)
