
D34.5 pH and pOH
The concentrations of H3O+ and OH– in a solution are important for the solution’s acid-base properties and often affect the chemical behaviors of other solutes. A solution is neutral if its [H3O+] = [OH–]; acidic if its [H3O+] > [OH–]; and basic if its [H3O+] < [OH–].
Similar to pKa and pKb, the pH of a solution is:
The reason for dividing by the units “mol/L” (i.e. M) is that [H3O+] has units of mol/L and taking the logarithm of a unit makes no sense. From here on we will assume that you are aware that only the numeric value of a concentration (or other quantity) needs to be used as the argument of a logarithm and we will not explicitly divide by the units.
If the pH value of a solution is known, the concentration of hydronium ions in that solution can be calculated:
Here we assume that you know that units are required for the concentration obtained from this equation and the units are mol/L.
The hydroxide ion concentration may be similarly expressed as pOH:
Finally, the relation between pH and pOH can be derived from the Kw expression:
At 25 °C:
Therefore, at this temperature:
| Classification | Relative Ion Concentrations | pH at 25 °C |
|---|---|---|
| acidic | [H3O+] > [OH−] | < 7.0 |
| neutral | [H3O+] = [OH−] | 7.0 |
| basic | [H3O+] < [OH−] | > 7.0 |
Because Kw, like any other equilibrium constant, is temperature dependent, the correlations between pH values and the acidic/neutral/basic adjectives varies at different temperatures. For example, Kw at 80 °C is 2.5 × 10⁻¹³ M, which corresponds to pH and pOH values of:
pOH = -log[OH–] = -log(5.0 × 10⁻⁷) = 6.3
At this temperature, neutral solutions have pH = pOH = 6.3, acidic solutions have pH < 6.3 and pOH > 6.3, and basic solutions have pH > 6.3 and pOH < 6.3. This distinction can be important when studying certain processes that occur at temperatures other than 25 °C, such as acid-base reactions in the human body where temperatures are typically 37 °C.
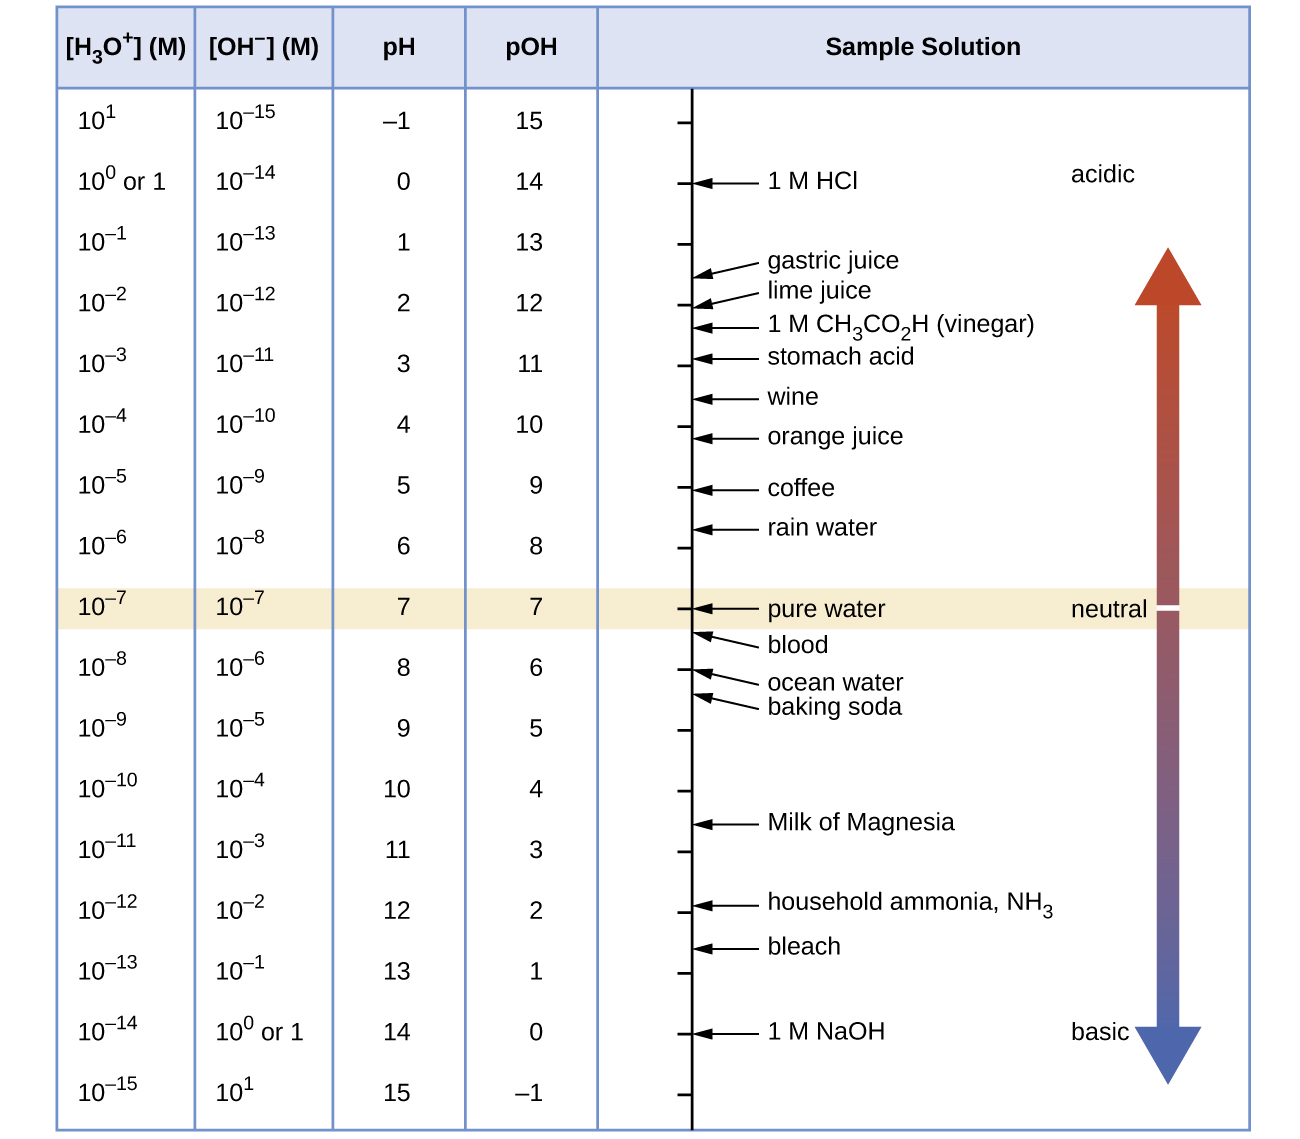
Unless otherwise noted, references to pH values are presumed to be those at 25 °C. The table below shows the relationships among [H3O+], [OH−], pH, and pOH, and gives these values for some common substances.
Activity: pH and Relative Strengths of Acids 1
Experiments show that the pH of a 0.010 M HCN aqueous solution is higher than the pH of a 0.010 M CH3COOH aqueous solution. Based on this observation, what can you deduce about the relative acidity of HCN (prussic acid) and CH3COOH (acetic acid)? Explain your answer.
Write in your notebook, then left-click here for an explanation.
The pH is lower for acetic acid. Based on this observation, acetic acid is a stronger acid than HCN.
The concentrations of the two acids are the same. Stronger acids are better H+ donors than weaker acids, so the same concentration of a stronger acid gives a greater concentration of H3O+, leading to a lower pH value.
Exercise: pH of Aqueous Solutions
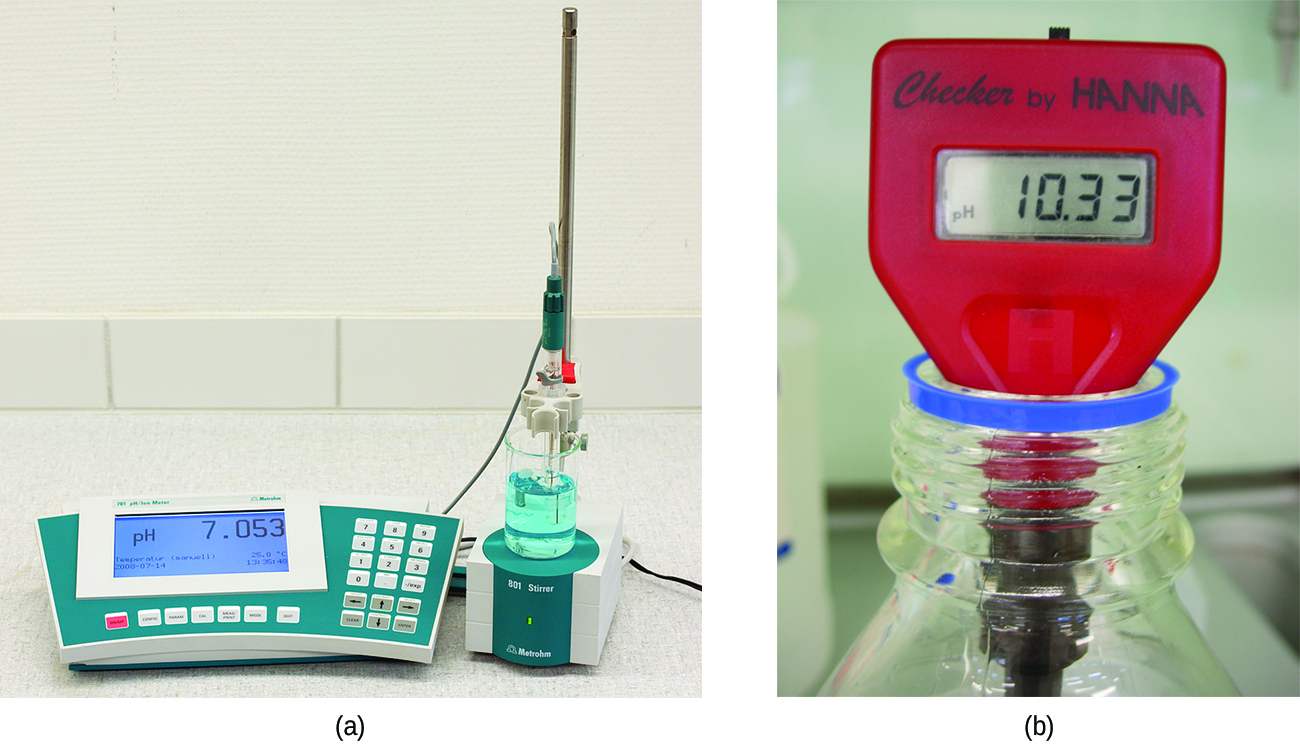
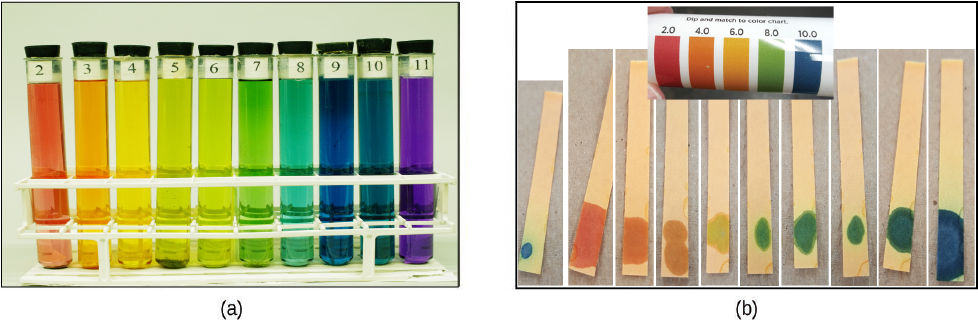
The acidity of a solution is typically determined by measuring its pH. The pOH of a solution is not usually measured, but it is easily calculated from an experimentally determined pH value. The pH of a solution can be directly measured using a pH meter or visually estimated using colored indicators.
Activity: Determining Ka
Activity: Using Ka to Calculate Concentrations
Kw and Ka
In both activities above, we stated that it is OK to approximate the initial concentration of H3O+ ([H3O+]0) as 0. However, regardless of whether this approximation is valid or not, which hinges on the significant figures involved in the calculations, the water autoionization equilibrium is always present in these solutions.
Activity: pH and Relative Strengths of Acids 2
In the “Exercise: pH of Aqueous Solutions” (part A) and “Activity: Using Ka to Calculate Concentrations” above, you calculated the pH of a 0.0012-M HCl solution (stomach acid) and a 0.534-M HCOOH (formic acid) solution.
HCl (hydrochloric acid) has Ka = 1.2 × 10⁶ while HCOOH (formic acid) has Ka = 1.8 × 10⁻⁴. Discuss the pH values you have calculated in relation to the relative acidity of these two acids.
Write in your notebook, then left-click here for comparison.
Comparing the Ka values, we can see that HCl (a strong acid) is has significantly stronger acidity than HCOOH (a weak acid).
However, the pH of a solution, while related to the Ka value, also depends on the concentration of the acid present in that solution. This is why the less concentrated 0.0012-M HCl solution (containing the stronger acid) has a higher pH of 2.92 compared to the more concentrated 0.534-M HCOOH solution (containing the weaker acid), which has a pH of 2.01.
Therefore, if we are to gauge the relative acidity of two acids by comparing pH values, we must first make sure the solutions have the same concentrations.
The percent dissociation of a weak acid is another measure of the strength of an acid, HA:
A stronger acid, with a larger Ka, has higher percent dissociation than a weaker acid (for the same concentration). The percent dissociation for a solution of a weak acid is concentration dependent: it increases with decreasing acid concentration.
Exercise: Percent dissociation
Please use this form to report any inconsistencies, errors, or other things you would like to change about this page. We appreciate your comments. 🙂 (Note that we cannot answer questions via the google form. If you have a question, please post it on Piazza.)
