4 Overview of Global Climates
First, some definitions. Weather is what we experience day to day. It is the short-term behavior of the atmosphere, with a significant amount of unpredictability even with modern weather forecasting methods. Climate is the average or expected behavior of the atmosphere in a specific location on Earth, over the long-term. Or in other words, “climate is what we expect, weather is what we get.”
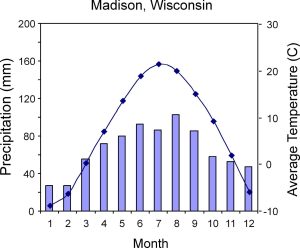
In this chapter, we will take a brief look at the basic types of climates experienced in major parts of the world. Each climate will be characterized by a typical climograph, a graph that shows average precipitation and temperature for each month of the year on the same plot. Here is a climograph for Madison, Wisconsin. The points connected by a line represent average temperature by month, while the bar graphs represent average precipitation by month. The months are labeled by numbers, from 1 = January to 12 = December.
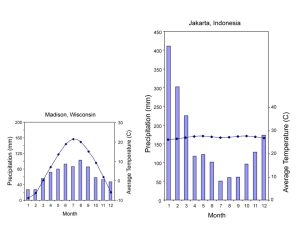
Climographs vary widely across the Earth. Compare the climographs for Madison and Jakarta, Indonesia, in the tropics. Rainfall in Jakarta greatly exceeds that of Madison for several months of the year, sometimes by five times or more. At the same time, temperature in Jakarta is high and varies little through the year, lacking the seasonal variation of temperature that you are well aware of after a winter here.
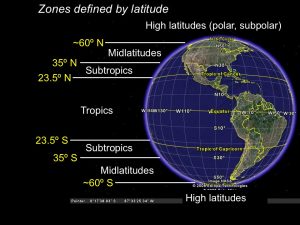
It may be helpful at this point to review the global zones defined by latitude that were covered in the first lecture (Tropics, Subtropics, Midlatitutes, and High Latitudes).
At this point, take a look at this animation showing air temperature through the year, for the entire Earth surface. Note that high temperatures remain relatively constant in most parts of the Tropics. This is even true for high mountains in the Tropics. Then go to this animation of global precipitation rate. Note the very distinct (dark blue) band of precipitation that runs through most of the Tropics, of near the Equator but also shifting north and south of it. Notice that few other parts of the Earth surface get anything like the high precipitation of the Tropics.
Wet Tropical Climates
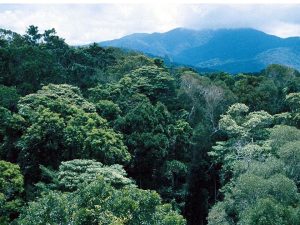
Jakarta, Indonesia, which we looked at earlier (see climograph, above), is a good example of this group of climates. They are characterized by relatively high temperature that varies little through the year, and high total rainfall. Precipitation is usually higher in one season than in others (January through March in Jakarta), but there is no real dry season. Tropical forest is the characteristic vegetation in these climates. However, the forest has been converted to agriculture or cities in some areas and there are also major tropical wetlands.
Monsoon Climates
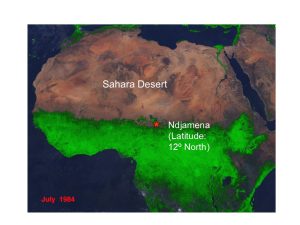
Now let’s move a little farther from the Equator. Ndjamena, the capital of the country of Chad, is a good case study of monsoon climates. In the image below, green color represents green vegetation, based on satellite images. Ndjamena is located almost exactly at the transition from green to the tan color of the deserts to the north, but if we looked at this through the year, we’d see the green moving north in June through August (northern hemisphere summer) and back south again in northern hemisphere winter. This change in vegetation greenness through the year results from seasonal variation in precipitation.
The climograph for Ndjamena shows how extreme the variation in precipitation through the year is in this location. There is little or no precipitation from November through March. Then precipitation rises dramatically to a peak in July and August. This is the typical pattern of a monsoon climate, which have precipitation peaks in high-sun season (the local summer). We refer to “high-sun season” rather than “summer” to avoid confusion when discussing monsoon climates south of the Equator; the high-sun season there is in November through February.
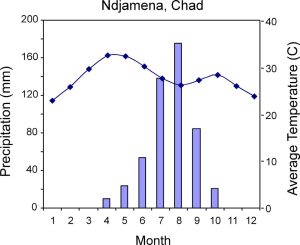
There is also an interesting pattern of temperature change in Ndjamena. Temperature is a bit lower in the low-sun months of January and December, though still fairly warm as we might expect for a location at this latitude. It then rises in April and May but then drops a little from May through October, during the season of high rainfall. This can be explained by greater cloud cover in the rainy season, keeping surface temperatures lower.
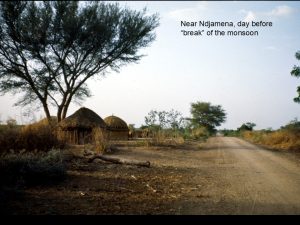
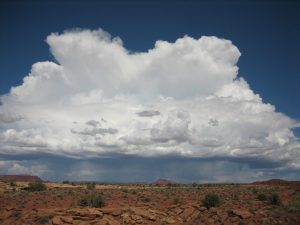
In monsoon climates, the onset of heavy rainfall can be relatively abrupt, sometimes referred to as the “monsoon break.” I took the two photos below in northern Cameroon, near Ndjamena. The first shows the dry, dusty environment just before the monsoon break, and the second shows rainy weather after the break.

Monsoon climates in general occur mainly in the transition from tropics to subtropics, although some monsoon systems reach far north or south into the midlatitudes. Major monsoons are labeled on this map:
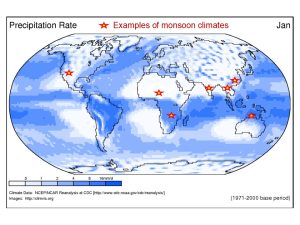
To see these monsoons in action look again at this animation of global precipitation rate. You will see dark blue indicating intense rainfall moving north or south into each of these monsoon regions in the high-sun season.
In the US, the Southwestern or Mexican Monsoon is an important source of moisture to the deserts and mountain ranges of Arizona, New Mexico, and adjacent states in mid- to late summer.
Subtropical Desert Climates
If we were to travel north from Ndjamena (not an easy or safe journey at present!) we might eventually reach a desert outpost called Kufra. Here is the climograph for Kufra. Does it look like we left out the bars showing precipitation? In fact they are too small to be easily visible. There is little or no rain at Kufra on average, through the year.
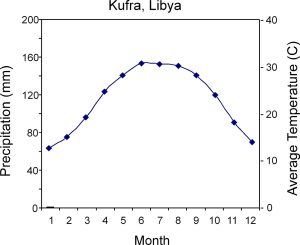
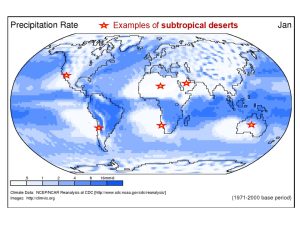
Kufra is an extreme example of the climates found in the world’s great subtropical deserts. These include the Sahara and Kalahari deserts in Africa and those of Arabia and central Australia. All are within or centered on the subtropics (23.5° N or S latitude to 35° N or S). Later in this course, we will discuss how the global circulation of the atmosphere creates deserts in these latitudes, along with similar explanations for the monsoons, and for Mediterranean climates, which we’ll discuss next. For now it’s just important to understand that these climates include some of the driest and hottest places on Earth. Note the significant seasonal range of temperature as well, compared to the wet tropical climates. The map below shows the locations of major subtropical deserts worldwide. View the animation of global precipitation rate, to see how these locations lack blue color (precipitation) through most or all of the year.
Mediterranean Climates
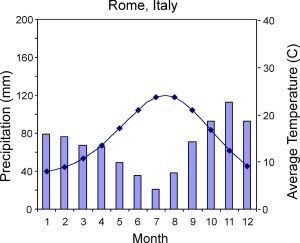
If you have spent any time in Italy, Greece, southern France, or Spain, you may have noticed that summers in those countries around the Mediterranean Sea are very dry. In contrast, winter rains are common there. These places share the distinctive Mediterranean climate, represented here by the climograph for Rome, Italy. The key characteristic of Mediterranean climates is that rainfall is mainly in the low-sun season, the opposite of what we saw with monsoon climates. In Rome, for example, months with higher rainfall are from October through April, when temperatures are lower, while there is much less rain in June through August while the sun is high and temperatures are as well.
Regions with Mediterranean climates often have a long history of human habitation, such as this pre-Roman settlement site in southern France. This photo also reveals the typical vegetation of Mediterranean climates, dominated by shrubs and small trees with small waxy leaves that limit water loss in the dry summers. This is the native habitat of olive trees and herbs such as lavendar, thyme, and rosemary.


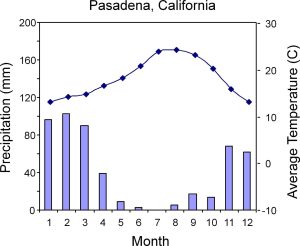
If you’ve spent much time in southern California, Mediterranean climates may sound familiar. In fact, California as far north as the Bay Area has typical Mediterranean climates. The climograph for Pasadena, California, has an even more pronounced dry summer than the one for Rome.
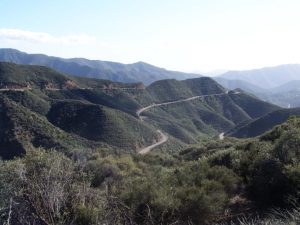
The vegetation of Mediterranean climates in California is often chaparral, a shrub-dominated plant community. Farther north on the U.S. west coast, there is a little more rain in summer, and there are forests rather than chaparral. However, even as far north as Portland, Oregon, most rain falls in the low-sun season and summers are quite dry.
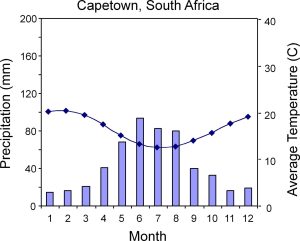
One final note on Mediterranean climates: Remember that the low-sun seasons south of the Equator are in the same months as high-sun seasons north of the Equator. For example, in Cape Town, South Africa, the low-sun season is in May through August, and that is when most rain falls. The sun is high and temperatures are warm through October through March, and those months are quite dry. So Cape Town has a typical Mediterranean climate. So do parts of Chile and Australia, which would have climographs similar to Cape Town.
Midlatitude Climates
Climates of the Midlatitudes vary widely, compared to the Mediterranean and monsoon climates we’ve just discussed. Often we need to look in detail at wind patterns and location relative to oceans and mountain ranges to explain a particular Midlatitude climate. We’ll look briefly at three examples. First, Charlotte, North Carolina, which is relatively warm and receives rainfall throughout the year, with little seasonal variation. Charlotte is in the southern part of the Midlatitudes, explaining its warm temperatures. Winds from the Gulf of Mexico and the Atlantic Ocean can bring moist air and precipitation to Charlotte throughout the year.
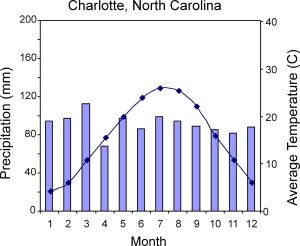 In contrast, the climograph for Madison, Wisconsin, shows a distinct summer peak of precipitation, and a large range of temperature from summer to winter (as you may have noticed).

These features climate of Madison can be related to the city’s location and seasonal wind patterns. Madison is farther north than Charlotte, and much farther from the oceans. This makes the temperature in Madison cooler on average with a larger range through the year. This location also means that a specific wind pattern is needed for moisture and rainfall to reach Madison, and this happens mainly in summer. The map below uses arrows to indicate the average direction and strength of winds in July over North America (longer arrows mean stronger wind flow). The map shows that in summer, winds often flow north toward Madison, bringing moisture from the Gulf of Mexico. At other times of year, this wind pattern is not as common and precipitation is less.
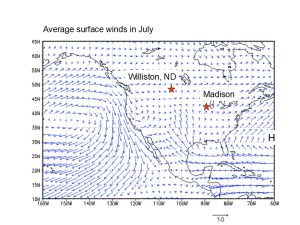
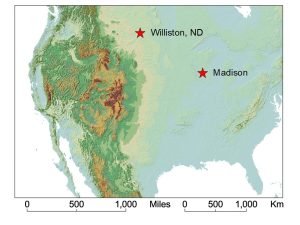
Another location marked on the map above is Williston, North Dakota. Williston also has a Midlatitude climate, but one strongly affected by its location relative to wind flow patterns and mountain ranges. Note that the winds that bring moisture to Madison in summer do not really reach Williston. While there is wind flow from the Pacific Ocean eastward toward Williston, it has to cross the Rocky Mountains, which cause it to lose most of its moisture. We can say that Williston is in the rain shadow of the Rockies. The map below shows topography of part of North America to illustrate this point.
With that background in mind, it should be easy to understand why the climograph for Williston shows much less precipitation than in Madison, though still with a summer peak. It also shows a very large range of temperature from hot summers to bitter cold winters.
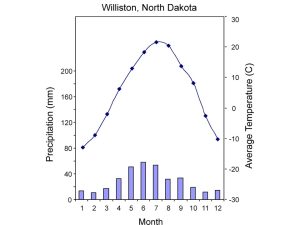
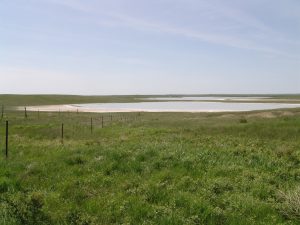
The natural environment in Williston reflects that climate, and is distinctly different from what we see in and around Madison. Williston is in a dry grassland, with salt lakes that dry out in many years, and more cattle than people.

High Latitude Climates
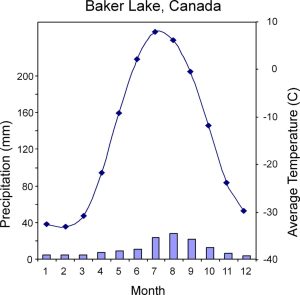
Climates of high latitudes are also quite varied depending on their setting relative to oceans and mountains and how far north or south they are. Here is one example, from a weather station in far northern Canada. This climograph shows the characteristics shared by most high latitude climates in inland areas: Very low temperatures with a large annual range, and relatively low precipitation.
