1 Stream networks and stream flow
Hydrology is the study of water flow and storage on the Earth surface and below it. The flows studied by hydrologists are part of the global water cycle, which can be portrayed in many ways. Here is one example; note that it includes water transported through the atmosphere as water vapor and water movement to and from the atmosphere through evaporation and precipitation. We’ll look at those parts of the cycle later in the course.

The kind of water flow over the Earth surface that most people would think of first involves rivers and smaller streams. We’ll start this chapter with some basics on streams and streamflow, then move upstream to look at where the water and sediment carried by streams comes from.

A stream channel is almost always part of a network, with flow in smaller channels converging into larger ones. From a short-term point of view, we can think of stream channel locations determined by topography–water runs downhill into valleys, forming channels that follow the valleys, moving down the sloping valley floors. Over the longer term, stream channels create valleys by eroding rock and sediment, including valleys as dramatic as the Grand Canyon.
The area contributing water to a stream network is a drainage basin. The term “watershed” is often used in the US to mean the same thing as a drainage basin, but its original meaning is the boundary between two drainage basins (a ridge that “sheds water” to basins on either side). To avoid confusion, we won’t use the term watershed here. Smaller drainage basins are nested inside larger ones; the largest basins drain directly to the ocean or to an inland lake or sink (for example, the Volga, a major river in Russia, drains into the Caspian Sea, which is actually a large salt lake not connected to the world’s oceans).

One thing we are often interested in is how much water comes out of a given drainage basin at different points in time. This can be measured at the basin outlet, where the main stem of the stream network leaves the basin (“main stem” means the largest stream channel that other parts of the network flow into, like the main stem or trunk of a tree). We are also often interested in how much sediment (eroded soil and rock) and dissolved material comes out of the basin. We’ll look at water first.
The term stream discharge refers to the volume of water flowing past a specific point along a stream channel in a specific period of time. For example, in the US, stream discharge is often measured in cubic feet per second. A discharge of 100,000 cubic feet per second means 100,000 cubic feet of water pass by a specific point along the stream channel each second. 100,000 cubic feet per second (cfs) is a good-sized flood on a big river like the Missouri. In the rest of the world, the typical units for stream discharge are cubic meters per second (cms or m3sec-1). The symbol for stream discharge is always capital Q.
The diagram below shows how stream discharge (Q) is measured. Basically, we find a point along a stream, measure the width and average depth to get the cross-section of flowing water, and multiply that by the average velocity of the flowing water, also measured.

In practice, technicians measuring stream discharge do so by dividing the flowing water into a large number of vertical “slices” and measuring width, depth, and average velocity for each “slice,” calculating Q for each “slice”, then summing up all the Q values to get the total for the stream channel. There are also thousands of stream gages (spelling is correct, gage not gauge!) across the US where automated measurements of depth are made continuously. These are mostly operated by the US Geological Survey (USGS). By studying how depth changes with discharge at that location, technicians can calculate continuous values for discharge, which are available for most stream gages at: https://maps.waterdata.usgs.gov/mapper/index.html.

Using data from an automated stream gage, we can create a plot called a hydrograph. A hydrograph is a plot of discharge against time. Time in this case can be minutes, days, or years, depending on the purpose of the hydrograph. There is a great deal of useful information in hydrographs, which can be created at the USGS website linked above.

What creates the many small and large peaks on a hydrograph? All of these are floods, defined as a distinct hydrograph peak. Most are not particularly large floods, but some are. What does the variation between low discharge and flood peaks look like? Let’s look at a somewhat extreme case, a small stream in western Nebraska called Dry Creek that is in fact dry most of the time (we could call Dry Creek an ephemeral stream for this reason.) The photos below show four views, upstream and downstream from a bridge on Dry Creek, illustrating how it changes between its typical dry condition and a peak of discharge, or flood.


What you see in the images of Dry Creek is the passage of one peak in the stream’s hydrograph. Many streams don’t become completely dry during floods, so the hydrograph doesn’t go all the way to zero, but it drops to a low level and then flattens out or sometimes rises or falls slowly without getting anywhere close to the flood peaks.
The example of Dry Creek illustrates how many floods on small streams are caused by a single large rainstorm. Floods on larger rivers like the Mississippi more often originate from extended periods of wet weather. Streams of all sizes have floods related to the spring melting of snow, unless their drainage basins are in climates too warm for snow. The Missouri River, which flows out of the Rocky Mountains and across the Great Plains, used to experience two snowmelt floods in spring and summer each year. The “spring rise” was cause by snow melting on the Great Plains, and the “summer rise” resulted from snow melting later in the Rocky Mountains. Since the 1950s, large dams and reservoirs on the Missouri have reduced or completely eliminated these distinct floods.
But what causes stream flow to continue between floods on many streams? Here we need to look at another use of the word “discharge”. Groundwater discharge is flow of groundwater from sediment or rocks into streams. Many streams steadily gain water through groundwater discharge. Places where groundwater discharge is especially noticeable are called springs.

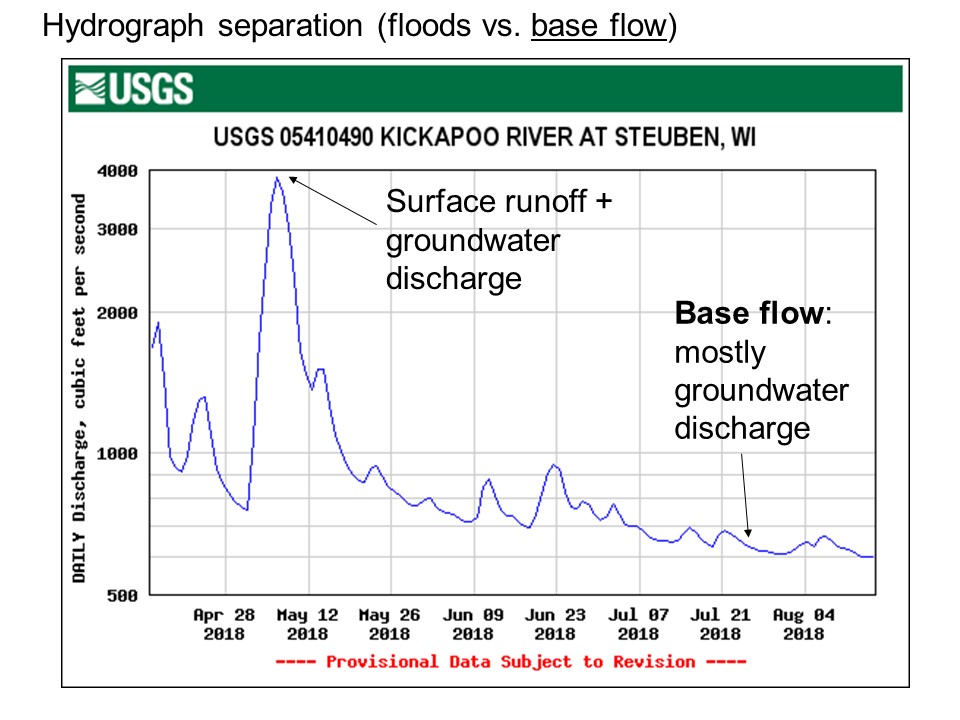
Now let’s look at a simple hydrograph from the Kickapoo River in western Wisconsin, with one large flood peak that occurred after heavy rain in April-May 2018. After the flood peak, the hydrograph drops to a relatively low level with a couple of small peaks (possibly individual rainstorms). Most of the flow when the hydrograph is at a low level is groundwater discharge. We call this flow related to groundwater base flow. During floods, surface runoff (water running over the surface because of rain or snowmelt) is added to the base flow, creating a flood peak. Identifying the amount of water flow coming from these two different sources is called hydrograph separation.
Floods can cause extensive damage to property and puts lives at risk in some cases, so there are good practical reasons for trying to estimate how often floods of a given size will occur on a specific river. This is one of the main purposes of the USGS gaging station network, and it is a complicated task. The first step is to compile a flood series, a list of either 1) the biggest flood each year at a certain point along a river (the annual flood series), or 2) all the floods that are larger than a certain threshold value at that same point along a river (the partial duration series).
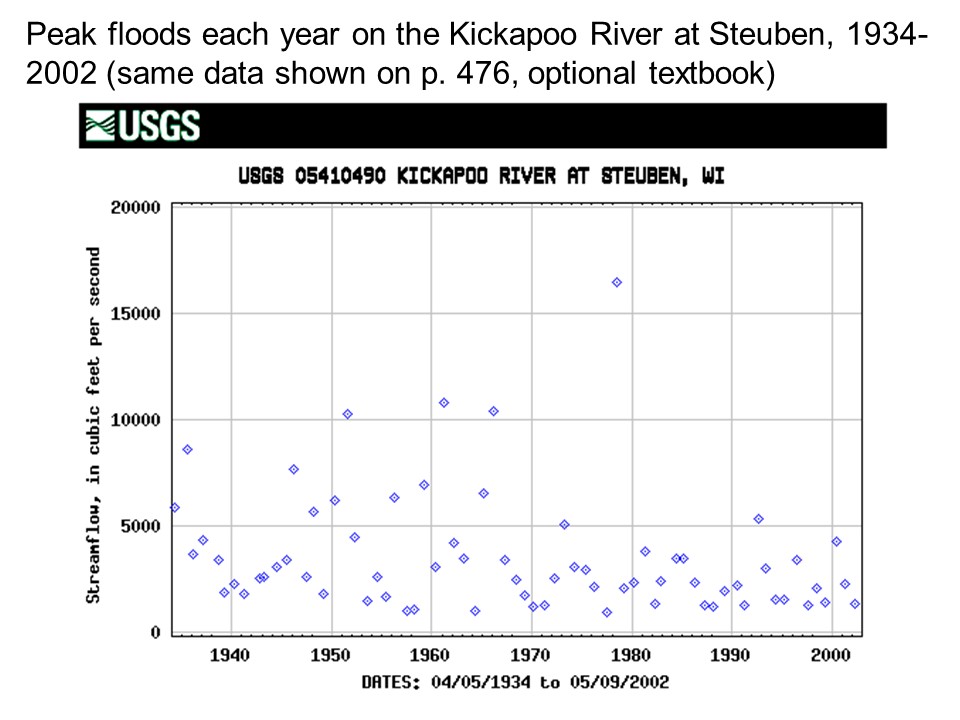
Either the annual flood series or the partial duration series is analyzed statistically to determine the probability of floods of different sizes. The results are often expressed in terms of the recurrence interval. This is the average time between floods of at least a certain given size (discharge). For example, let’s say the recurrence interval is 10 years for a flood with a discharge of 7,000 cfs at a particular location on a river. This means the average time between floods of 7,000 cfs or larger is 10 years. Think about the practical use of this: If you know it takes a flood of at least 7,000 cfs to reach as high as a park or building at that particular point along the river, you can expect that park or building to be flooded every ten years on average. In addition, 1/recurrence interval (one divided by the recurrence interval) is the probability of a flood at least that big in any given year (one in ten years will have a flood that big, on average).
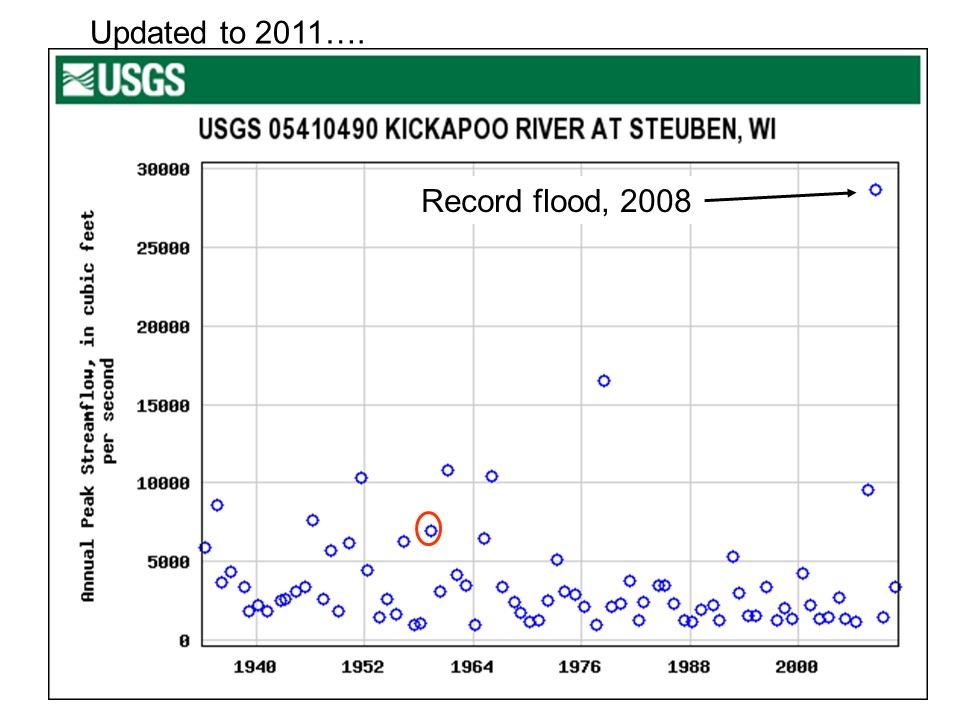
There is a common way of expressing recurrence interval that can be confusing. Instead of saying “the flood with a 10-year recurrence interval” we often say “the 10-year flood.” Keep in mind that this is a statement of probability–on average floods at least this big will occur every 10 years, but the actual time between two floods at least that big can vary widely. In fact, it is definitely possible to have two “100-year floods” two years in a row. There is another complication with recurrence intervals–they can change over time, as we collect more data. Here’s an example, from the Kickapoo River at Steuben again, starting with the annual flood series from 1934 to 2002. Now a flood with a discharge that has a recurrence interval of 10 years is marked. This is the “10-year flood” for this point on this river, based on data from 1934-2002.
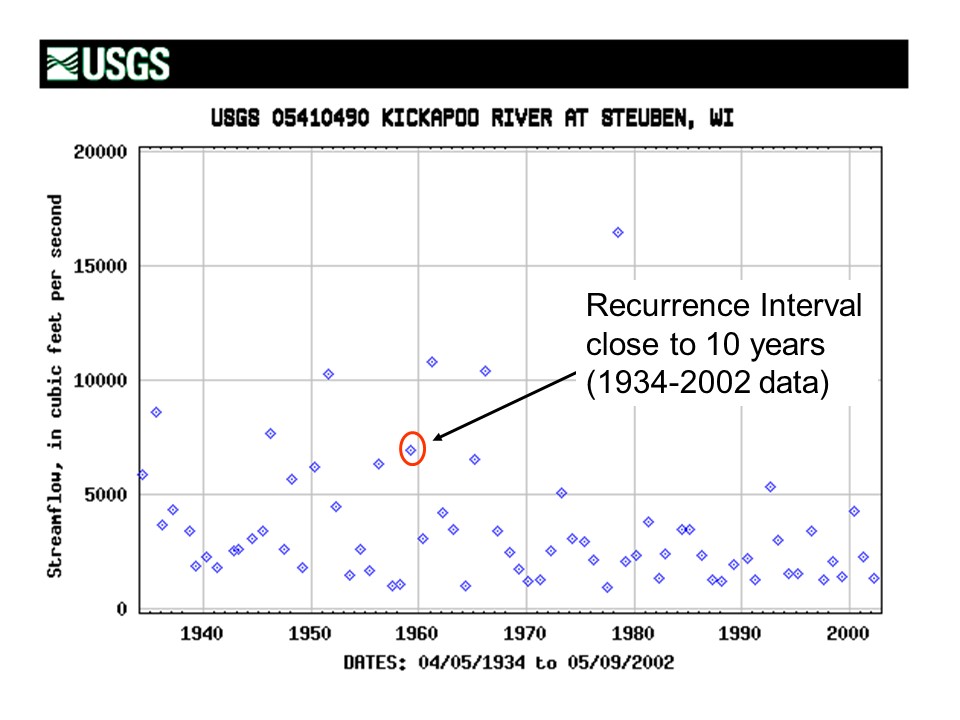
We can test this statement about the marked flood in a simplified way. We’ll look at the time between each pair of floods that size or larger and take the average. It works out to a little less than 10 years (close enough). Note something interesting about the flood series, though: As of 2002 there had not been a flood at least that big for 24 years.
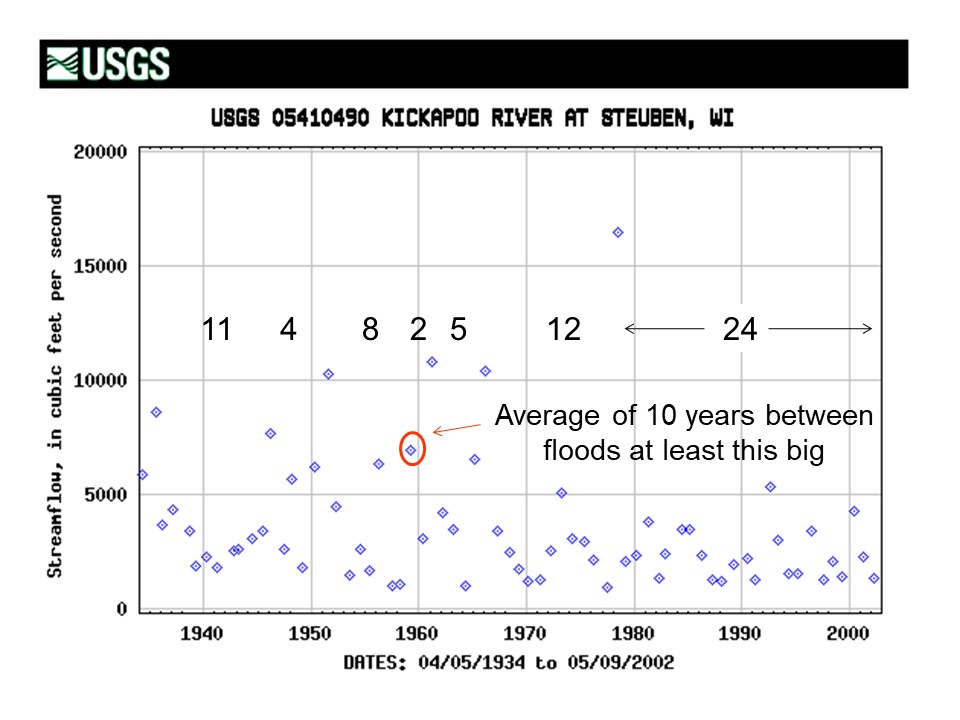
Now let’s add more recent data. Here’s the same plot updated to 2011. It now includes the largest flood recorded up to that year at Steuben, in June 2008, following a rainstorm that caused major floods across a good part of southern Wisconsin. Another recent flood also exceeded the circled one. With these new data, the estimated recurrence interval of the circled flood is now reduced to 8.44 years (that is, floods this big can occur a little more often than previously estimated). Even beyond this kind of update, climate change also changes recurrence intervals of floods, so older estimates will be increasingly inaccurate.
Here is the start of the next story: A tale of two rivers, both in Nebraska, close to each other, but with very different hydrographs over the time period shown (1968-1988). The Dismal River has relatively consistent flow of a few hundred cubic feet per second, with minor flood peaks. Mud Creek has huge flood peaks, dropping to near zero flow between them (something like the example of Dry Creek we looked at earlier).
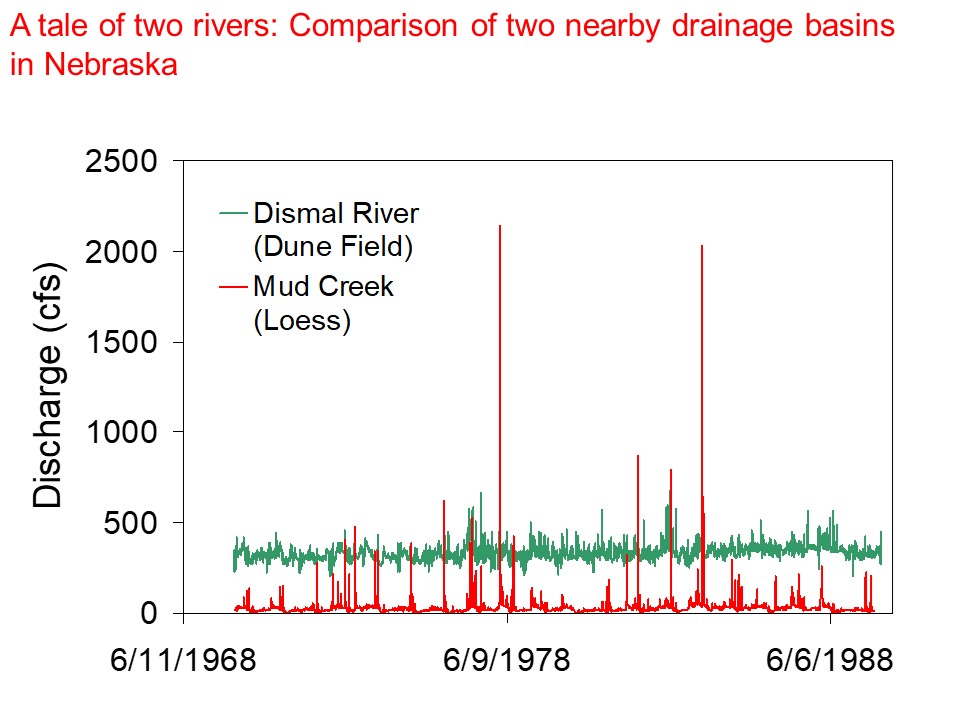
To understand why the behavior of these two nearby rivers is so different, we need to take a step back and look in more detail at what happens when rain falls on soil, and why some soils and geologic materials produce lots of runoff and large floods, while others mostly supply water to streams through groundwater discharge. We will also now be able to look at how soil is eroded, adding sediment to streams. More on this in lecture…
