
Main Body
2 Lesson 2
Welcome to Lesson 2—Feature Data: Getting Field and Citizen Observations into Desktop and Web Maps
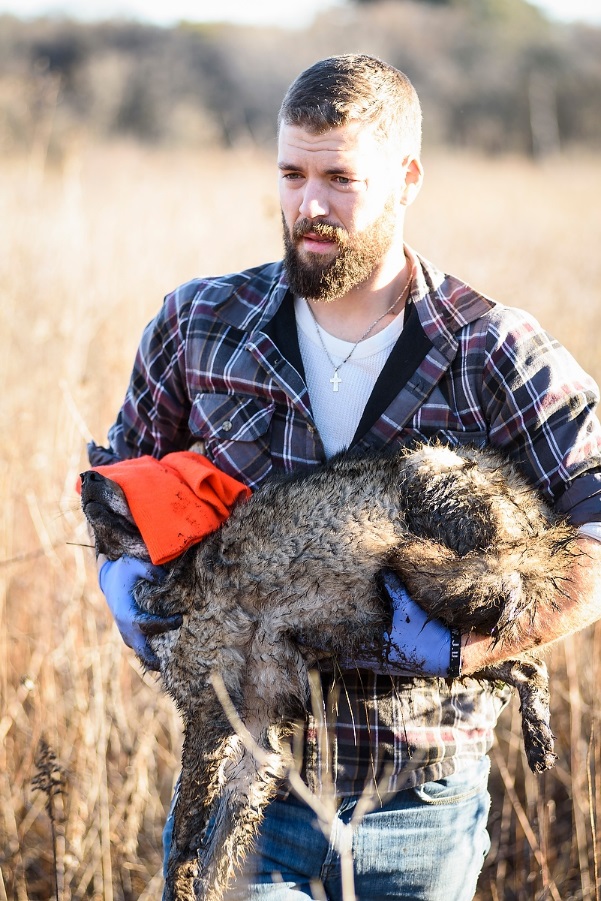
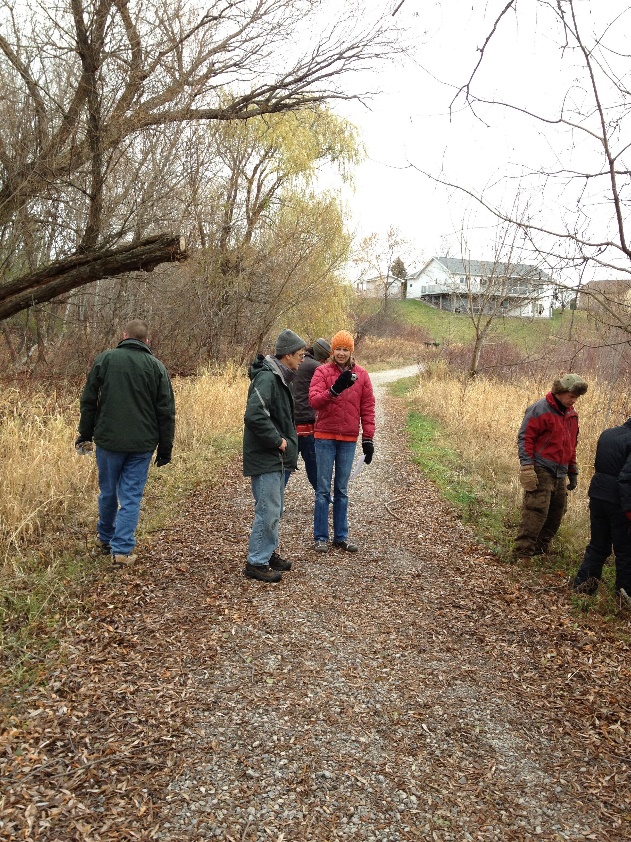
Because some problems are local in nature, we sometimes need to gather and map our own data or observations from others. Here we focus on the kind of data you might gather in the field and how to bring that into a geographic information system (GIS) workspace. These data may come from walking a trail with a global positioning system (GPS) unit, placing a radio collar on a coyote to record its locations, or having citizen scientists enter locational information.

We will also learn how to access real-time data online, and on how to map that data with web mapping tools. Finally, you’ll get a taste for sharing spatial data with live web maps through ArcGIS Online.
In this lesson, you:
- Examine feature data and considerations for collecting field observations
- Learn how to import field data to feature data in GIS
- Explore cloud-based mapping and learn how to produce and use online web maps
- Look at case studies of citizen science GIS and cloud-based maps
Lesson 2 Topics
This lesson covers three topics and takes about 50 minutes to complete. We recommend working through each topic in the order listed below.
1. Collecting Feature Data in the Field
Where does environmental data come from? Simply, we can collect observations of the environment from:
- On the ground—we’ll call these Field Observations
- Above ground (or from some distance)—referred to as Remote Sensing (more on this later)
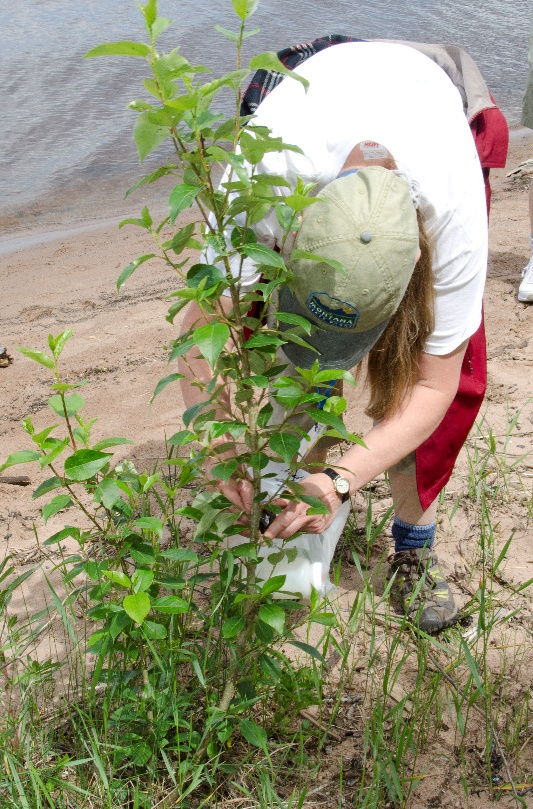
Someone or some device on the ground or at sea, recording information about specific places, captures field or place-based observations.
In this lesson, we focus on turning field observations of the earth into spatial data for a GIS.
So, How Are Field Observations Spatial Data?
Imagine the kinds of landscape or environmental data you might want to collect:
- stream gauge readings
- nocturnal lemur locations
- bicycle sharing stations
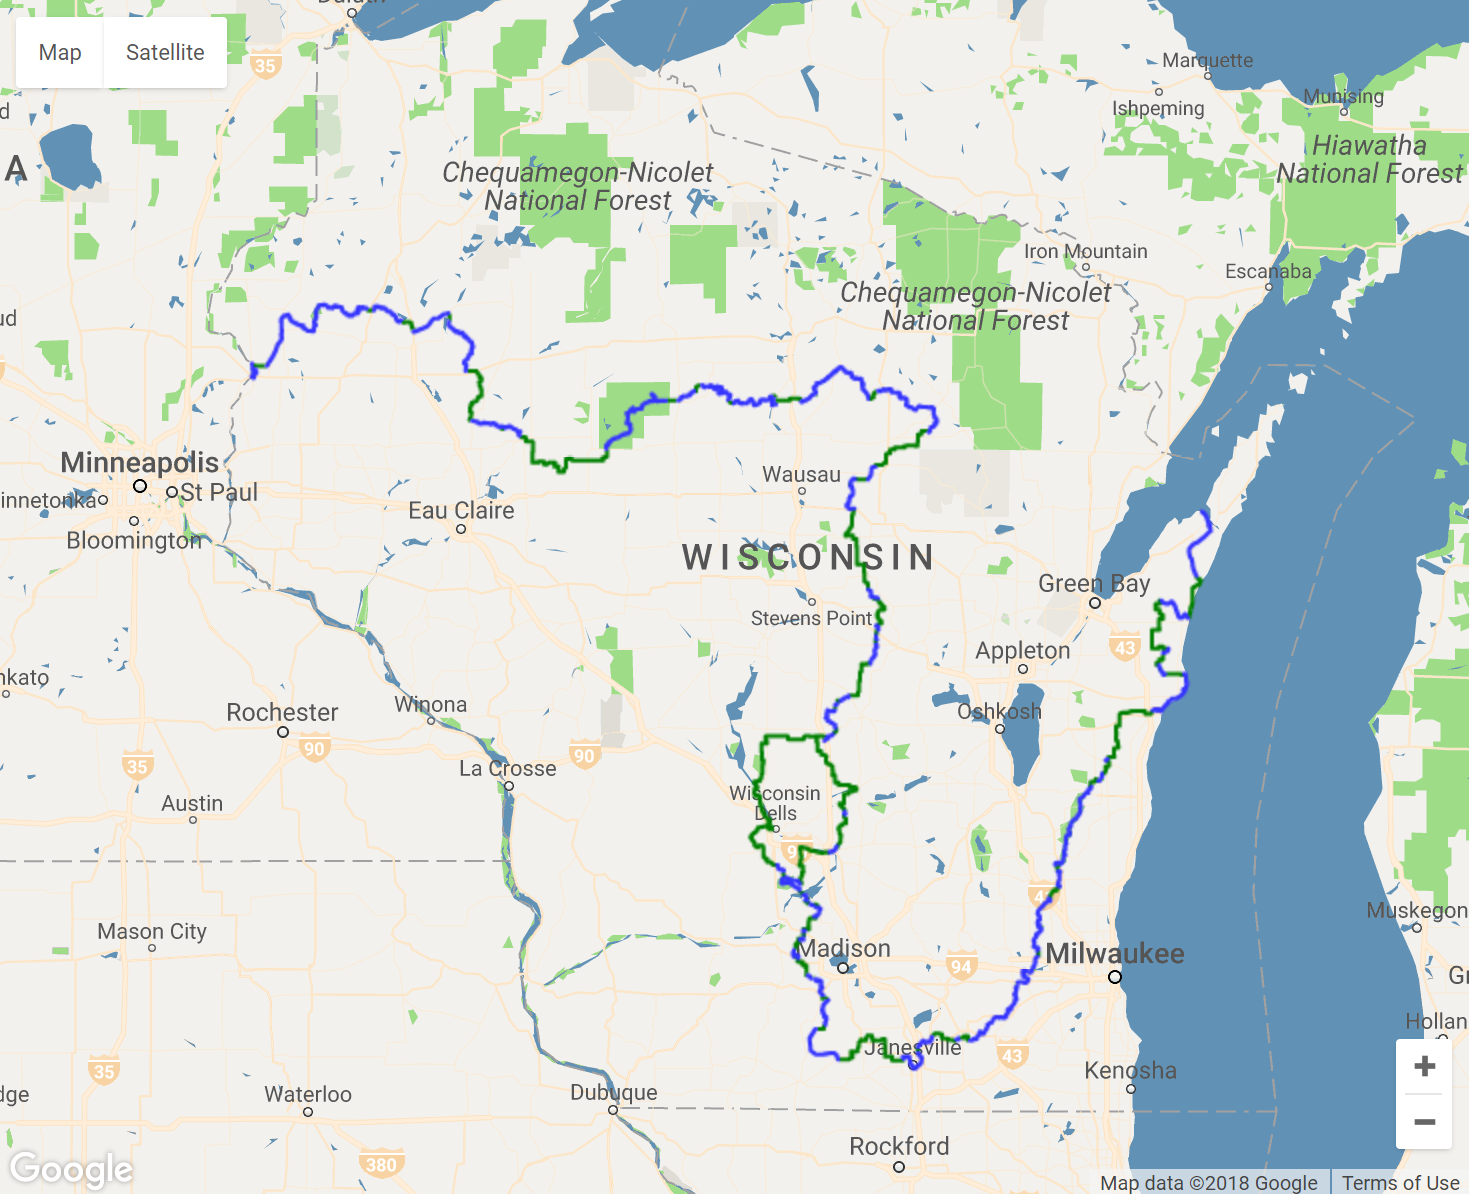
- Ice Age Trail additions
- urban community gardens
- park boundaries

Recording the boundaries of defined regions, parks, and protected areas are represented by polygons.
These represent different kinds of landscape FEATURES.
So what kind of data models are these features? Let’s see, we have . . .
- points of stations
- lines of trail routes
- polygons of park boundaries
Vector data! Feature data in GIS typically refer to vector data in point, line, or polygon format.
What is Feature Data?
Feature classes are collections of similar features, each having the same spatial representation, such as points, lines, or polygons, and a common set of attribute fields. For example, in a feature class representing streams each record would be a polyline, or multiple connected line segments, representing a single stream feature, and each would have the same fields of say, name, stream order, and class.
The four most commonly used feature classes are points, lines, polygons, and annotation (or labels).
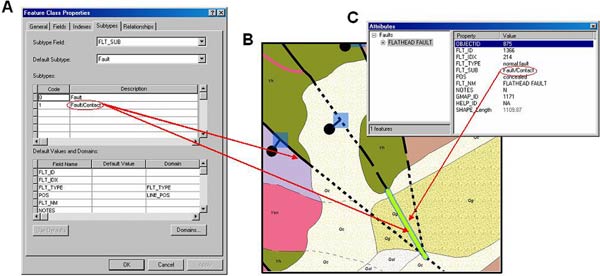
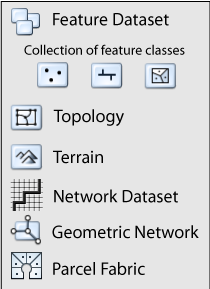
A feature dataset is a collection of related feature classes that share a common coordinate and projection system. Feature datasets are used to spatially or thematically integrate related feature classes for building topology or networks. In this case, the stream feature class might be organized with a polygon feature class of lakes and ponds.
Collecting Feature Data
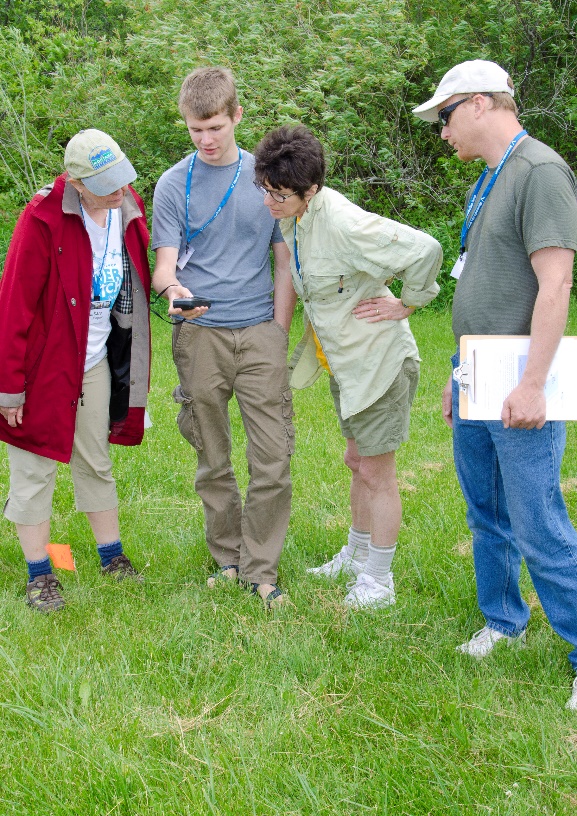
We might think of collecting field data with expensive GPS units that we take back to camp to download onto a computer. There are also a wide variety of electronic means, from smartphones to probes and drones, to record place-based phenomena in accessible and remote places. We can map data captured from these devices in a GIS. Examining your gathered field data with a map can reveal the spatial patterns that may be inherent in, for example, tree height and tree species, pH along your local stream, or the pattern of historical buildings in your community.
Today, many location-based data are also collected by tapping into the location signals of people using social media, apps, and navigation systems in their daily lives, usually without any knowledge they are sharing spatial data! Did you know when you turn on Location Services on your phone or for an app you are sharing your location to the cloud? And that crowd-sourced spatial data are real time—it uploads to the cloud or servers automatically and can be immediately available for viewing and analysis. We will look at some ways that location-based data are tapped for geospatial analyses later in this lesson.
There are also approaches for intentional citizen-collected field data, where the citizens are informed, willing, and engaged with the spatial data being collected (e.g., Christmas bird count), as opposed to harvested crowd-sourced data. We will come back to some approaches for citizen-collected field data with mobile devices shortly. First, let us work with some data collected from probes or receivers that you wish to import into GIS.
Methods of Data Gathering, Mapping, and Analysis
Before collecting spatial data in the field, evaluate the project goals, the time and equipment available, terrain, signal reception, and other factors that might influence your spatial accuracy and the usefulness of your data. Planning is essential for efficient field collection of good spatial data to address your question or goal.
Some key considerations and steps to consider before location-based fieldwork are the following:
- know what type of sensors or receivers will be used for data collection;
- determine the sampling design, including the route and frequency of recordings;
- identify the attribute data to be collected.
For example, if you are surveying birds by song along a transect, what devices will you use to record location and audio? What is your transect route? How frequently will you stop to listen and identify, and what characteristics of that observation will you record (forest type, canopy cover, bird species, human disturbance, etc.)—these are the attributes for each record in your spatial database.
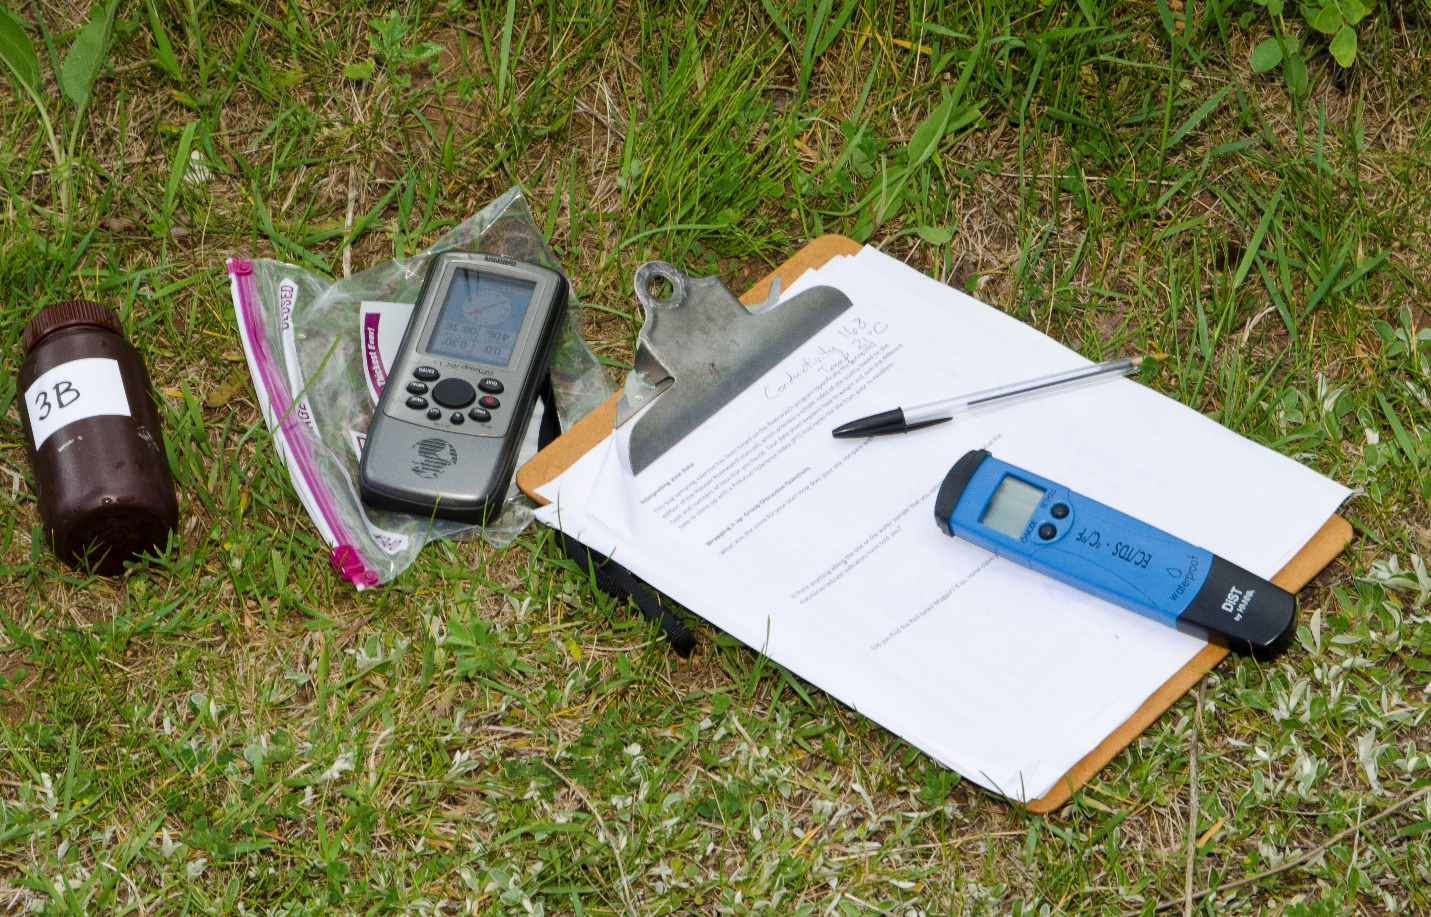
Keep in mind your field observations might come from: a pencil and clipboard at known permanent plots, GPS receivers, telemetry, drones, soil probes, energy meters, lake level sensors, smartphones, social media feeds, and many more means and devices.
Reflection
How have you gathered data in the field in the past? Maybe you:
- recorded plant species at a site
- took pictures with a drone
- took stream temperature measurements
- checked the water level at beaches along Lake Michigan
- helped track the mountain lions in Los Angeles
- captured community response to streambank flooding.
Each of these kinds of field observations can be spatially located. Think about the kind of attribute information that might be collected with these spatial field data. How would you do it differently if you had access to the best equipment today?
Topic 1 Knowledge Check
2. Importing feature data into your GIS
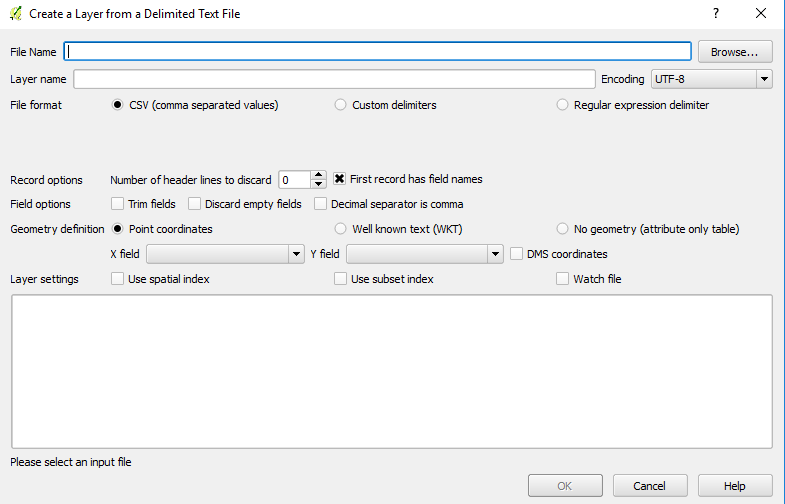
Most GIS (e.g., QGIS, ArcGIS desktop, Pro, online) tools, and some other web maps (e.g., GoogleEarth) can be used to map the data that you have gathered. A mapping toolset requires that the data being mapped have a geolocation attached to it—a city/state, zip code, street address, UTM or a latitude–longitude coordinate pair.
Sometimes spatial data require transformation before they can be utilized within spatial analysis. There are many free packages available online that can be downloaded to convert spatial datasets to the appropriate file type. Many handheld GPS files collect point data as a .gpx file, which must be converted to a different point file format, such as a text or comma delimited (csv) file with X,Y coordinates for use within a GIS.

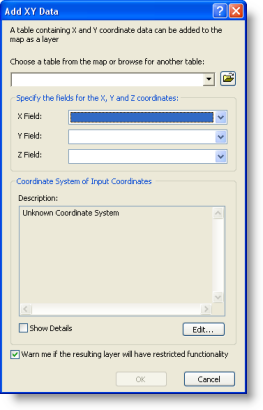
Adding X,Y Coordinate Data as a Layer
X,Y coordinates describe points on the earth’s surface such as the location of fire ignites in the desert grasslands or the points where water samples were collected in an estuary. Frequently we collect X,Y coordinate data with an elevation [Z]-value.
You can add field observations that contain geographic locations in the form of X,Y coordinates to your map. If the table also contains Z-coordinates, such as elevation, depth, or temperature for example, you can add these data as three-dimensional attributes into your map.
Initially when you add location-based data to your map as a table it becomes an X,Y event layer and behaves like other point feature layers, but does not have all the functionality of a feature class yet.
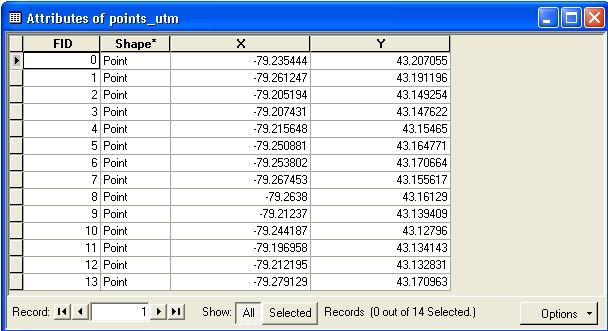
To add a table of X,Y coordinates to your map, the table must contain two fields: one for the X-coordinate, representing east-west location, and one for the Y-coordinate, reflecting the north-south position. The values in the fields may represent any coordinate system and units such as latitude and longitude or meters. A field for the Z-coordinates that enables 3D geometry is optional and will be in either metric or English units (meters or feet).
The fields must be decimal numerals. If the coordinate values are stored in degrees, minutes, and seconds (e.g., 118° 24ʹ 46ʺ) they must be converted and displayed as decimal degrees (= 118.4128°). If working with Z-coordinates, you can also change properties such as the layer’s vertical exaggeration or its offset from an elevation surface.
Know Your Data
When importing feature data from the field, it is especially important to know how it was collected. For a dramatic example of what happened when mapping Lyme disease in Rhode Island, check out the video below, and read the Directions Magazine article that accompanies this lesson.
Know your data! Example from mapping Lyme Disease
Topic 2 Knowledge Check
3. Citizen data and mobile mapping
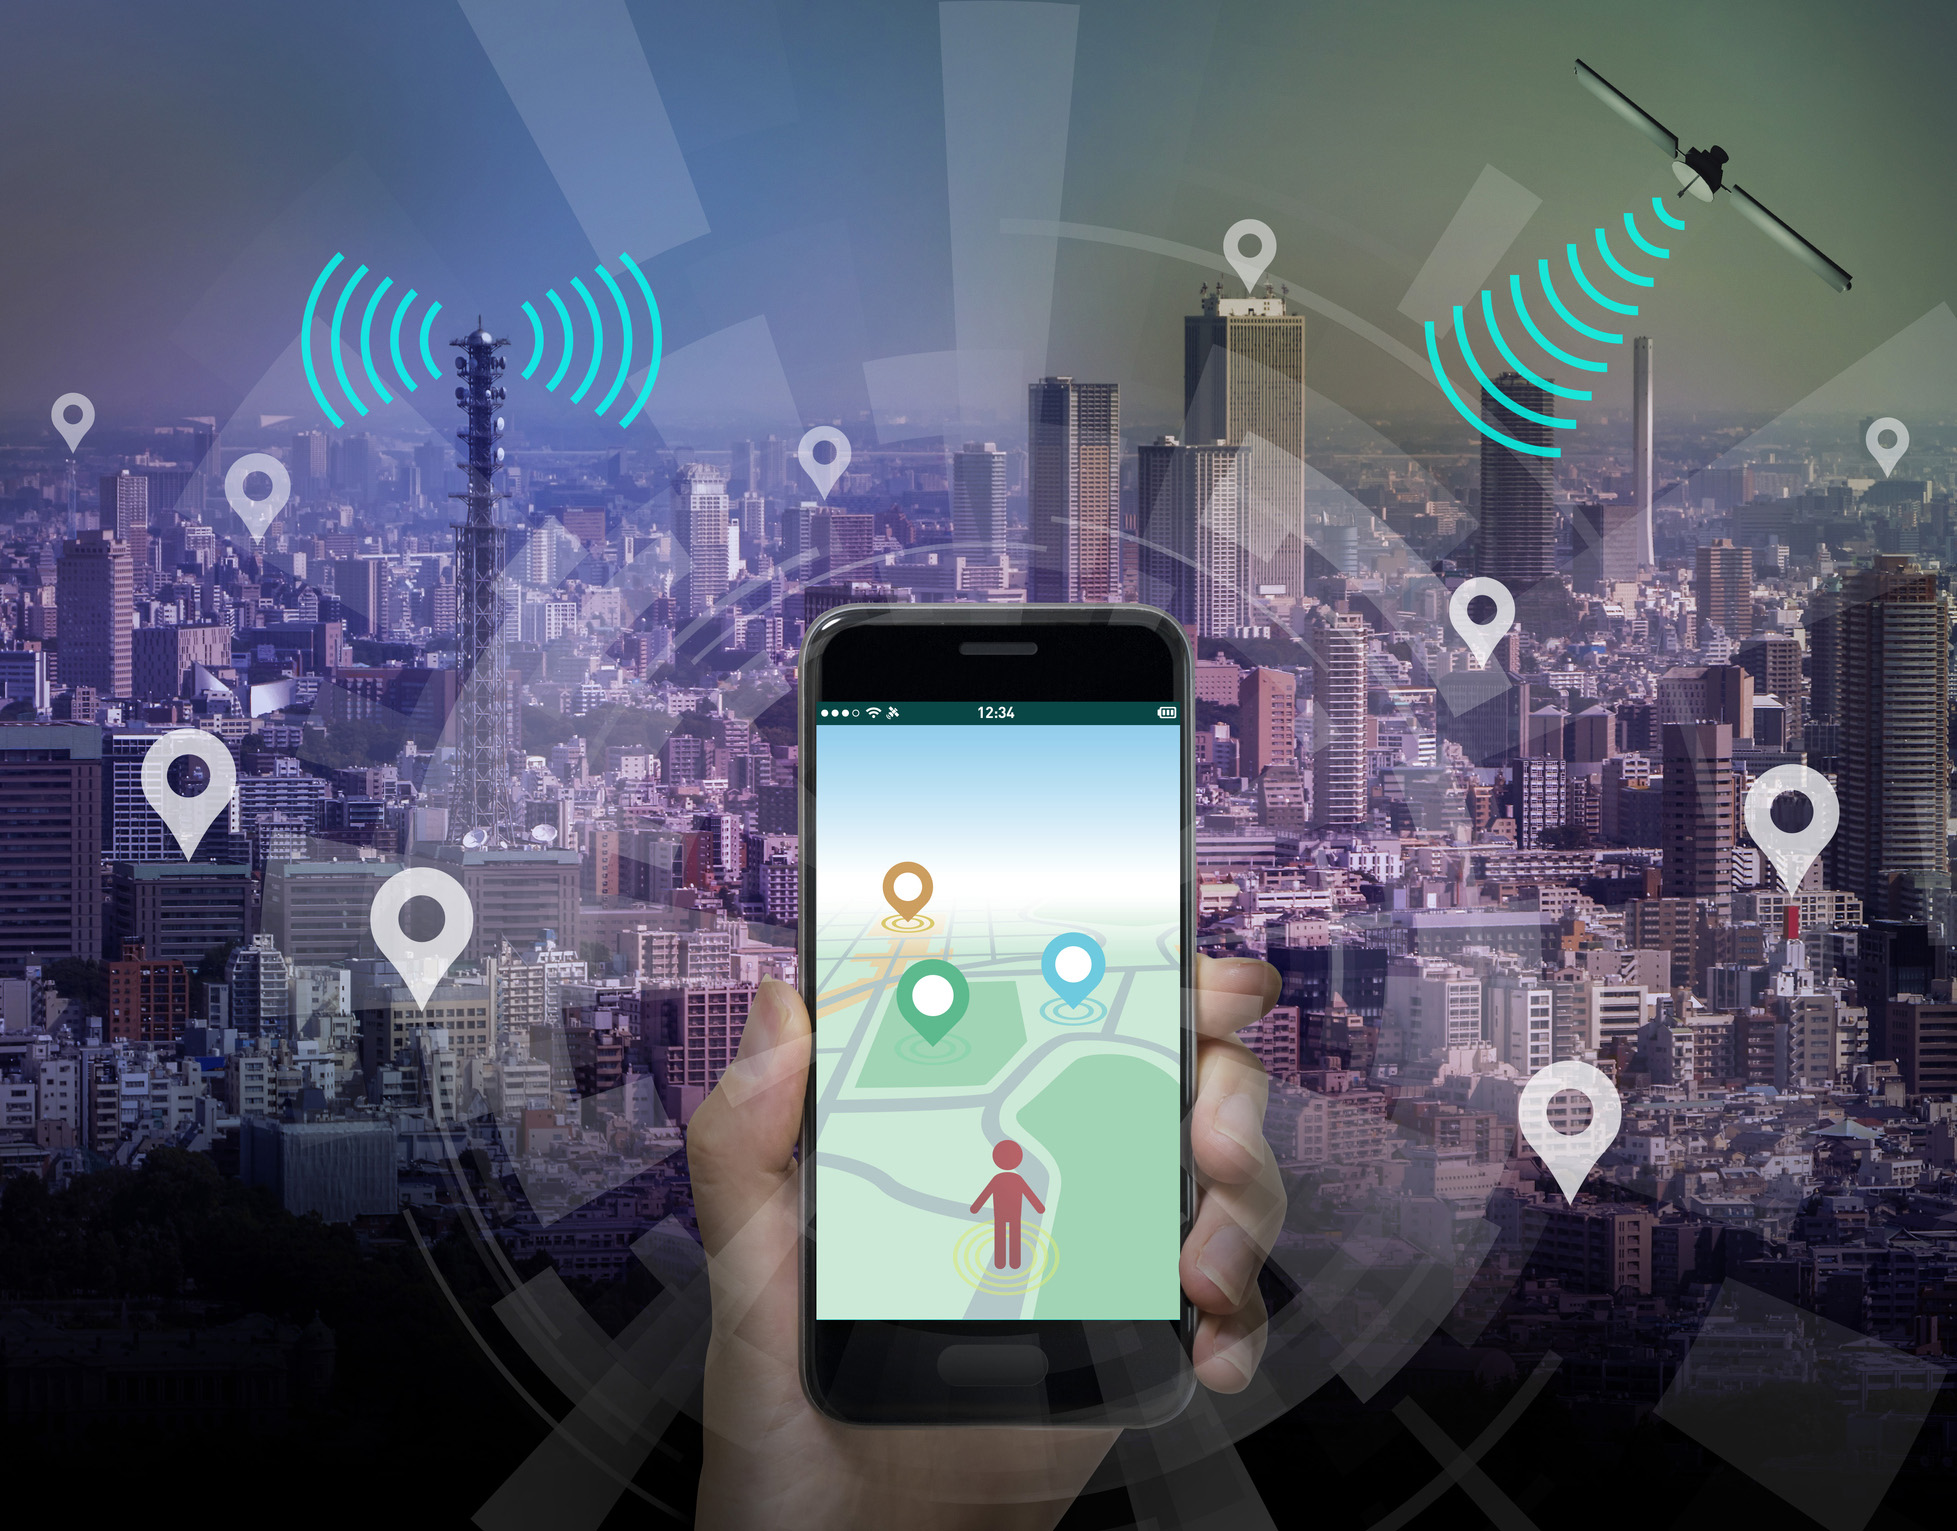
We are in an era where just about everything around us is “geo-enabled.” From our smartphones to our tablets, from webcams recording traffic or bird counts to whether car park lots are empty or full, from Earth-imaging satellites orbiting above us, to sensors below us tracking storms at sea, all of these sensors and devices are transmitting a locational coordinate signal, enabled by the coupling of GPS, smartphone towers, and Wi-Fi transmitters. Geo-enabling is being extended to thermostats, light switches, and appliances in our very own homes, fostering what is known as “the Internet of things”

and “smart cities” (Al-Hader and Rodzi 2009).

Harvesting citizen data
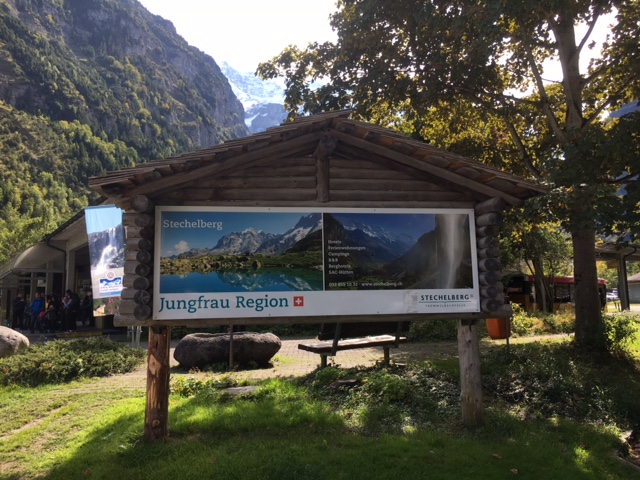
Sometimes the data transmitted by these devices unknowingly (e.g. car navigation systems support traffic reporting), or intentionally posted (e.g. via Twitter, Instagram) can be harvested by spatially savvy analysts to identify patterns in peoples’ lives. For example, colleagues at the Swiss Federal Institute for Forest, Snow, and Landscape Research (WSL) are accessing 1000s of photos and tags on Flicker to learn about cultural perspectives of Swiss landscapes (Dunkel, A 2015). Relatedly, another in England has tapped the platform ‘Geographe’ to capture users’ sense of place (Purves, et al 2011).
Citizen Scientists and Volunteered Geographic Information
On the other hand, often citizens are motivated to voluntarily collect geospatial data as a part of the broader citizen science context and is referred to as volunteered geographic information (VGI) and participatory or community mapping in the world of GIS. These VGI collectors might be avid birders, conservation-oriented hunters, or residents concerned about lakeshore erosion for example.
Let’s look at several examples of citizen science initiatives to collect location-based observations. Click the links below to explore a few now:
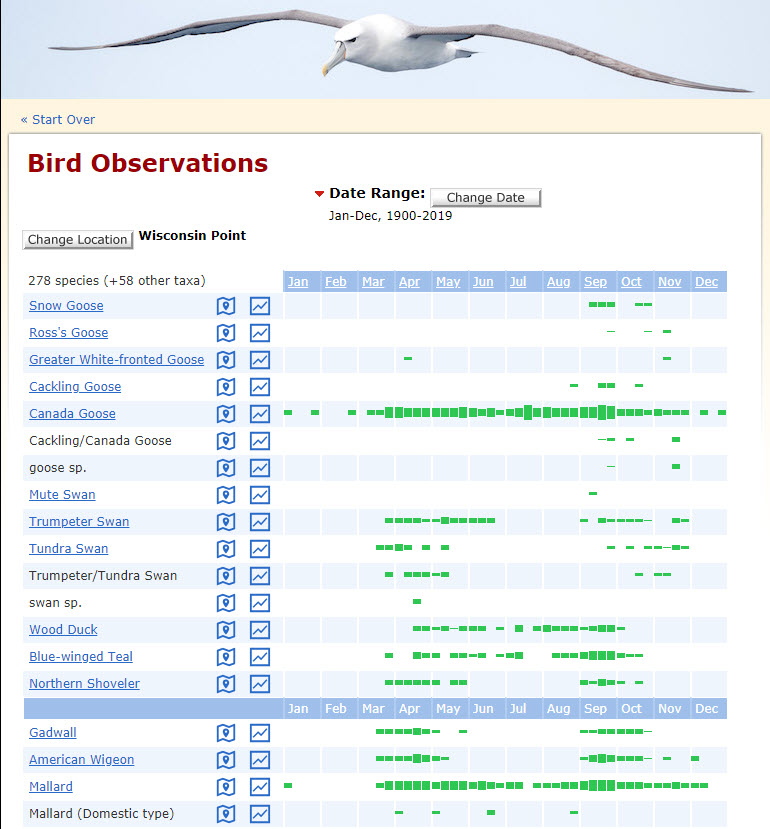
Citizen Mapping Networks Respond!
Citizen-collected spatial data, or VGI, can also provide critical information needed for disaster relief, distribution of humanitarian aid, community development, health, and education. For example, MapAction is a nongovernmental organization (NGO) made up of volunteer GIS professionals that rapidly gather on-the-scene georeferenced information to create maps that facilitate the timely delivery of humanitarian aid in areas affected by natural disasters.
Prince Harry shines a light on the vital work of MapAction volunteers (links to video above)
Likewise, VGI is increasingly used by authoritative sources, such as government agencies and private companies, to create near-real-time maps to inform situation monitoring and emergency response, such as monitoring wildfires, volcanic eruptions, tsunamis, tornadoes, traffic, water quality, and others.
For example, Esri uses crowd-sourced information from social media to create maps that can inform first responders and has hosted VGI-contributed web applications for many natural disasters. Google has also used search terms to map the outbreak and spread of the flu, which informs doctors and hospitals of trends in patient illness.
In China, increased accessibility of social media such as Weibo made a huge difference in reporting of more recent earthquake victims and dangers compared to the Wenchuan earthquake in 2008.
Tracking Social Activities
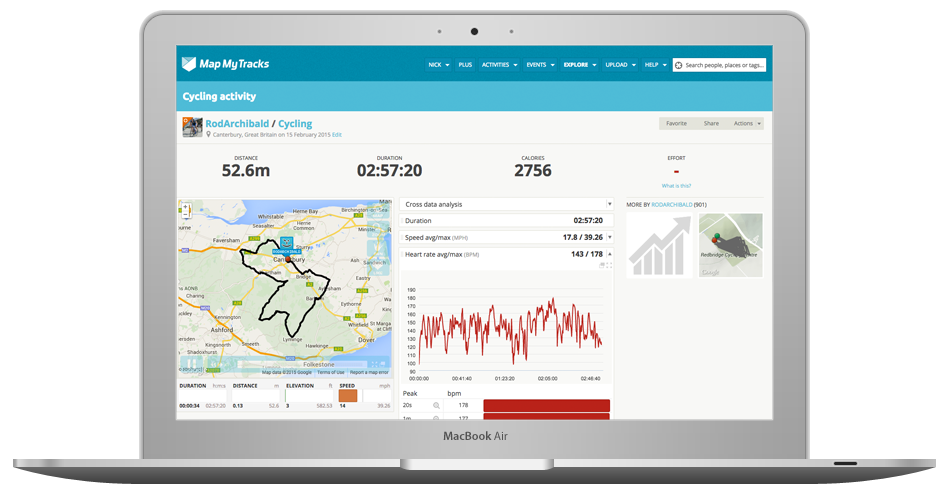
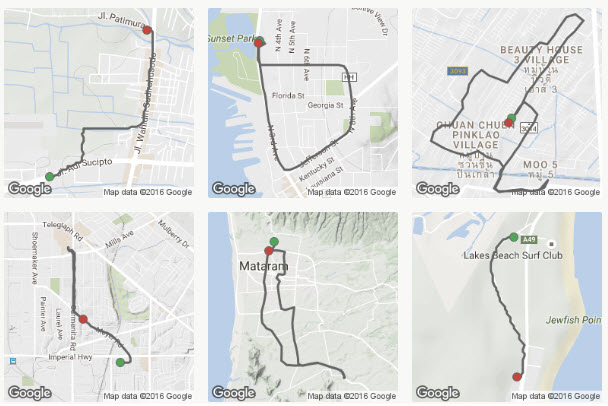
VGI is also used to create social networks of place for fun and fitness. Similar to FitBits, for example, Map My Tracks uses GPS-enabled mobile devices and a Google map-based app to track all kinds of outdoor fitness and activities. You can challenge and share your routes with friends. Routes are uploaded to a community map shared by all users, similar to Map My Run or Map My Ride.

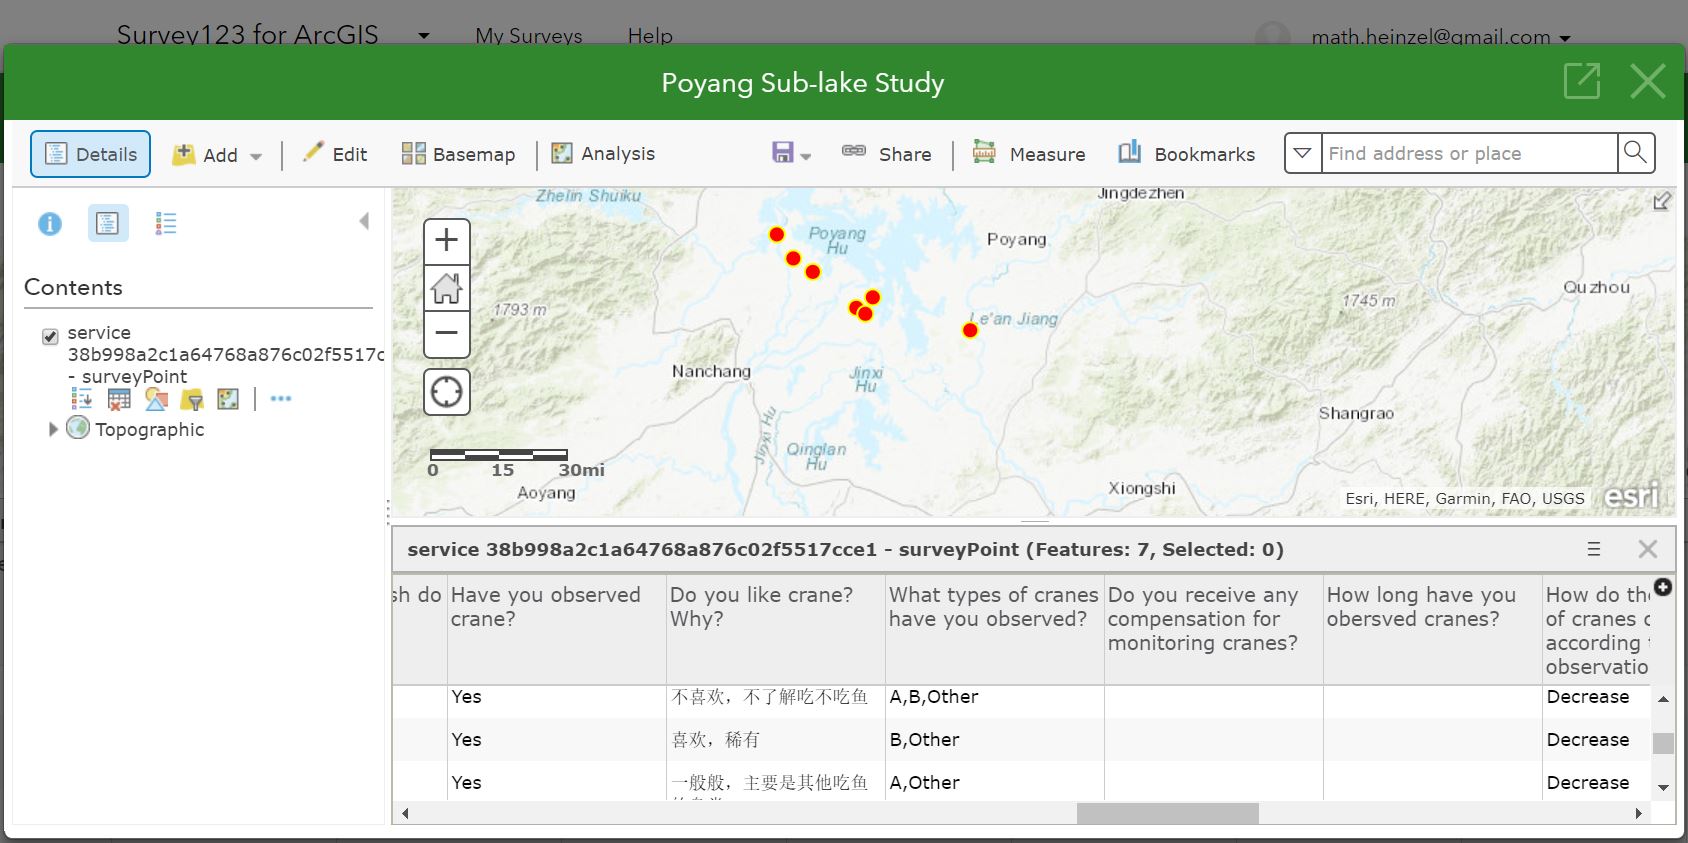
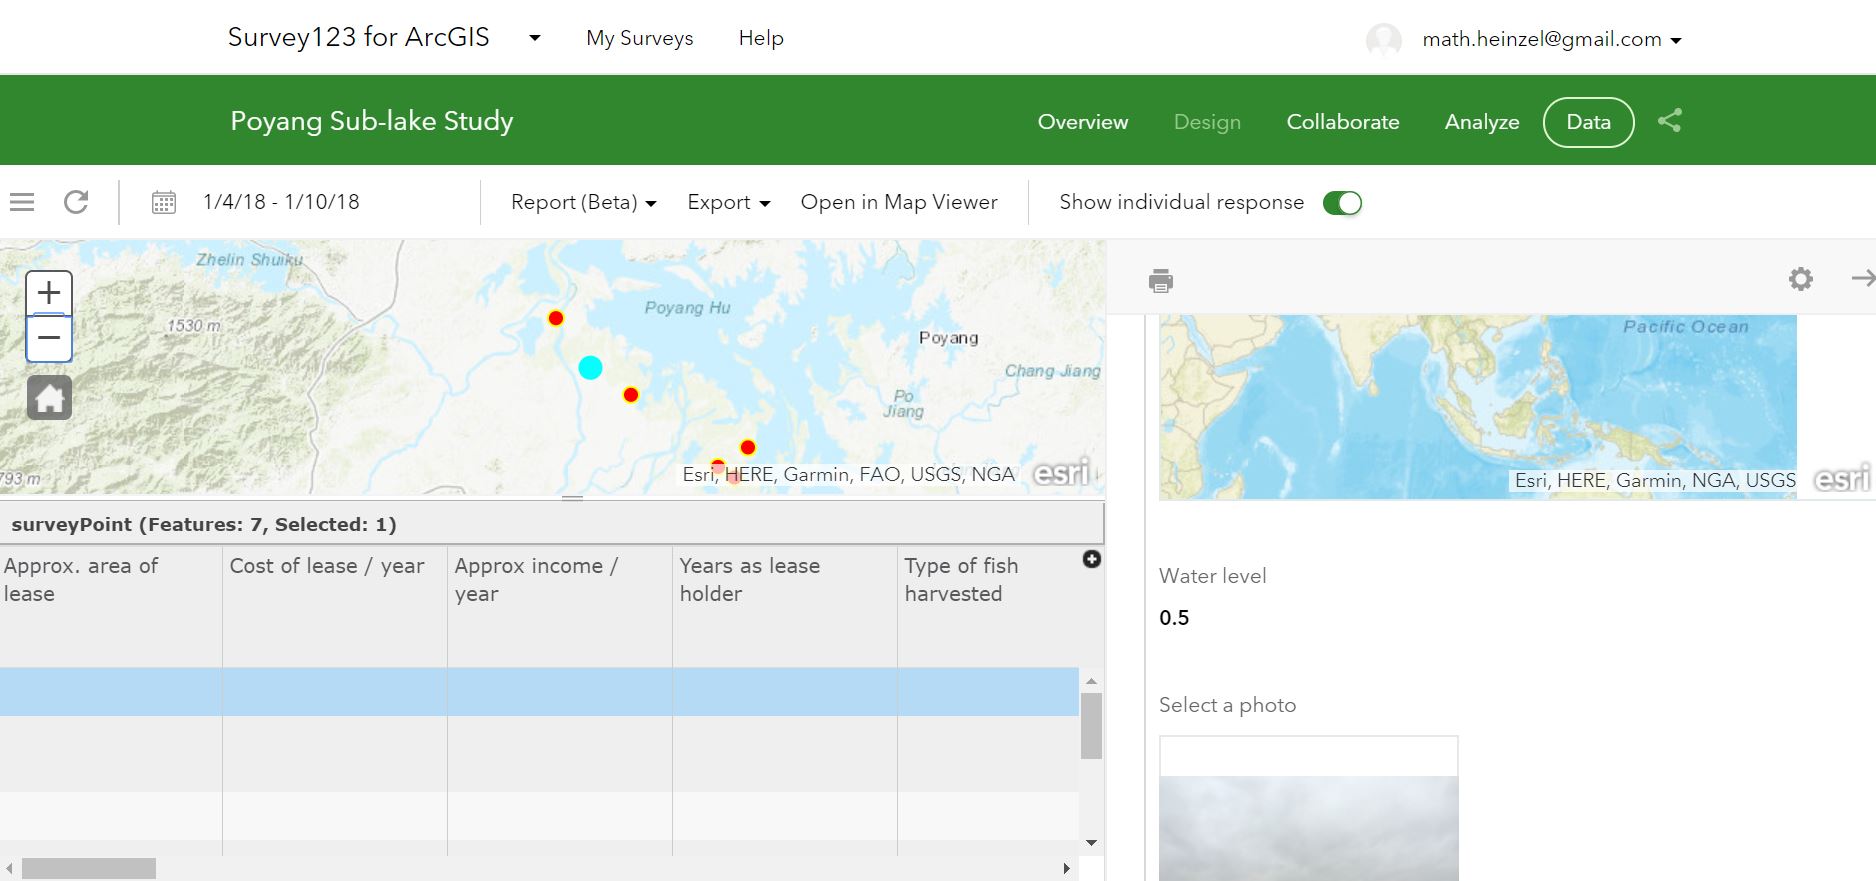
ArcGIS Collector and Survey123
Likewise, Esri has its own mobile apps. Collector GIS is a map-centric tool, meaning it starts with a web map, and tends to be used more in organizations, whereas Survey123 is called a form-centric tool that allows individuals to write a series of questions to be “surveyed” in the field, stored in a spreadsheet and displayed in a web map after collection. Training videos and tutorials for both of these apps are available through the Esri training catalog.
Many citizen-held mobile apps like these connect your mapped observations to ArcGIS Online, Google Earth/Maps, or other cloud mapping services.
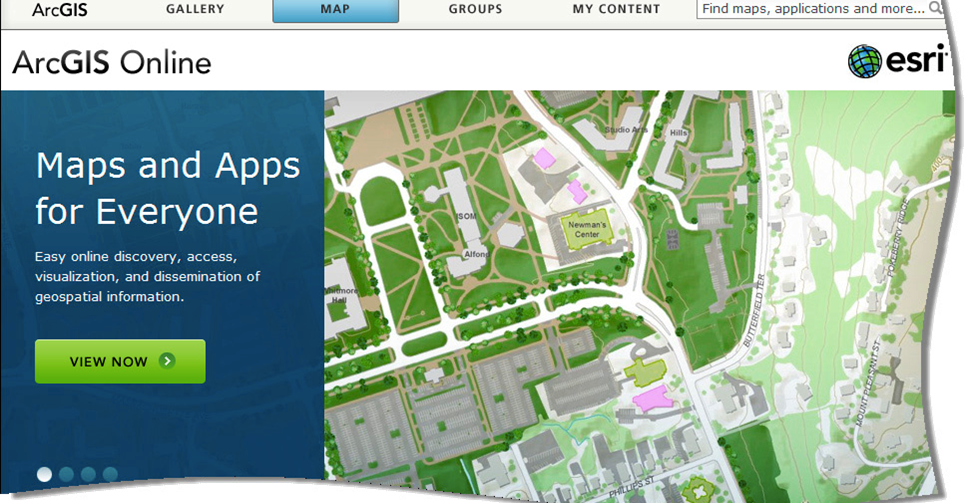
ArcGIS Online provides a robust GIS backbone for viewing and sharing spatial data with the public or password-protected groups as well as cartographic quality mapmaking. Analytical capabilities in ArcGIS online are advancing, adding more functionality regularly.
To learn more about ArcGIS Online, visit this link and click “Learn more about ArcGIS” in the middle of the page.
Community Mapping Initiatives
When combined, mobile mapping tools and web-based GIS tools can enable community members to share spatially referenced data with one another and create place-based stories around specific topics. For example, in a Directions Magazine article (2016), Kerski talks about Storytelling as one of five forces catapulting geography onto the world stage. Storymaps are a tool to share your spatial stories with the world. Storymaps grew out of an idea by former National Geographic writer/photographer, Allen Carroll, called Geostories to beautifully illustrate through maps and photographs the stories of places. Now with Esri, Carroll’s team has created a variety of storymap templates that allow people with little to know GIS capability to map and illustrate their own stories.
Similarly, Google Earth has a platform called Voyager. This is an example of their partnership with The Jane Goodall Institute
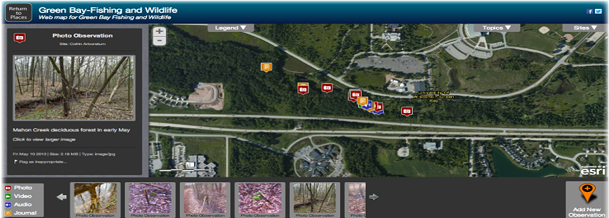
These initiatives can facilitate citizen science, place-based learning, and community capacity building among other things. We designed a similar customized tool to capture citizens’ local experiential knowledge of place. Their individual observations then accumulate through the app to create a community’s own spatial narrative (an earlier variation of the Storymap idea). The Wisconsin Geotools were piloted in the Green Bay, Wisconsin area, and are under redevelopment for new applications.
To learn more, see Eanes et al. 2018, and the project site here: here
Topic 3 Knowledge Check
Credits and References:
Thanks to V.Pfeiffer for contributing content to: Citizen Mapping Networks Respond!
Eanes, F., J.Silbernagel, et al. 2018. Participatory mobile- and web-based tools for eliciting landscape knowledge and perspectives: introducing and evaluating the Wisconsin Geotools Project. J.Coastal Conservation. doi.org/10.1007/s11852-017-0589-2
Kerski, Joseph and Jill Clark. 2012. The GIS Guide to Public Domain Data. Esri Press. 388 pp., http://esripress.esri.com/display/index.cfm?fuseaction=display&websiteID=219&moduleID=0
Kerski, J. 2016. Five forces catapulting geography onto the world stage. Directions Magazine, January, https://www.directionsmag.com/article/1177
Kerski, J. 2015. Why data quality matters — now more than ever. Directions Magazine, August, https://www.directionsmag.com/article/1213
Purves, R., Edwardes, A. and Wood, J. (2011). Describing Place through User Generated Content. First Monday, pp.Volume 16, Number 9-5.
Dunkel, A. (2015). Visualizing the perceived environment using crowdsourced photo geodata. Landscape and Urban Planning 142, pp.173-186. Available at: http://www.elsevier.com/locate/landurbplan.
Media Attributions
- Moscow rental bikes
- Feature Dataset
- Adventure
- Mobile GPS navigation concept.
- Mobile Phone Booking Taxi
- Bird Observations
- smartwatch
