Part II. Our first agent-based evolutionary model
II-2. Extension to any number of strategies
1. Goal
Our goal here is to extend the model we have created in the previous chapter –which accepted games with 2 strategies only– to allow for (2-player symmetric) games with any number of strategies.
2. Motivation. Rock, paper, scissors
The model we will develop in this chapter will allow us to explore games such as Rock-Paper-Scissors. Can you guess what will happen in our model if agents are matched to play Rock-Paper-Scissors and they keep on using the imitate-if-better rule whenever they revise?
3. Description of the model
In this model, there is a population of n-of-players agents who repeatedly play a symmetric 2-player game with any number of strategies. The payoffs of the game are determined by the user in the form of a matrix [ [A00 A01 … A0n] [A10 A11 … A1n] … [An0 An1 … Ann] ] containing the payoffs Aij that an agent playing strategy i obtains when meeting an agent playing strategy j (i, j ∈ {0, 1, …, n}). The number of strategies is inferred from the number of rows in the payoff matrix.
Initially, players choose one of the available strategies at random (uniformly). From then onwards, the following sequence of events –which defines a tick– is repeatedly executed:
- Every agent obtains a payoff by selecting another agent at random and playing the game.
- With probability prob-revision, individual agents are given the opportunity to revise their strategies. The decision rule –called imitate if better– reads as follows:
Look at another (randomly selected) agent and adopt her strategy if and only if her payoff was greater than yours.
All agents who revise their strategies within the same tick do it simultaneously (i.e. synchronously).
The model shows the evolution of the number of agents choosing each of the possible strategies at the end of every tick.
 4. Interface design
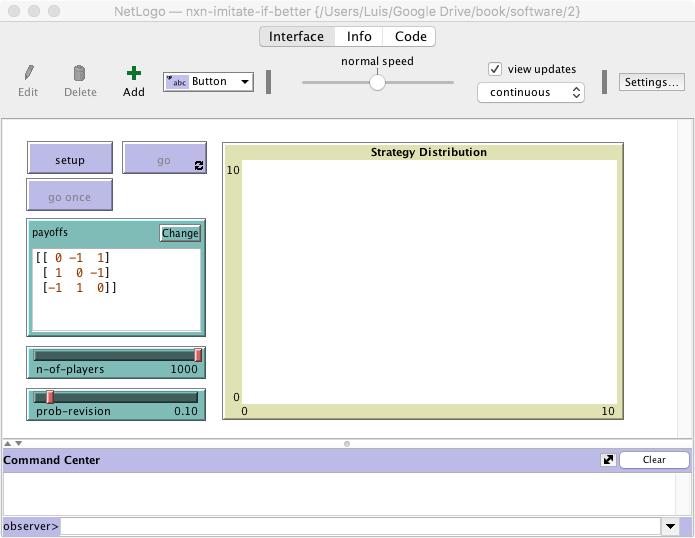
We depart from the model we developed in the previous chapter (so if you want to preserve it, now is a good time to duplicate it).

The new interface (see figure 1 above) requires just two simple modifications:
- Make the payoffs input box bigger and let its input contain several lines.
In the Interface tab, select the input box (by right-clicking on it) and make it bigger. Then edit it (by right-clicking on it) and tick the “Multi-Line” box.
- Remove the “pens” in the Strategy Distribution plot. Since the number of strategies is unknown until the payoff matrix is read, we will need to create the required number of “pens” via code.
In the Interface tab, edit the Strategy Distribution plot and delete both pens.
 5. Code
5.1. Skeleton of the code

5.2. Global variables and individually-owned variables
It will be handy to have a variable store the number of strategies. Since this information will likely be used in various procedures, it makes sense to define the new variable as global. A natural name for this new variable is n-of-strategies. The modified code will look as follows:
globals [
  payoff-matrix
  n-of-strategies
]
5.3. Setup procedures
The current setup procedure is the following:
to setup
  clear-all
  set payoff-matrix read-from-string payoffs
  create-players n-of-players [
    set payoff 0
    set strategy 0
  ]
  ask n-of random (n-of-players + 1) players [set strategy 1]
  ask players [set strategy-after-revision strategy]
  reset-ticks
end
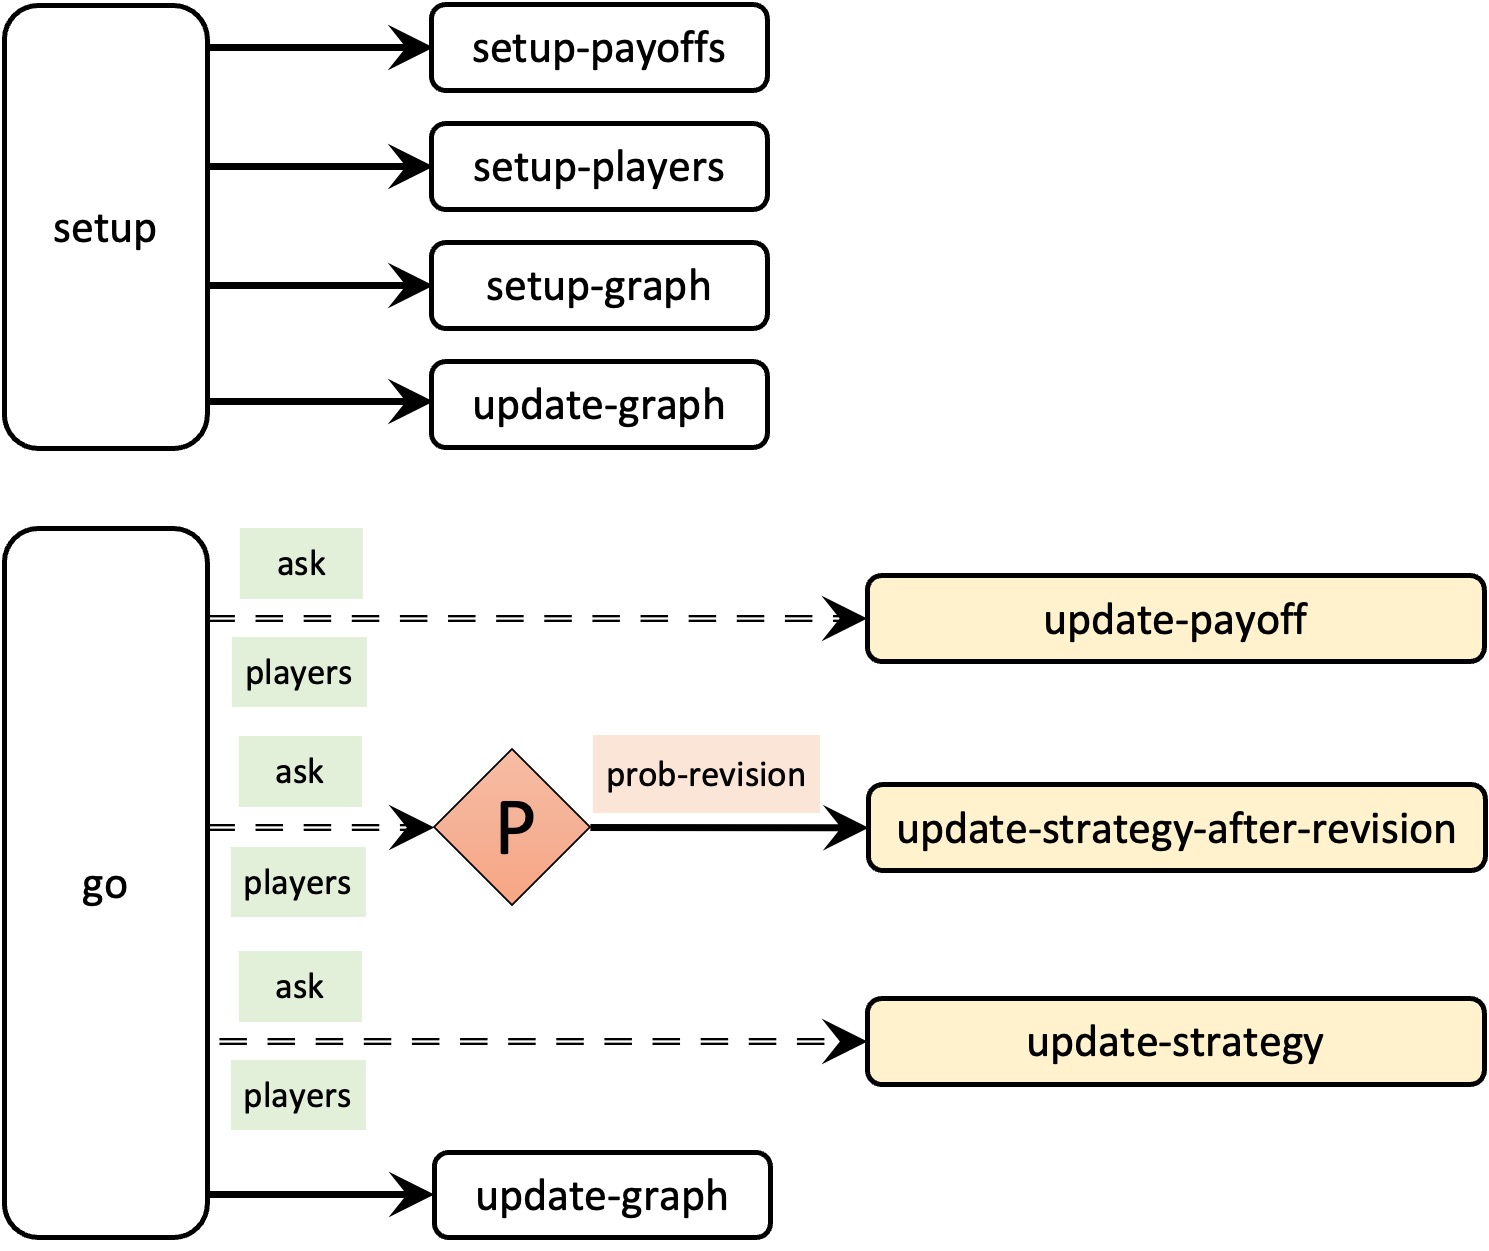
Note that the code in the current setup procedure performs several unrelated tasks –namely clear everything, set up the payoffs, set up the players, and set up the tick counter–, and now we will need to set up the graph as well (since we have to create as many pens as strategies). Let us take this opportunity to modularize our code and improve its readability by creating new procedures with descriptive names for groups of related instructions, as follows:
to setup
  clear-all
  setup-payoffs
  setup-players
  setup-graph
  reset-ticks
  update-graph
end
to setup-payoffs
The procedure to setup-payoffs will include the instructions to read the payoff matrix, and will also set the value of the global variable n-of-strategies. We will use the primitive length to obtain the number of rows in the payoff matrix.
to setup-payoffs
  set payoff-matrix read-from-string payoffs
  set n-of-strategies length payoff-matrix
end
to setup-players
The procedure to setup-players will create the players and set the initial values for their individually-owned variables. The initial payoff will be 0 and the initial strategy will be a random integer between 0 and (n-of-strategies – 1). We must not forget to initialize their strategy-after-revision too.
to setup-players
 create-players n-of-players [
   set payoff 0
   set strategy (random n-of-strategies)
   set strategy-after-revision strategy
 ]
end
to setup-graph
The procedure to setup-graph will create the required number of pens –one for each strategy– in the Strategy Distribution plot. To this end, we must first specify that we wish to work on the Strategy Distribution plot, using the primitive set-current-plot.
set-current-plot "Strategy Distribution"
Then, for each strategy i ∈ {0, 1, …, (n-of-strategies – 1)}, we do the following tasks:
- Create a pen with the name of the strategy. For this, we use the primitive create-temporary-plot-pen to create the pen, and the primitive word to turn the strategy number into a string.
create-temporary-plot-pen (word i)
- Set the pen mode to 1 (bar mode) using set-plot-pen-mode. We do this because we plan to create a stacked bar chart for the distribution of strategies.
set-plot-pen-mode 1
- Choose a color for each pen. See how colors work in NetLogo.
set-plot-pen-color 25 + 40 * i
Now we have to actually loop through the number of each strategy, making i take the values 0, 1, …, (n-of-strategies – 1). There are several ways we can do this. Here, we do it by creating a list [0 1 2 … (n-of-strategies – 1)] containing the strategy numbers and going through each of its elements. To create the list, we use the primitive range.
range n-of-strategies
The final code for the procedure to setup-graph is then:
to setup-graph
  set-current-plot "Strategy Distribution"
  foreach (range n-of-strategies) [ i ->
    create-temporary-plot-pen (word i)
    set-plot-pen-mode 1
    set-plot-pen-color 25 + 40 * i
  ]
end
to update-graph
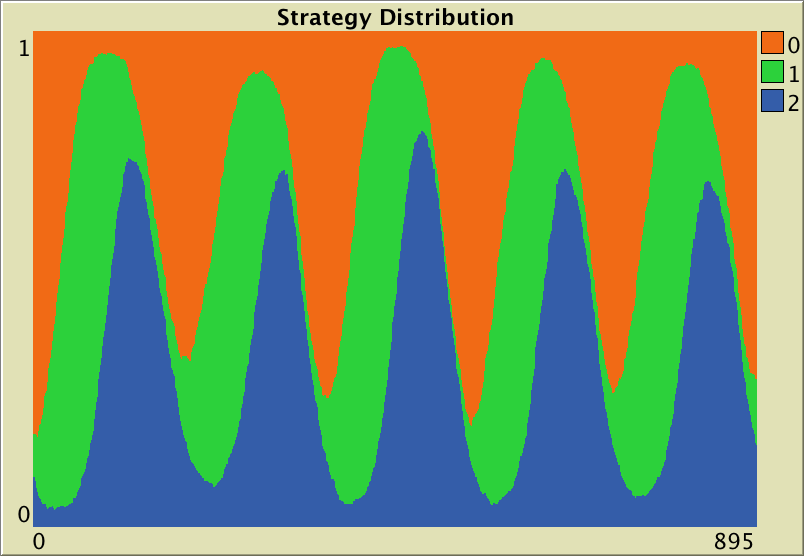
Procedure to update-graph will draw the strategy distribution using a stacked bar chart, like the one shown in figure 3 below. This procedure is called at the end of setup to plot the initial distribution of strategies, and then also at the end of procedure to go, to plot the strategy distribution at the end of every tick.

We start by creating a list containing the strategy numbers [0 1 2 … (n-of-strategies – 1)], which we store in local variable strategy-numbers.
let strategy-numbers (range n-of-strategies)
To compute the (relative) strategy frequencies, we apply to each element of the list strategy-numbers, i.e. to each strategy number, the operation that calculates the fraction of players using that strategy. To do this, we use primitive map. Remember that map requires as inputs a) the function to be applied to each element of the list and b) the list containing the elements on which you wish to apply the function. In this case, the function we wish to apply to each strategy number (implemented as an anonymous procedure) is:
[n -> ( count (players with [strategy = n]) ) / n-of-players]
In the code above, we first identify the subset of players that have a certain strategy (using with), then we count the number of players in that subset (using count), and finally we divide by the total number of players n-of-players. Thus, we can use the following code to obtain the strategy frequencies, as a list:
map [n -> count players with [strategy = n] / n-of-players] strategy-numbers
Finally, to build the stacked bar chart, we begin by plotting a bar of height 1, corresponding to the first strategy. Then we repeatedly draw bars on top of the previously drawn bars (one bar for each of the remaining strategies), with the height diminished each time by the relative frequency of the corresponding strategy. The final code of procedure to update-graph will look as follows:
to update-graph
  let strategy-numbers (range n-of-strategies)
  let strategy-frequencies map [ n ->
        count players with [strategy = n] / n-of-players
      ] strategy-numbers

  set-current-plot "Strategy Distribution"
  let bar 1
  foreach strategy-numbers [ n ->
    set-current-plot-pen (word n)
    plotxy ticks bar
    set bar (bar - (item n strategy-frequencies))
  ]
  set-plot-y-range 0 1
end
5.4. Go procedure
The only change needed in the go procedure is the call to procedure to update-graph, which will draw the fraction of agents using each strategy at the end of every tick:
to go
  ask players [update-payoff]
  ask players [
    if (random-float 1 < prob-revision) [
      update-strategy-after-revision
    ]
  ]
  ask players [update-strategy]
  tick
  update-graph
end
5.5. Other procedures
Note that there is no need to modify the code of to update-payoff, to update-strategy-after-revision, or to update-strategy.
5.6. Complete code in the Code tab
The Code tab is ready!
globals [
  payoff-matrix
  n-of-strategies
]

breed [players player]

players-own [
  strategy
  strategy-after-revision
  payoff
]

to setup
  clear-all
  setup-payoffs
  setup-players
  setup-graph
  reset-ticks
  update-graph
end

to setup-payoffs
  set payoff-matrix read-from-string payoffs
  set n-of-strategies length payoff-matrix
end

to setup-players
 create-players n-of-players [
   set payoff 0
   set strategy (random n-of-strategies)
   set strategy-after-revision strategy
 ]
end

to setup-graph
  set-current-plot "Strategy Distribution"
  foreach (range n-of-strategies) [ i ->
    create-temporary-plot-pen (word i)
    set-plot-pen-mode 1
    set-plot-pen-color 25 + 40 * i
  ]
end

to go
  ask players [update-payoff]
  ask players [
    if (random-float 1 < prob-revision) [
      update-strategy-after-revision
    ]
  ]
  ask players [update-strategy]
  tick
  update-graph
end

to update-payoff
  let mate one-of other players
  set payoff item ([strategy] of mate) (item strategy payoff-matrix)
end

to update-strategy-after-revision
  let observed-player one-of other players
  if ([payoff] of observed-player) > payoff [
    set strategy-after-revision ([strategy] of observed-player)
  ]
end

to update-strategy
  set strategy strategy-after-revision
end

to update-graph
  let strategy-numbers (range n-of-strategies)
  let strategy-frequencies map [ n ->
        count players with [strategy = n] / n-of-players
      ] strategy-numbers

  set-current-plot "Strategy Distribution"
  let bar 1
  foreach strategy-numbers [ n ->
    set-current-plot-pen (word n)
    plotxy ticks bar
    set bar (bar - (item n strategy-frequencies))
  ]
  set-plot-y-range 0 1
end
5.7. Code inside the plots
Note that we take care of all plotting in the update-graph procedure. Thus there is no need to write any code inside the plot. We could instead have written the code of procedure to update-graph inside the plot, but given that it is somewhat lengthy, we find it more convenient to group it with the rest of the code in the Code tab.
6. Sample run
Now that we have implemented the model, we can explore the behavior of a population who are repeatedly matched to play a Rock-Paper-Scissors game. To do that, let us use payoff matrix [[0 -1 1][1 0 -1][-1 1 0]], a population of 500 agents and a 0.1 probability of revision. The following video shows a representative run with these settings.
Note that soon in the simulation run, one of the strategies will get a greater share by chance (due to the inherent randomness of the model). Then, the next strategy (modulo 3) will enjoy a payoff advantage, and thus will tend to be imitated. For example, if “Paper” is the most popular strategy, then agents playing “Scissors” will tend to get higher payoffs, and thus be imitated. As the fraction of agents playing “Scissors” grows, strategy “Rock” becomes more attractive… and so on and so forth. These cycles get amplified until one of the strategies disappears. At that point, one of the two remaining strategies is superior and finally prevails. The three strategies have an equal change of being the “winner” in the end, since the whole model setting is symmetric.
7. Exercises
You can use the following link to download the complete NetLogo model: nxn-imitate-if-better.nlogo.

Exercise 1. Consider a Rock-Paper-Scissors game with payoff matrix [[0 -1 1][1 0 -1][-1 1 0]]. Here we ask you to explore how the dynamics are affected by the number of players n-of-players and by the probability of revision prob-revision. Explore simulations with a small population (e.g. n-of-players = 50) and with a large population (e.g. n-of-players = 1000). Also, for each case, try both a small probability of revision (e.g. prob-revision = 0.01) and a large probability of revision (e.g. prob-revision = 0.5).
How do your insights change if you use payoff matrix [[0 -1 10][10 0 -1][-1 10 0]]?
Exercise 2. Consider a game with payoff matrix [[1 1 0][1 1 1][0 1 1]]. Set the probability of revision to 0.1. Press the button and run the model for a while (then press the button again to change the initial conditions). Can you explain what happens?
![]() Exercise 3. How would you create the list [0 1 2 … (n-of-strategies – 1)] using n-values instead of range?
Exercise 3. How would you create the list [0 1 2 … (n-of-strategies – 1)] using n-values instead of range?
![]() Exercise 4. Implement the procedure to setup-graph:
Exercise 4. Implement the procedure to setup-graph:
- using the primitive repeat instead of foreach.
- using the primitive while instead of foreach.
- using the primitive loop instead of foreach.
![]() Exercise 5. Reimplement the procedure to update-strategy-after-revision so the revising agent looks at five (randomly selected) other agents and copies the strategy of the agent with the highest payoff (among these five observed agents). Resolve ties as you wish.
Exercise 5. Reimplement the procedure to update-strategy-after-revision so the revising agent looks at five (randomly selected) other agents and copies the strategy of the agent with the highest payoff (among these five observed agents). Resolve ties as you wish.
![]() Exercise 6. Reimplement the procedure to update-strategy-after-revision so the revising agent selects the strategy that is the best response to (i.e. obtains the greatest payoff against) the strategy of another (randomly) observed agent. This is an instance of the so-called sampling best response decision rule (Sandholm (2001), Kosfeld et al. (2002), Oyama et al. (2015)). Resolve ties as you wish.
Exercise 6. Reimplement the procedure to update-strategy-after-revision so the revising agent selects the strategy that is the best response to (i.e. obtains the greatest payoff against) the strategy of another (randomly) observed agent. This is an instance of the so-called sampling best response decision rule (Sandholm (2001), Kosfeld et al. (2002), Oyama et al. (2015)). Resolve ties as you wish.

