
A Spectrophotometric Study of Fluorescein
TOC/Help. Click to here expand/hide
Overview
Background
Pre-lab work
Experimental
Post-lab work
![]() For help before or during the lab, contact your instructors and TAs (detailed contact information are found on Canvas).
For help before or during the lab, contact your instructors and TAs (detailed contact information are found on Canvas).
Overview
In this experiment we introduce you to luminescence spectroscopy. You’ll also explore some of the advantages and disadvantages of this technique compared to absorption spectroscopy, and gain practice measuring and evaluating the detection limits of an analyte using luminescence versus absorbance spectroscopy.
Learning Objectives
- Interpret a standard protocol, extract relevant information, and develop a modified procedure for analysis.
- Apply good laboratory technique in making absorbance and fluorescence measurements.
- Describe the advantages and disadvantages of absorbance versus fluorescence spectroscopy for quantitative analysis.
- Perform the quality assurance practice of determining a method’s detection limit.
To cite this lab manual: “A Spectrophotometric Study of Fluorescein”. A Manual of Experiments for Analytical Chemistry. Department of Chemistry at UW- Madison, Summer 2024.
Visual Abstract

Background
Fluorescein is an organic compound used as a fluorescent tracer in a variety of products, ranging from the standard yellow highlighter pen, to the antifreeze for the radiator in your car, to medical and research applications that use fluorescence as a way to tag biological molecules for detection. You have used a structurally similar compound to detect the colorimetric endpoint of the titration between NaOH and potassium hydrogen phthalate. Phenolphthalein is different from fluorescein only by one oxygen atom, which bridges two of the aromatic rings in the latter as seen in Figure 1.
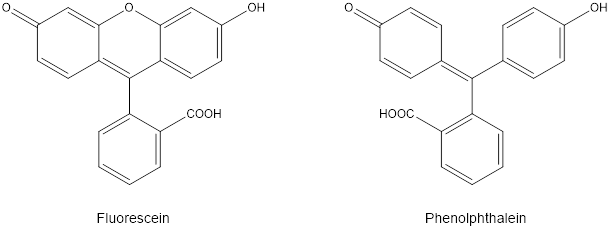
This small structural difference changes the spectral behavior of fluorescein significantly: the result allows fluorescein to be used as an agent in fluorescence spectroscopy, whereas phenolphthalein does not fluoresce.
Luminescence is observed when light is released from a molecule as electrons relax from an excited to a ground state. Phosphorescence occurs when the photon emitted results from a transition between different spin states, while fluorescence occurs when the transition happens within the same spin state (for example, between S1→S0). When a molecule fluoresces, emission occurs at longer wavelengths (or lower energy), compared to the excitation wavelength, since some of the excitation energy lost is due to vibrational relaxation.
More about the spectrometer
Your textbook covers how luminescence is used in analytical chemistry. In general, quantitative analysis is possible under the conditions where the intensity of the luminescence (I) is proportional to concentration (c). The intensity of the incident radiation (P0), also impacts I and should remain constant when collecting standard and sample data.
To perform a quantitative study, a set of standards of known concentration must first be made and measured. The resulting linear standard plot can then be used to determine the concentration of the sample. Figure 2 illustrates the major internal components of the SpectroVis Plus Vernier instrument, which can be used for both fluorescence and absorption spectroscopy applications.
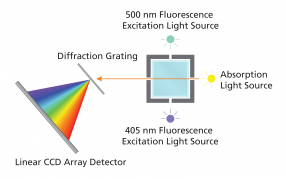
Notice that the excitation sources for fluorescence spectroscopy are offset 90° from the detector. This orientation minimizes the detection of scattered incident radiation, which is deflected by particles, the cuvette surface, and large molecules in solution. Similar to absorption measurements, fluorescence is measured on a relative scale of 0 – 1.
Just like Beer’s Law has limiting conditions, there are processes that limit the linear relationship between luminescence intensity and concentration. At high concentrations, for example, neighboring molecules in a sample can absorb light from an excited molecule before the light can leave the cuvette. A sample is said to be “quenched” when the analyte is so concentrated it absorbs its own fluorescence.
In this experiment you will compare and contrast spectra of fluorescein collected by absorption versus fluorescence spectroscopy. Note from the structure shown in Figure 1 that fluorescein is also a weak acid. As a result, the fluorescence of this molecule exhibits a small pH dependence, within the range from pH 5 to 11. For this reason, as you make your samples from the stock solutions provided, be sure to use 0.1 M NaOH when making dilutions.
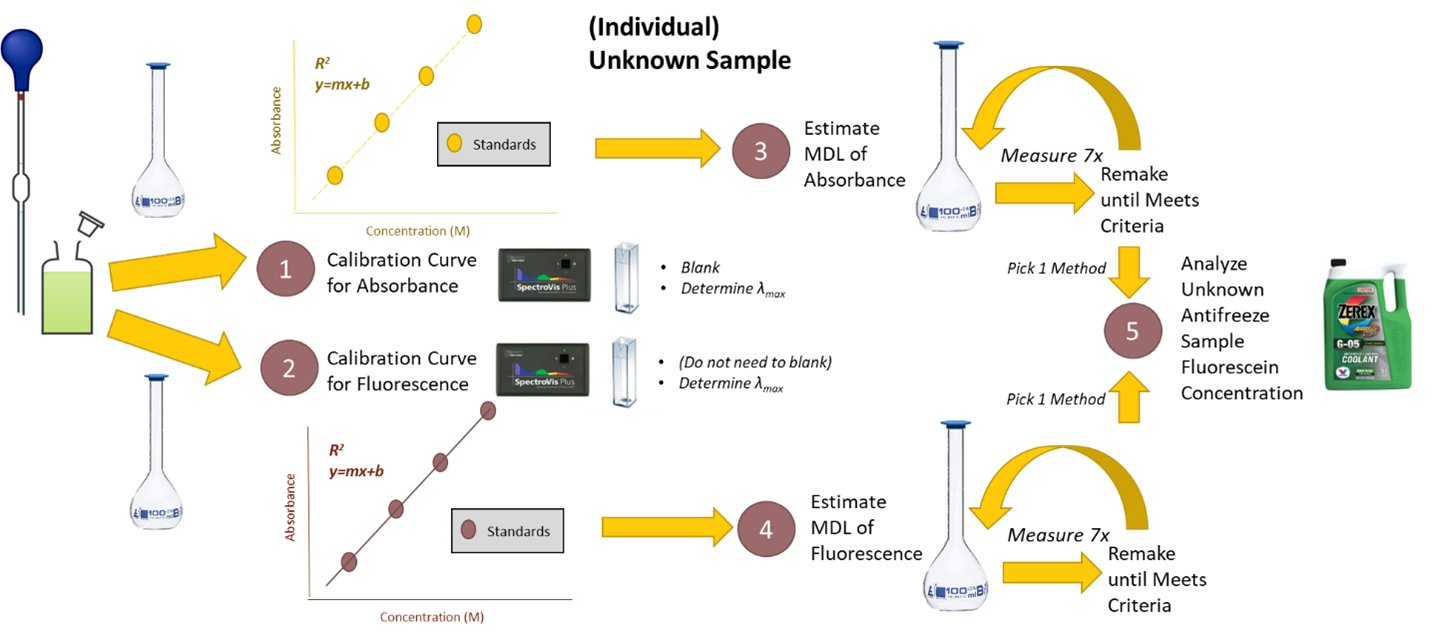
Using the methodology you learned in previous experiments, your group will design an experiment to measure the method detection limit of fluorescein using fluorescence versus absorbance spectroscopy. A more complete explanation for determining a method detection limit is provided in the Spike Recovery and Method Detection Limit lab. Read it carefully and be sure you understand the procedure before coming to lab. Finally, you will measure the concentration of fluorescein present in antifreeze samples using a set of standards you make, as well as the spectroscopy your of choice.
Performing serial dilutions
Using serial dilutions to prepare a set of solutions (either for preparing samples or standards) is standard practice in the analytical lab. In using this method, you will perform successive dilutions of a stock standard (or sample).
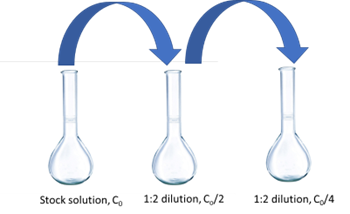
Consider Figure 3, for example, in preparing standards for this experiment using the stock solution provided. In this case we start with a solution that is 7.5 × 10⁻⁵ M fluorescein. To achieve a set of standards using a serial dilution scheme using a 100 mL flask for the dilutions, one solution is to take 50 mL of the stock and dilute to 100 (a 50:100 or 1:2 dilution), resulting in 7.5 × 10⁻⁵ M/2 = 3.75 × 10⁻⁵ M fluorescein solution. Next, you can do the same thing with this second solution (again a 1:2 dilution) resulting in a 3.75 × 10⁻⁵ M/2 = 1.87 × 10⁻⁵ M solution.
As you work to design your experiment for this lab, keep in mind the volumes of volumetric pipets available to you, which include 50, 25, 10, 5, 2, and 1 mL volumes. Other pieces of glassware can be used to perform the volume transfer of the previous solution, including a 1 mL Mohr pipet for small volumes, your Eppendorf pipets (potentially not as accurate as good old glassware!), or a buret.

Lab Concept Video
click here to hide the video (for printing purpose).
Write your observations or notes from the video in your lab notebook.
Pre-lab Work

Lab Skills
Review these lab skills videos prior to lab.
click here to hide the video playlist (for printing purpose).
Key Takeaways
- Spectrophotometry is a powerful tool that can collect both absorbance and fluorescence data.
Extra Resources:
- EPA Method Detection Limit Determination Procedure
- Using the LabQuest to Collect Spectrophotometry Data
- Making Scientific Plots
Prelaboratory Exercises
- The stockroom will provide a stock solution of 7.5 × 10⁻⁵ M fluorescein for preparing standard solutions. You will need to create a set of standards to calibrate the instrument in preparation for an absorption study of fluorescein. Design a table in your notebook describing how you would make four 100 mL solutions of fluorescein from this stock solution ranging in concentration from 1.0 to 75 µM fluorescein. Make sure you consider what pieces of glassware you have in the lab!
- Using your lowest standard concentration from the previous question, create a new table for an additional four standards, where the concentrations range from 0.01 to 0.5 µM fluorescein. This will ROUGHLY be the concentration range where fluorescence measurements will be made. It will be up to you to decide where the cutoffs exist for when absorption versus fluorescence spectroscopies are best suited.
- Consider the following intensity spectrum of fluorescein and phenolphthalein:
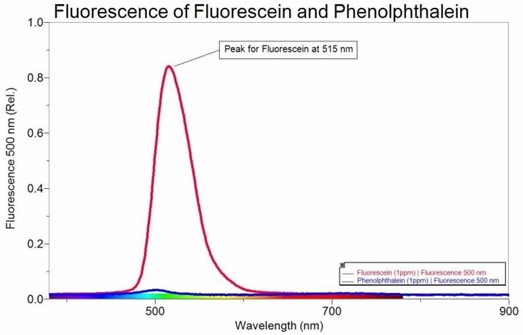
Assuming a linear relationship is preserved between signal intensity and concentration, estimate in molarity units a detection limit for fluorescein (MW = 332.31) at 515 nm, using fluorescence spectroscopy. Remember your estimate should fall within a signal to noise range of 2.5 – 5. - What is the difference between the units of absorbance and relative intensity?

Before You Take The Quiz on Canvas
- Review the EPA Procedure for Method Detection Limit handout and understand how to determine a suitable, estimated detection limit.
- Have confidence in how to perform serial dilutions, and understand the process for performing this important technique.
- Understand how to calculate the concentration of an unknown sample given the luminescence of an unknown sample and a calibration curve of luminescing standards.
- Know the difference between absorption and luminescence, and how these differences impact the instrumentation used for quantitative study.

Experimental
PROTIPs:
- Make sure you are saving and exporting your full wavelength spectra (as .txt) for your post-lab report!
- Be prepared to do this experiment only with the glassware found in your drawer (rather than checking out extra equipment).
Part 1: Determine the method detection limit of fluorescein using fluorescence versus absorption spectroscopy
Determining the MDL for absorption spectroscopy
- Using the stock solution of 7.5 × 10⁻⁵ M fluorescein, prepare four 100 mL solutions by serial dilution ranging from 1 × 10⁻⁶ to 7.5 × 10⁻⁵ M fluorescein. Be sure to use 0.1 M NaOH when diluting your solution to the mark. (The calculations for making these solutions should already be completed in your notebooks. You captured the procedure in Prelaboratory Question 1.)
- Connect a SpectroVis Plus spectrophotometer to the USB port of a LabQuest. Calibrate the spectrophotometer using 0.1 M NaOH.
- Collect and save full wavelength spectra of your solutions, noting the optimal wavelength for analysis. Comment in your notebook whether these data support that Beer’s Law works for the system. Be sure you also capture the spectrum of the blank (you should save a total of 5 spectra).
- Using the lowest concentration of the solutions made in (1), follow the EPA procedure for determining the MDL for fluorescein. Use the signal values obtained at the optimal wavelength determined in (3) in evaluating whether your estimated detection limit concentration value corresponds to an instrument signal/noise in the range of 2.5 to 5. If the solutions are too concentrated, dilute by a factor of 5 to 10 and retake the measurements. Repeat this step until you have found the MDL using absorption spectroscopy.
Determining the MDL for fluorescence spectroscopy
- Prepare four 100 mL solutions by serial dilution ranging from 0.5 × 10⁻⁶ M to 1 × 10⁻⁸ M fluorescein. Be sure to use 0.1 M NaOH when diluting your solution to the mark. (The calculations for making these solutions should already be completed in your notebooks. You captured the procedure in Prelaboratory Question 2.)
- Prepare the SpectroVis Plus for measuring fluorescence.
- From the “Sensors” menu, choose Change Units → USB: Spectrometer → Fluorescence 500 nm.
- Set up initial conditions for the instrument by tapping the “Mode: Full Spectrum” box on the Meter screen. Begin by entering 150 ms for the Sample time, Wavelength smoothing 0, Samples to Average 1. P0 can be adjusted by changing the sample time. If the peak intensity is greater than 1, reduce the sample time in intervals of 10 ms. If it is too small, increase by units of 10 ms. Remember you want to keep P0 constant for all measurements, so take care to calibrate your measurements to a median concentration of your standards before getting too far into the procedure.
- Do NOT blank the instrument when the SpectroVis Plus is in fluorescence mode. Note the placement of the cuvette faces as you insert the cuvette into the sample holder. Be sure to place the cuvette in the spectrophotometer using the same orientation for all measurements.
- Collect full wavelength fluorescence spectra of your prepared solutions, noting the optimal wavelength for analysis. Measure the two lowest standards prepared for the absorption experiment, and then continue with the solutions prepared for the fluorescence experiment (The calculations for making these solutions should already be completed in your notebooks. You captured the procedure in Prelaboratory Question 2.) Comment in your notebook whether these data support that luminescence intensity is proportional to concentration for the range of solutions prepared. Be sure you also capture the spectrum of the blank (so you should save a total of 7 spectra)!
- Using the lowest concentration of the solutions made in (5), follow the EPA procedure for determining the MDL for fluorescein using fluorescence spectroscopy. Use the signal values obtained at the optimal wavelength determined in (8) in evaluating whether your estimated detection limit concentration value corresponds to an instrument signal/noise in the range of 2.5 to 5. If the solutions are too concentrated, dilute with 0.1 M NaOH by a factor of 2 and retake the measurements. Repeat this step until you have found the MDL using fluorescence spectroscopy.
Part 2: Determine the concentration of fluorescein in commercial antifreeze
Obtain fluorescence intensity and/or absorbance measurements of a sample of commercial antifreeze.*
To prepare your sample, begin by diluting 25 mL of sample to 100 mL using 0.1 M NaOH. Visually compare the resulting sample to your standards as a first guess as to whether you need to make more dilutions or not. Perform dilutions as needed until your sample concentration falls within the range of standards you prepared. Report the concentration of fluorescein in the ORIGINAL SAMPLE.
*Reblanking the instrument and rechecking that your standards still provide a similar absorbance or intensity value is good laboratory practice. We suggest you take a few minutes and do that before finalizing the analysis. If your group chooses to do this by fluorescence, be sure to keep the orientation of the cuvette the same for each measurement and remember, don’t blank the instrument when taking a fluorescence measurement.
Post-Lab Work Up

Results/Calculations
Fill out the answer sheet for this experiment completely. Answer the following post-lab questions.
- Provide samples of absorbance and intensity spectra for fluorescein. Write a few sentences comparing and contrasting key features of each, including differences in sensitivities and wavelength maxima/minima.
- Show calibration plots for each method. Is the concentration linearly proportional to the signal for both methods? Suggest improvements to the procedure to optimize the calibration curves presented.
- Report the MDL for each method. List at least one advantage and disadvantage to using absorption or fluorescence spectroscopy for quantitative study.
- Write a data-driven reflective summary describing your procedure for determining the concentration of fluorescein in radiator fluid. Why is fluorescein added to antifreeze?

Challenge Questions
Challenge questions are designed to make you think deeper about the concepts you learned in this lab. There may be multiple answers to these questions! Any honest effort at answering the questions will be rewarded.
Beer’s law is useful in many additional contexts besides determining concentrations of analytes in solution. For example, Beer’s law governs light absorption in solid crystals, which in turn is relevant to many techniques that study the photophysical properties of materials. In lieu of molar concentration and absorptivity, absorbance of crystals depends instead on a material- and wavelength-dependent property called the absorption coefficient (α, in units of cm-1) as well as the path length through the crystal (L), such that log(I0/I) = αL.
Based on this information, answer the following questions to your best ability. Note that there are multiple ways of approaching these questions and that you are not expected to follow a particular method. As long as you show your reasoning, any honest attempt to answer each of these questions will be awarded full points.
- Consider a monochromatic beam of violet light passing through a μm-sized, nm-thin red crystal of thickness L = 100 nm. Assume no light is reflected by the surface of the crystal, and let the absorption coefficient of the crystal for the wavelength of interest be α = 1.0 × 105 cm-1.
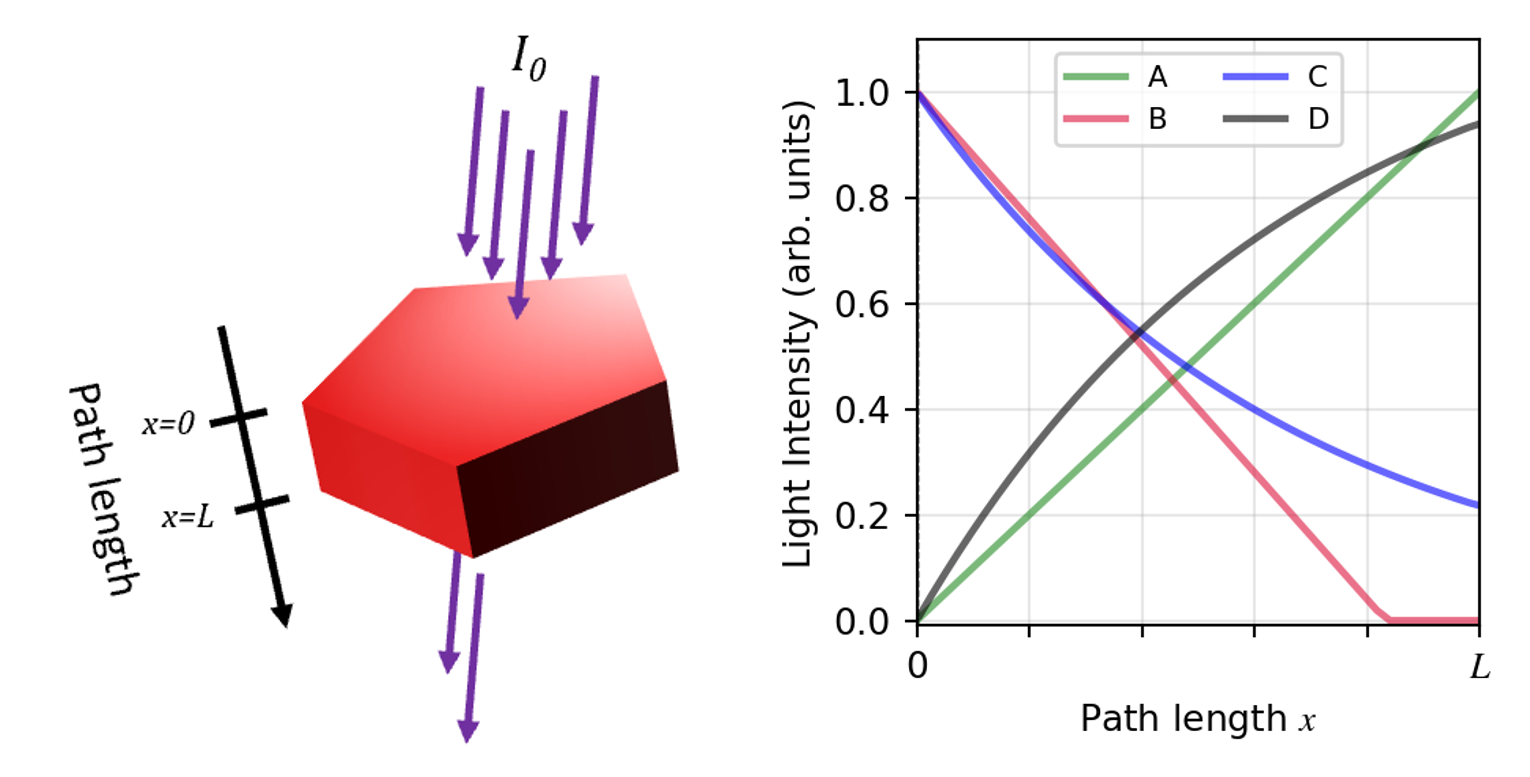
- Which of the plots, A-D, above best describes the evolution of the light intensity across the path length in the crystal? Based on the characteristics of the graph you chose (such as the slope or intercept), describe in detail how the intensity of light changes through the crystal.
- Draw a picture to show how you consider the light to interact with the crystal. Use the picture to provide a physical explanation for why the variation of light intensity with path length follows the plot you selected.
- Imagine for a moment the crystal in this problem fluoresces when excited by a 562.5 nm light source. Predict the color you might see with your eye and justify your answer with what you know about absorbance and fluorescence phenomenon.
Lab Report Submission Details
Submit your lab report on Canvas as 1 combined PDF file. This submission should include:
- The completed answer sheet.
- Your lab notebook pages associated with this lab, which should include answers to the post-lab questions and challenge questions.
The grading rubric can be found on Canvas.
References:
- Harris, D. C. & Lucy, C. A. Quantitative Chemical Analysis, 10th ed.; W. H. Freeman: New York, NY, 2020
Please use this form to report any inconsistencies, errors, or other things you would like to change about this page. We appreciate your comments. 🙂 (Note that we cannot answer questions via the google form. If you have a question, please ask your instructor or TA.)