High Performance Liquid Chromatography (HPLC)
TOC/Help. Click to here expand/hide
Overview
Background
Pre-lab work
Experimental
Post-lab work
![]() For help before or during the lab, contact your instructors and TAs (detailed contact information are found on Canvas).
For help before or during the lab, contact your instructors and TAs (detailed contact information are found on Canvas).
Overview
This experiment illustrates practices and basic quantitative methods common to methods employing an HPLC.
Learning Objectives
- Experimentally confirm that high performance liquid chromatography (HPLC), when correctly implemented, can separate a mixture of analytes in such a way as to allow for qualitative identification and quantitative analysis.
- Explore the advantages and disadvantages of several quantitative analysis techniques, such calibration curves and the method of standard addition.
- Use HPLC techniques to measure the concentration of caffeine in a tea sample and report the result with some statistical significance.
To cite this lab manual: “High Performance Liquid Chromatography (HPLC)”. A Manual of Experiments for Analytical Chemistry. Department of Chemistry at UW- Madison, Summer 2024.
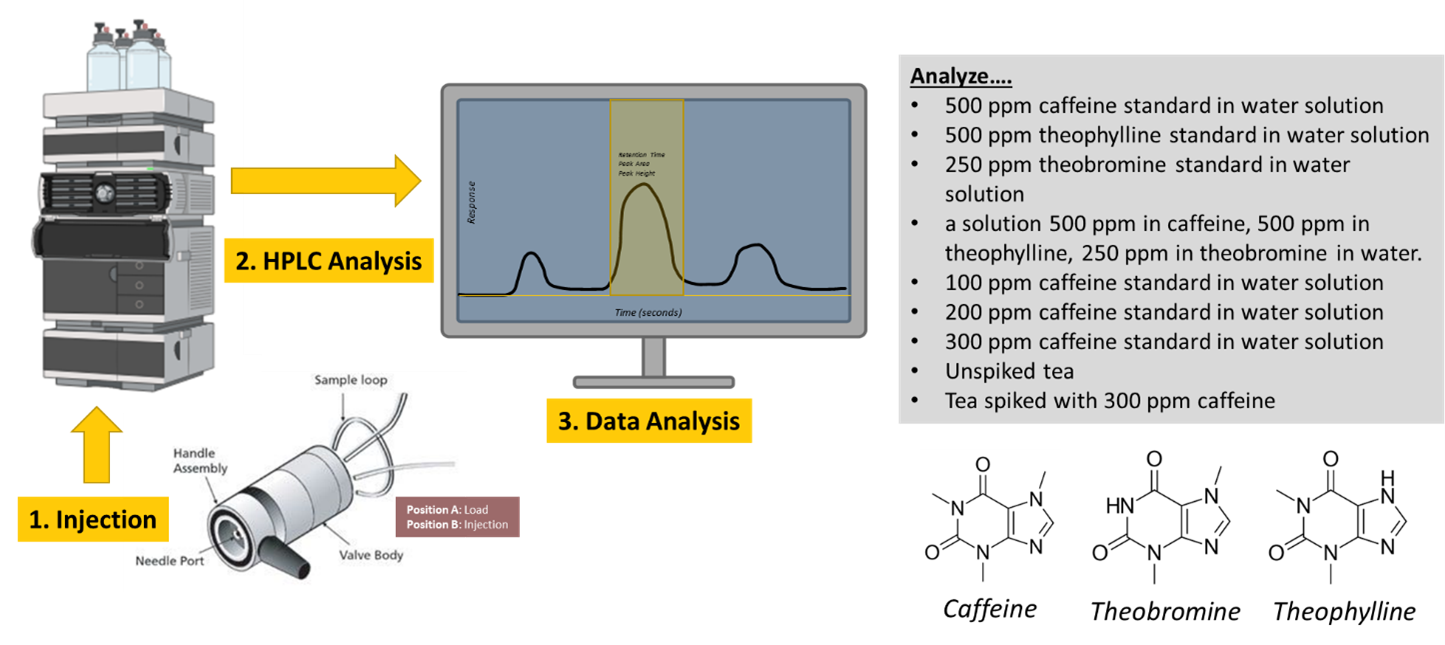
Visual Abstract

Background
Modern chromatography using a pumped liquid mobile phase is called high performance liquid chromatography and is abbreviated HPLC. The flow path of a simplified HPLC instrument is illustrated in Figure 1.
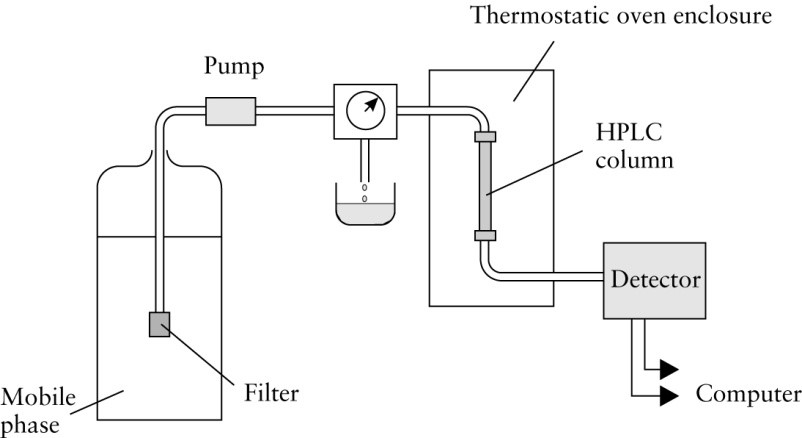
The mobile phase reservoir can be anything from a liter Erlenmeyer flask to a heated vessel with a reflux condenser. If the mobile phase is one that tends to dissolve a lot of air, a heated system may be needed to degas the liquid. Water and alcohol are most prone to problems with dissolved gas. These dissolved gases tend to form bubbles in the detector, which cause spikes on the chromatograms. Modern pumps have greatly decreased the problem of gas bubbles, but solvents are still usually degassed before use.
In HPLC, the sample is introduced into the flowing system using a syringe loaded sampling valve as shown in Figure 2.
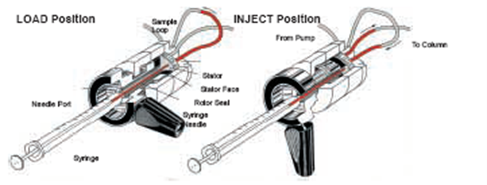
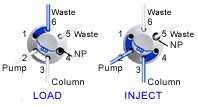
The sample loop is filled from a syringe as shown in Figure 2 on the left. The content of the loop is then carried to the column as shown in Figure 2 on the right. Notice that the handle position in the two parts of the figure is different, and the sample loop is filled in the “load” position and the loop is introduced to the flow of mobile phase in the “inject”. Special blunt ended syringes are used for these injectors; do not use syringes with sharp pointed needles.
The column in HPLC instruments is generally made from 4.6 mm ID stainless steel tube with heavy side-walls. They are typically 10 or 15 cm long. They are packed with surface modified porous silica microspheres. The most common stationary phase, C18 or ODS, contains a monolayer of octadecyl groups (C18H27) chemically bonded to the surface of the porous silica microspheres. Octal, amino, nitrile, phenyl, or methyl groups are also used depending on the desired polarity of the stationary phase. These modified silica packings are said to have bonded stationary phases.
The silica-based packing materials are susceptible to mechanical shock so columns should be handled with care. Also, it is common to allow several minutes for changes in the mobile phase flow rate or mobile phase composition so the column can reequilibrate before running samples. The column packings are easily clogged by particulate material. If your samples are not clean, you must filter them before injection.
The last device in the flow path is the detector, illustrated in Figure 3.
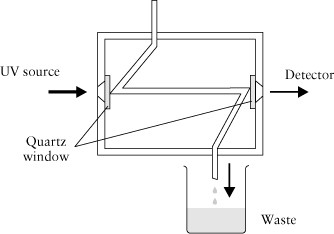
While many types of detectors have been used, the instrument you are using has an ultraviolet single beam photometer with a flow cell. The photometer is zeroed when pure mobile phase is in the flow cell. Analytes moving through the cell are detected as an attenuation of the light hitting the detector and the absorbance is calculated (-log(P/P0) = A) in the usual way. The absorbance value is then displayed on the readout and recorded on the chart recorder or computer. Note that while Figure 3 points the outflow to a waste container, it is possible to collect the separated components from this point for subsequent more specific identification or chemical analysis.
Several diverse sources are used in these UV photometers. Deuterium lamps and low-pressure mercury lamps are common. Some instruments use a phosphor-coated mercury lamp to provide wavelengths that an ordinary mercury lamp cannot supply. Interference filters are common in these instruments; quartz optics (UV transparent) are always used, and silicon photodiodes are common detectors. The internal volume of the cells is typically about 10 µL with a 1 cm cell path. Other sizes are also manufactured. The design of these flow cells varies with some being temperature controlled and some tapering the cell width. These kinds of features are included to control the impact of changes in refractive index. If some of the radiation that should reach the detector is lost because it is refracted away from the detector, one can obtain a poor baseline.
Quantitation
HPLC instruments provide chromatograms as their standard readout. For all detectors that are used in chromatography, at least over a reasonable range, there exists a linear relationship between peak area and the amount of material that is responsible for causing the peak. Thus, by injecting suitable amounts of pure analyte, the analyst can work up a standard curve for the analyte. The standard curve can then be used to find the concentration of the analyte in samples of unknown. For example, if 1, 2, 3, 4, and 5 units of a compound were injected onto the column, one after another, the readout would be five chromatographs with single peaks. The retention time of each of the peaks would be the same, but the area under the peaks would be different. If one were to plot the area under the peaks for the five standards, one would obtain a standard curve.
A standard curve (also knowns as a calibration curve) is a scientific tool that allows us to correlate concentration to a specific signal from an instrument and, in our case, that will be absorbance (see Figure 4). Calibration curves and how they are used depend upon the relationship between those 2 variables. In our case, absorbance and concentration are connected via the absorbance (i.e., Beer’s Law). Beer’s Law assumes a linear relationship between the absorbance and concentration, thus, our calibration will have a linear equation overlayed onto its points using a “y=mx+b” equation, where the slope (m) is equivalent to εb. There exists a limit of linearity on the higher (see Point 3 in Figure 4 (left)) and lower (see Point 1 in Figure 4 (left)) ends of the calibration curve; in other words, the signal stops increasing or decreasing proportionally to the concentration, respectively. Beer’s Law isn’t valid outside the linear range (see Region 4 in Figure 4 (left)) (which is ~0.1-1 absorbance units).Please note that you cannot report a concentration above or below your determined calibration curve; instead, you would say “above/below the upper/lower limit”, respectively.
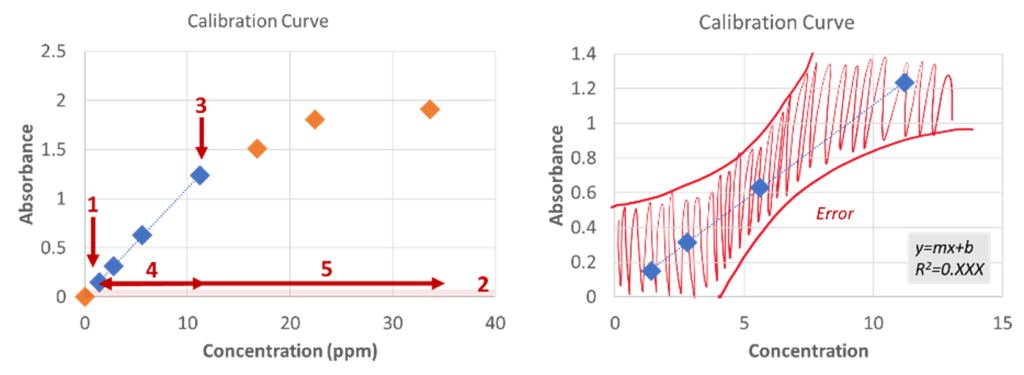
Figure 4: Example calibration curve used for Beer’s Law showing the full dynamic range (left) and the linear range (right).
Qualitatively, sample substances are identified based on retention times. This assumption is not always valid since it’s possible other substances may co-elute with the analyte. More definitive identification can be performed by using different detectors, such as a mass spectrometer or an infra-red spectrometer.
A second method that is used for quantitative analysis is called the standard addition method. In this method the unknown is first chromatographed. Then a known volume of the unknown is combined with a known volume of standard and this solution is chromatographed. The standard contains the same analyte as does the unknown. The data from the two chromatograms is combined to find the concentration of the unknown. For example, if an unknown produces a peak height of 13.0 cm for a given analyte, one can write
| kC = (peak height) | (1) |
where C is the concentration of the analyte in the unknown, and k is a proportionality constant. Therefore,
| kC = 13.0 cm | (2) |
The 10.00 mL of unknown is mixed with 10.00 mL of 100 ppm standard. The mixture is chromatographed under the same conditions as were used for the original unknown. For example, if the mixture produced a peak height of 20.0 cm, then we could write:
| (peak height of mixture) = kCm | (3) |
| [latex]20.0\; cm = k \left( \dfrac{10.00\; mL}{20.00\; mL} C + \dfrac{10.00\; mL}{20.00\; mL} C_{std} \right)[/latex] | (4) |
Using k = 13.0 cm/C and Cstd = 100 ppm
| [latex]20.0\; cm = \dfrac{13.0\; cm}{C} \left( \dfrac{10.00\; mL}{20.00\; mL} C + \dfrac{10.00\; mL}{20.00\; mL} 100\;ppm \right)[/latex] | (5) |
which can be solved for C. Note in this analysis we are assuming peak height is proportional to peak area.

Lab Concept Video
click here to hide the video (for printing purpose).
Write down your observations or notes from the video in your lab notebook.
Pre-lab Work

Lab Skills
Review these lab skills videos prior to lab.
click here to hide the video playlist (for printing purpose).
Key Takeaways
- Accurate transfer of small volumes of standards will allow you to accurately quantify the amount of caffeine in your samples.
Extra Resources:
click here to hide the video (for printing purpose).

Prelaboratory Exercises
- The following data was captured for 2 instruments analyzing the same caffeine standards and a tea sample. In looking through the data, you will notice that, even for the exact same standard and sample, peak heights and retentions times different. Explain why (or why not) this is something we should be worried about.
| Instrument #1 | Instrument #2 | |||
| Retention Time (sec) | Peak Height | Retention Time (sec) | Peak Heights | |
| 100 ppm Caffeine Standard | 141.5 | 7.39 | 161.7 | 6.947 |
| 200 ppm Caffeine Standard | 141.4 | 49.75 | 160 | 46.16 |
| 300 ppm Caffeine Standard | 141.5 | 105.2 | 163.1 | 100.2 |
| 500 ppm Caffeine Standard | 142.1 | 215.5 | 162.3 | 202.8 |
| Brewed Tea | 143.2 | 49.84 | 163.9 | 46.5 |

Before You Take The Quiz on Canvas
- Understand the method of standard addition to quantify the amount of an analyte in a sample.

Experimental
In this experiment we will use three biologically active compounds—caffeine, theobromine, and theophylline—to learn about the practice of liquid chromatography.

These compounds are all natural products isolated from plants. They are good compounds for our HPLC systems since they absorb strongly at UV wavelengths and are easily separated in an octadecyl column with a 50/50 water/methanol mobile phase.
The following solutions will be provided for you.
- 500 ppm caffeine standard in water solution.
- 500 ppm theophylline standard in water solution.
- 250 ppm theobromine standard in water solution.
- A solution 500 ppm in caffeine, 500 ppm in theophylline, 250 ppm in theobromine in water.
- 100 ppm caffeine standard in water solution.
- 200 ppm caffeine standard in water solution.
- 300 ppm caffeine standard in water solution.
Your TA will also prepare two samples of tea; one sample is decaffeinated.
Obtain chromatograms of the following solutions. Be sure that you are injecting properly (and filtering any samples you prepare). Thoroughly rinse the syringe between samples and take care not to contaminate the standard solutions.
- 500 ppm caffeine standard.
- 500 ppm theophylline standard.
- 250 ppm theobromine standard.
- 500 ppm caffeine, 500 ppm theophylline, and 250 ppm theobromine.
- 100 ppm caffeine standard.
- 200 ppm caffeine standard.
- 300 ppm caffeine standard.
- Your assigned tea sample.
- Your tea sample spiked with 300 ppm caffeine.
- A sample you bring in (that does not include dairy or anything else that could clog up the instrument) (for extra credit!). (NOTE: Extra credit is only available to those that bring in their own samples. But, you are allowed to inject only one of your groups’ samples and share the data with others that brought in a sample.)
PROTIP: It is always great to get replicates, but make sure you get at least one injection of everything on the list above (including your extra credit sample!) prior to taking duplicate or triplicate injections.
Post-Lab Work Up

Results/Calculations
Fill out the answer sheet for this experiment completely. Answer the following post-lab questions.
- What is the retention time of caffeine?
- What is the retention time of theophylline?
- What is the retention time of theobromine?
- Is the retention time of all caffeine standards the same?
- Is the retention time of all of the analytes in the chromatogram of solution 4 the same as it was in their individual chromatograms?
- On the basis of the answers to the first five questions, is qualitative analysis of caffeine, theophylline, and theobromine in a mixture possible?
- What is the qualitative analysis of your unknown?
- What assumption is being made in your answer to question 7?
- Make a plot of the peak height of the caffeine peaks versus the concentrations of the four caffeine standards.
- Is the plot reasonably linear?
- Using this plot, calculate the caffeine concentration in your unknown. What is the value?
- Calculate the concentration of caffeine in your unknown using the standard addition method. How does this value compare to the values found in question 9b?

Challenge Questions
Challenge questions are designed to make you think deeper about the concepts you learned in this lab. There may be multiple answers to these questions! Any honest effort at answering the questions will be rewarded.
1. More replicates to compare quantitation via standard addition and calibration curves for caffeine are collected across 5 different HPLC instruments. The data is shared below. Statistically, are these populations the same, meaning are both quantitative methods equivalent? Make sure to explain your reasoning and WHY you may get the result you get.
| Standard Addition (ppm) | Calibration Curve (ppm) |
| 190.7 | 190.3 |
| 189.6 | 189.4 |
| 190.3 | 190.1 |
| 190.2 | 189.2 |
| 192.2 | 191.1 |
2. Standard addition is done via adding a spike of the analyte of interest (in our case, caffeine) directly to the sample. Ideally, we would not change the matrix (meaning less than a 1-2%(v/v) addition) of the original sample with the spike. Is that true in our case? If not, how would you modify this experiment to make sure it would still work as intended?

Lab Report Submission Details
Submit your lab report on Canvas as 1 combined PDF file. This submission should include:
- The completed answer sheet.
- Your lab notebook pages associated with this lab, which should include answers to the post-lab questions, key chromatographs and any graphs you generated related to the quantitative analysis of your sample(s).
The grading rubric can be found on Canvas.
References:
- Harris, D. C. & Lucy, C. A. Quantitative Chemical Analysis, 10th ed.; W. H. Freeman: New York, NY, 2020
Please use this form to report any inconsistencies, errors, or other things you would like to change about this page. We appreciate your comments. 🙂 (Note that we cannot answer questions via the google form. If you have a question, please ask your instructor or TA.)
