Gas Chromatography (GC): Chromatographic Analysis of a Mixture of Volatile Liquids
TOC/Help. Click to here expand/hide
Overview
Background
Pre-lab work
Experimental
Post-lab work
![]() For help before or during the lab, contact your instructors and TAs (detailed contact information are found on Canvas).
For help before or during the lab, contact your instructors and TAs (detailed contact information are found on Canvas).
Overview
This experiment illustrates practices and basic quantitative methods common to methods employing a GC (Gas Chromatograph)
Learning Objectives
- Explore instrumentation and basic techniques for gas chromatography (GC), including mixing samples, performing injections, and collecting and analyzing chromatograms.
- Analyze an unknown mixture to identify the analytes qualitatively using retention times and quantitatively analyze the sample using a calibration curve and an internal standard.
To cite this lab manual: “Gas Chromatography: Chromatographic Analysis of a Mixture of Volatile Liquids”. A Manual of Experiments for Analytical Chemistry. Department of Chemistry at UW- Madison, Summer 2024.
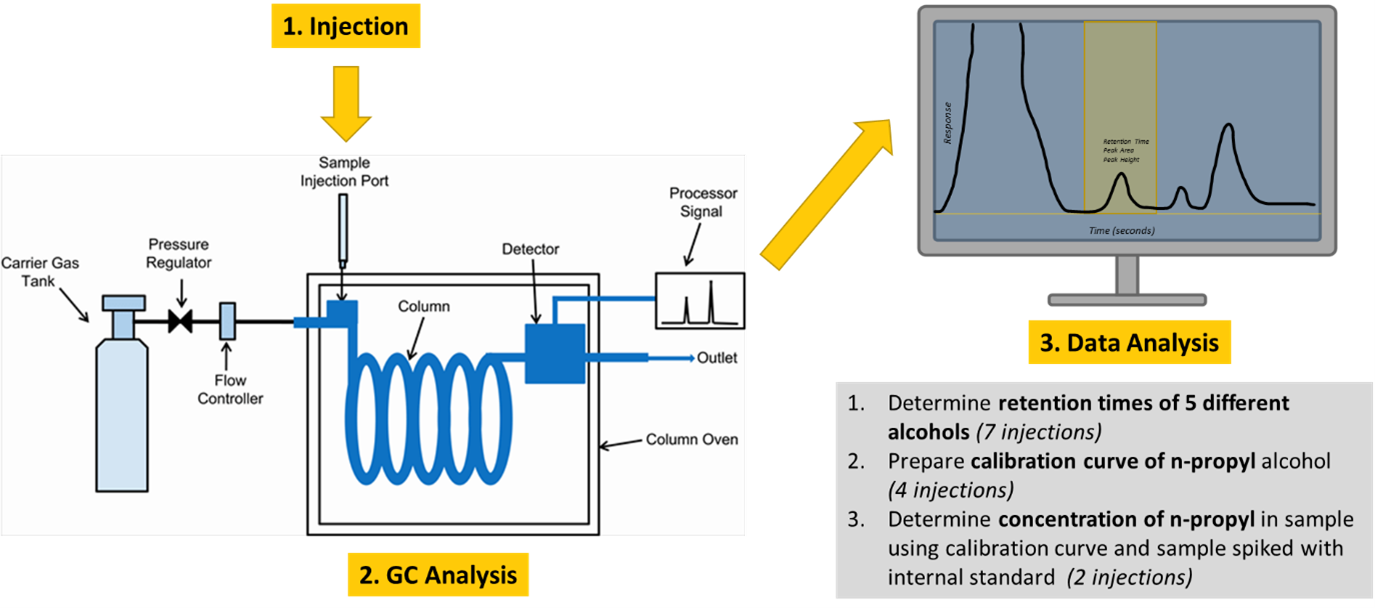
Visual Abstract


Background
In GLC, partition of solutes occurs between a mobile gas phase (the “carrier gas”) and a stationary liquid phase present in the column. The gas-phase concentration of a solute depends on the vapor pressure of the solute, as does the boiling point of the solute. GLC, then, is basically a separation method dependent on differences in boiling point of solutes (components in a sample), and is sometimes regarded as high-efficiency distillation. The parallel is quite inexact, however, since GLC is much more rapid than distillation, much more efficient (separation via GLC is possible of solutes whose boiling points differ by no more than 2°) and, most important, GLC analysis requires only about 1-2 microliters (mL) of sample, at most. GLC can be an important tool for use in determining trace constituents in a sample mixture, and is especially useful where only tiny amounts of samples are available.
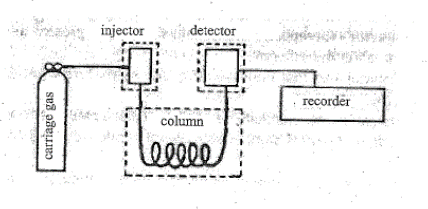
A block diagram illustrating the five key components to a GC instrument are shown in Figure 1.

The five basic parts of a gas chromatograph are:
- Carrier gas: usually, He, sometimes N2.
- Injector: a “T” in the carrier gas line, one branch of which is closed with a rubber septum, allowing sample injection.
- Column: usually metal, sometimes glass or Teflon; packed with stationary phase (silicone grease, or stopcock grease) distributed over a material with high surface area (sand, firebrick, diatomaceous earth).
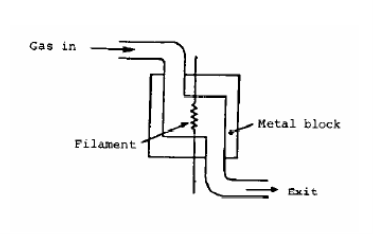
- Detector: most often is of a “thermal conductivity” type. Two states are possible in the detector: either it sees only carrier gas or a mixture of carrier gas and an eluted component. The detector itself is a filament which is heated electrically. When pure carrier gas flows through the detector the heat produced in the filament is carried away by the carrier gas, and the filament temperature is stable and constant. When a sample peak elutes, however, the thermal conductivity of the gas in contact with the filament is different and therefore causes a difference in the filament temperature. If the carrier gas is a light gas (H2 or He) with high thermal conductivity, any solute present in the carrier will decrease its conductivity, so the filament heats up and its resistance changes. This change in resistance is converted to a change in voltage, which is plotted as a function of time, resulting in the chromatogram.

Figure 2: Thermal Conductivity Detector - Recorder: plots the detector output on chart paper.
The injector, column, and detector components of the instrument each have separate set temperatures. The column temperature is set in consideration of the boiling point temperatures of the components of interest, to insure a liquid-gas equilibrium is favorable given the column choice. The injector is typically set 10-15 °C higher than the column to quickly vaporize the sample so it is present in the gas phase as it enters the column. The detector temperature is also typically set higher than the column temperature—again, about 10-15 °C more—in order to maintain a steady temperature in the detector block (avoiding signal drift), and so that sample components do not condense in the detector.
Note that operation at temperatures other than room temperature considerably extends the range of GLC, since we require only that samples be volatized for introduction into the column. At the same time, however, we have a built-in limitation, since sample components must be stable with respect to temperature (i.e., should not decompose, explosively or otherwise) when heated. This limitation as to temperature stability is the major problem encountered in analysis by GLC.
Chromatographic Analysis
GLC is “semiqualitative” since the information it yields is supporting rather than conclusive in the identification of a given component. Two properties from a given chromatogram may be measured:
- The distance (proportional to time) on the recorder chart that a given component requires to be eluted.
- The relative size of the peak produced by a component.
The first property (the retention time) yields supporting qualitative information, while the second property (the magnitude of the elution peak) is proportional to the amount of component present in the peak. It is possible to make a calibration curve relating peak height to concentration, similar to what you have done using absorbance in previous experiments. You will find that this type of analysis does not yield a very straight line, however. Very small fluctuations in temperature tend to foul what would be an otherwise linear response at the detector. Since different compounds have differing thermal conductivities, the relationship of peak size to amount of component is different for each component and must be considered if exact values are to be obtained. One method that can used is to prepare a known mixture whose composition is similar to that of the unknown mixture and then compare the peak area ratios to obtain exact values.
Another similar method is the use of an “internal standard.” In this method, a known amount of the internal standard is added to the unknown sample and the composition is determined by comparing the peak areas (or peak heights) of the unknown components to that of the internal standard. A preliminary experiment must be performed to determine the response factors of the component compared to the internal standard. In this method, first known amounts of analyte and the standard are measured in a chromatograph mixture to determine the response factor of each component at the detector. It is important that the mixture is used for the initial determination of the response factor, f, since matrix effects can sometimes alter the response of an analyte at the detector. The response factor, f, is determined by:
| [latex]f = \dfrac{(analyte\; peak\; height) (internal\; standard\; concentration)}{(internal\; standard\; peak\; height)(analyte\; concentration)}[/latex] | (1) |
Once f is determined for the components expected in the standard mixture, the sample can be analyzed. A known concentration of internal standard is spiked into the sample. To find the concentration of each analyte component, equation 1 is solved for the analyte concentration.

Lab Concept Video
click here to hide the video playlist (for printing purpose).
Pre-lab Work

Lab Skills
Review these lab skills videos prior to lab.
click here to hide the video playlist (for printing purpose).
Key Takeaways
- Accurate transfer of small volumes of standards will allow you to accurately quantify the analytes in your sample.
Extra Resources:

Prelaboratory Exercises
There are currently no pre-lab exercises for this lab.

Before You Take The Quiz on Canvas
- Understand the basics of separation by gas chromatography.
- Understand the internal standard method and the meaning of a response factor.
- Be able to calculate a response factor given the responses of both the analyte and the standard (the concentration of each is given in the procedure).
- Be able to calculate the concentration of a particular analyte given a set of raw data—response factor of that analyte, and the responses of both the analyte and the standard (the concentration of the standard is given in the procedure).

Experimental
A. Qualitative Analysis
- Carefully pipet 5.00 mL of n-amyl (also sometimes referred to as 1-pentanol) alcohol into a suitable vial. Obtain a chromatogram of the alcohol using a 2.0 μL sample.
- Add 25.0 μL of t-butyl alcohol to the n-amyl alcohol in the vial. Mix well and obtain chromatogram of this mixture using a 2.0 μL sample.
- Repeat Step No. 2 above, adding each in turn the following alcohols and obtaining chromatograms of the resulting mixtures using 2.0 μL samples.
- ethyl alcohol
- n-propyl alcohol
- n-butyl alcohol
- iso-amyl alcohol
- iso-butyl alcohol
B. Preparation of Standard Curve
- Pipet 5.00 mL of n-amyl alcohol into a clean, dry vial. Add 25 μL of n-propyl alcohol and mix well. Obtain a chromatogram of this mixture using a 2.00 μL sample.
- Add a second 25 μL portion of n-propyl alcohol to the mixture, mix well and obtain a chromatogram of the resulting mixture using a 2.0 μL sample.
- Add a third and fourth 25 μL portion of n-propyl alcohol to the mixture. Obtain a chromatogram using a 2.0 μL sample after each addition.
C. Quantitative Analysis
- Obtain an unknown mixture from your laboratory instructor. Obtain a chromatogram of this mixture using a 2.0 μL sample.
- Pipet 5.0 mL of your unknown into a clean vial. Add 100μL of n-butyl alcohol to the unknown mixture in the vial. Obtain a chromatogram of this mixture using a 2.0 μL sample.
Post-Lab Work Up

Results/Calculations
Fill out the answer sheet for this experiment completely. Answer the following post-lab questions.
- Determine the retention times and the peak heights of the seven alcohols used in Steps No. 2 and 3 of Section A.
- Determine the peak heights of the four n-propyl alcohol peaks obtained in Section B. Make a plot of n-propyl alcohol concentration vs peak height. Express concentration in μLs of alcohol added. Comment on the quality of the curve.
- Determine the n-propyl alcohol concentration in your unknown using the plot of conc. vs peak height.
- Determine the response factor, f, for the alcohols studied using n-butyl alcohol as the internal standard.
- Using the retention times and response factors determine the composition of your unknown mixture. Express the results in μL/5 mL.

Challenge Questions
- An alternative internal standard is suggested to you: 4-bromofluorobenzene. Would this internal standard be a good alternative for the analysis performed in this lab? Explain your reasoning, citing the purpose of an internal standard and the desirable properties of an internal standard in your explanation.
Lab Report Submission Details
Submit your lab report on Canvas as 1 combined PDF file. This submission should include:
- The completed answer sheet.
- Your lab notebook pages associated with this lab, which should include answers to the post-lab questions.
The grading rubric can be found on Canvas.
References:
- Harris, D. C. & Lucy, C. A. Quantitative Chemical Analysis, 10th ed.; W. H. Freeman: New York, NY, 2020
Please use this form to report any inconsistencies, errors, or other things you would like to change about this page. We appreciate your comments. 🙂 (Note that we cannot answer questions via the google form. If you have a question, please ask your instructor or TA.)
