
Introduction to Mass Spectrometry
TOC/Help. Click to here expand/hide
Overview
Background
Pre-lab work
Experimental
Post-lab work
![]() For help before or during the lab, contact your instructors and TAs (detailed contact information are found on Canvas).
For help before or during the lab, contact your instructors and TAs (detailed contact information are found on Canvas).
Overview
This experiment provides students opportunities to be exposed to and explore mass spectrometry equipment and data.
Learning Objectives
- Explore different mass spectrometers within the Department of Chemistry and identify their key qualities, such as mass range & mass resolution.
- Draw mass spectra considering both isotopes and charge states for both single molecules and complex mixtures.
To cite this lab manual: “Introduction to Mass Spectrometry”. A Manual of Experiments for Analytical Chemistry. Department of Chemistry at UW- Madison, Fall 2025.
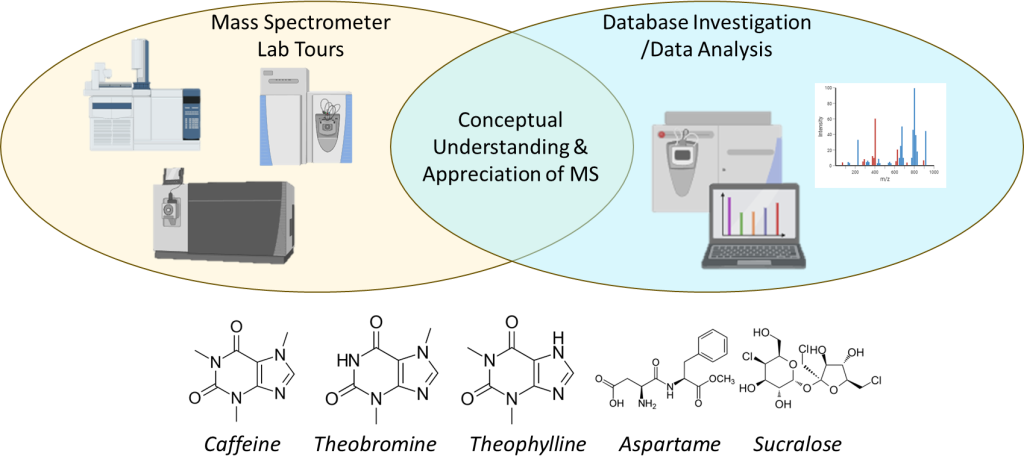
Visual Abstract

Background
Mass spectrometry (MS) has become one of the most commonly sought skills for STEM students entering the workforce due to its power to selectively identify and quantify multiple molecules with a single instrument. In 2002, the Nobel Prize was given to individuals critical to the development of key MS techniques to allow analysis of biological molecules, but it has found usefulness in ALL areas of chemistry or science. Some examples include:
- Organic Chemistry: Checking the structure or purity of a synthesis product
- Inorganic Chemistry: Checking the elemental composition or purity of a synthesis produce
- Analytical Chemistry: Develop methods to characterize different molecules, such as proteins
- Environmental Chemistry: Quantify different contaminants throughout the environment (e.g., pesticides)
- Physical Chemistry: Development of techniques used within an MS instrument
- Physics: Development of techniques used within an MS instrument
- Biology: Confirm the expression of a specific protein variant in a sample
Fundamentally, MS works by ionizing a molecule and measuring the mass-to-charge ratio (m/z), where mass is in units Daltons (which is considered equivalent to g/mol). To do this, an MS instrument has 3 different major components:
- ionization source
- mass analyzer
- detector (which we will not discuss)
The first step for an analyte is to become an ION (hence the need for an ionization source). Without a charge on the analyte, we cannot calculate the m/z (since z = 0) and cannot measure the molecule. Ionization can occur via the addition of a positively-charged ion (H+, Na+, K+, etc.) or via loss of charge (losing an electron, losing an H+ via deprotonation). (Of note, instruments can measure in either POSITIVE or NEGATIVE mode, where they measure positive and negative ions, respectively.) The introduction of each of these species is dependent upon the sample preparation of the solution. Furthermore, molecules can also have multiple charge states, meaning +1, +2, etc., depending upon the size of the molecule.
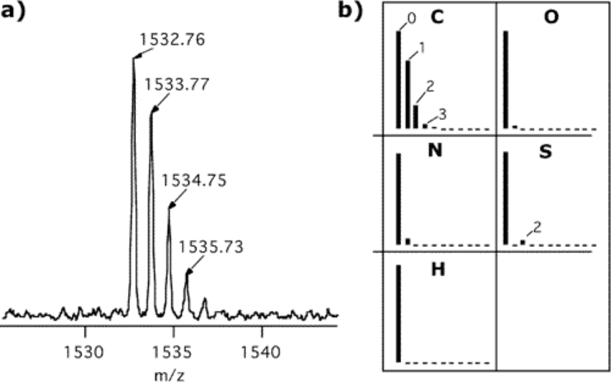
To add to the complexity, mass analyzers (which are the pieces of the instrument that actually measure the mass!) are able to see even the minor isotopic difference between molecules. All elements have isotopes; for example, carbon can be carbon-12 (~99%), carbon-13 (~1%), or even carbon-14 (~0.1%). A solution that contains many ions of the sample multiple could be present with different isotopes. In the mass spectrum (a graph of m/z (x-axis) versus signal intensity (y-axis)), this results in a visible “isotopic envelope” for each charge state/ionization method combo. Figure 1 shows an example of an isotopic envelope generated by an organic molecule that include carbon, oxygen, nitrogen, sulfur, and hydrogen.
With all this considered, in the mass spectrum of a single molecule injected into the MS instrument could result in more than 1 peak. In fact, it could result in 10s of peaks! All of those peaks can only been seen, though, with the correct mass analyzer. Each mass analyzer has different resolutions (i.e., resolving power), or their ability to see small differences in mass (or m/z). This is particularly useful for molecules that have VERY similar masses (only different in the hundredths place, for example). If molecules have similar masses, in low resolution mass spectra, these multiple peaks will merge and look like a single peak. Finally, peaks will only be visible in a mass spectrum if that peak is in the mass range instrument (i.e., the range that the MS scans to measure the mass of the ions).
To summarize, instrument and sample preparation choices play critical roles in what a mass spectrum may look like!

Lab Concept Video
click here to hide the video (for printing purpose).
N/A
Pre-lab Work

Lab Skills
Review these lab skills videos prior to lab.
click here to hide the video playlist (for printing purpose).
N/A
Key Takeaways
- N/A
Extra Resources:
click here to hide the video (for printing purposes)
N/A
Prelaboratory Exercises
- Fill out the following table using pubchem to find the accurate mass and then calculate each measurable mass-to-charge ratio (m/z). Note which of the ions would be measured by POSITIVE mode vs. NEGATIVE mode in the MS instrument. You can assume that the instrument used measures integers only (i.e., low resolution). (NOTE: Each chemical is linked to their LC-MS data in pubchem. This is reference information for the lab, but it is not necessary to look at for the pre-lab questions.)
| Accurate Mass | [M+H+] | [M+2H+] | [M+Na+] | [M-H+] | [M-e–] | |
| Caffeine | ||||||
| Theophylline | ||||||
| Theobromine | ||||||
| Sucralose | ||||||
| Aspartame |
2. Draw the expected, mass spectrum (at low resolution, meaning the instrument can only measure integers) spectra of caffeine [M+H+] in the mass range of m/z 50-200.

Before You Take The Quiz on Canvas
- Understand the structure of a mass spectrum and how a mass spectrum is generated.

Experimental
For this lab, you will rotate between 2 different activities:
ACTIVITY A: Lab Tour
The goal of this portion of the lab period is to show you the variety of different mass spectrometry instruments that exist in our department and their different applications. You will get to see mass spectrometry instruments that have different front end-separations (S), ionization sources (I), AND different types of mass analyzers (M), as noted below. In your lab notebook, make qualitative observations on each instrument. What do they look like (size, shape, etc.)? What applications are they used for? Which ones look the coolest or make you the most curious; why? What applications are is each instrument used for? Once you are done with the tour, you will be asked to quantify the resolution and mass range of each different mass analyzer via searching the vendors’ websites (make sure to cite where you found this information in your notebook!). If you cannot find specifics on that instrument, find general information from reliable sources. Pick the “best” instrument, providing a brief explanation. (All tour spaces require googles to be worn. A lab coat is not required.)
- Analytical Instrumental Lab (CHEM 8401)
- ICP-MS (Shimadzu ICPMS-2030)
- F: N/A
- I: Inductively Coupled Plasma (e–)
- M: Single Quadrupole
- GC-MS (Shimadzu GCMS-SP2010S)
- F: Gas Chromatography
- I: Electron Impact (e–)
- M: Single Quadrupole
- ICP-MS (Shimadzu ICPMS-2030)
- SynCat (CHEM 7415)
- LC-MS (Waters Acquity H-Class+ UPLC-UV-MS)
- F: Liquid Chromatography (single column, mL/min flow rate)
- I: Electrospray Ionization (H+)
- M: Single Quadrupole
- LC-MS (Waters Acquity UPC2-UV-MS (SFC-MS))
- F: Liquid Chromatography (multiple columns, mL/min flow rate)
- I: Electrospray Ionization (H+)
- M: Single Quadrupole
- LC-MS (Waters Acquity H-Class+ UPLC-UV-MS)
- Smith Lab (CHEM 4201/4206/4219)
- LC-MS (nanoUPLCS connected to Thermo Fusion Lumos)
- F: Liquid Chromatography (nano flow, nL/min flow rate)
- I: Electrospray Ionization (H+)
- M: Quadrupole & Orbitrap & Ion Trap (called a tribrid)
- LC-MS (nanoUPLCS connected to Thermo QE HF)
- F: Liquid Chromatography (nano flow, nL/min flow rate)
- I: Electrospray Ionization (H+)
- M: Quadrupole & Orbitrap (called a hybrid)
- LC-MS (nanoUPLCS connected to Thermo Fusion Lumos)
ACTIVITY B: Data Analysis
In previous labs, such as the High Performance Liquid Chromatography lab, we analyzed tea to identify and quantify different species, such as theophylline, theobromine, and caffeine. We will now investigate how to analyze those (and similar molecules) using mass spectrometry.
We will now compare the spectrum you drew for caffeine in the pre-lab question above to 2 different databases.
-
- Compare the LOW RESOLUTION spectrum you drew in your pre-lab question to that collected by LC-MS found on pubchem. Make some observations about the differences in your lab notebook. Propose a reason why the Pubchem spectrum has m/z peaks well below the expected m/z of just caffeine alone. Specifically, identify how is the molecule’s CHARGE STATES are considered in the generation of this spectrum.
- Compare the spectrum you drew in your pre-lab question to that collected by electron ionization (EI) found on NIST. Make some observations about the differences in your lab notebook. Propose a reason why the NIST spectrum has m/z that surround all the major peaks (e.g., 194, 109, 82, etc.). Specifically, identify how the molecule’s ISOTOPES are considered in the generation of this spectrum.
- Knowing what you know now, redraw your pre-lab question spectrum, if needed. (HINT: You should draw ~6-10 lines if you drew this correctly.)
Now, we are going to think about identifying and quantifying caffeine in a mixture. Using the table you developed in the pre-lab questions (and the links above), answer the following questions:
- Using the information from the table, using only a mass-only based separation (POSITIVE or NEGATIVE mode), can we differentiate between the 5 molecules above? (YES or NO)
- Looking at pubchem and clicking around the provided links, does the LC-MS spectra of each molecule support your claim above? Write down major differences between how the data was collected (e.g., how was the ion created? What mode was it measured in?). Can you use the information provided to determine if your original decision above is true?
- If not, explore “MassBank” (by clicking the “Ascension ID” link) to see if there is any difference between the molecules that can be used to differentiate between them using a mass-based only separation. These differences could be spectral, physical, etc.
- Using what you learned, draw a mass spectrum that would represent a mixture of these 5 compounds in the m/z 50-500 ionized via addition of H+ (and only singly-charged ions are created). Label the identity (or identities of each peak.
PROTIP: Data can feel overwhelming, and you can forget what you click through very quickly. Take careful notes in your lab notebook to keep track of everything you are doing.
Post-Lab Work Up

Results/Calculations
Fill out the answer sheet for this experiment completely. All “post-lab” questions are integrated above in the activity.

Challenge Questions
Challenge questions are designed to make you think deeper about the concepts you learned in this lab. There may be multiple answers to these questions! Any honest effort at answering the questions will be rewarded.
- You find out that the actually instrument you will be working with has a mass range of m/z 300-1000. Describe how that would change your results for analyzing a mixture of caffeine, theophylline, theobromine, sucralose, and aspartame ionized via addition of H+ (and only singly-charged ions are created).
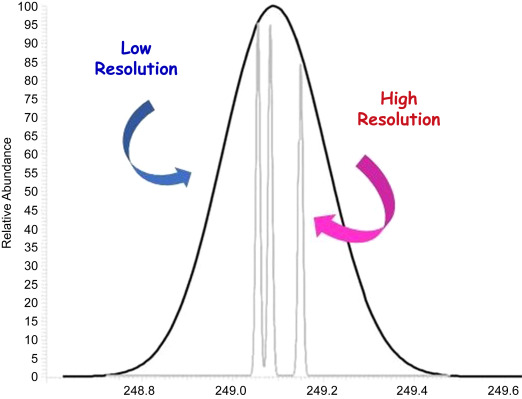
- Two spectra (x-axis = m/z) of the same sample were collected and overlayed, as shown below; one was collected with a low resolution (only measures integers) instrument, while one was collected with a high resolution (measures out to 0.XXXX) instrument. Explain, conceptually, (a) why the shapes are different between the two scans and (b) why more than one peak exists on the high resolution scan in comparison to the low resolution scan.
Lab Report Submission Details
Submit your lab report on Canvas as 1 combined PDF file. This submission should include:
- The completed answer sheet.
- Your lab notebook pages associated with this lab, which should include answers to the post-lab questions, key chromatographs and any graphs you generated related to the quantitative analysis of your sample(s).
The grading rubric can be found on Canvas.
References:
- Harris, D. C. & Lucy, C. A. Quantitative Chemical Analysis, 10th ed.; W. H. Freeman: New York, NY, 2020
Please use this form to report any inconsistencies, errors, or other things you would like to change about this page. We appreciate your comments. 🙂 (Note that we cannot answer questions via the google form. If you have a question, please ask your instructor or TA.)