Applications Of Liquid Chromatography
TOC/Help. Click to here expand/hide
Overview
Background
Pre-lab work
Experimental
Post-lab work
![]() For help before or during the lab, contact your instructors and TAs (detailed contact information are found on Canvas).
For help before or during the lab, contact your instructors and TAs (detailed contact information are found on Canvas).
Overview
In this experiment you’ll explore the impact of mobile phase and stationary phase compositions on the quality of separations of a mixture of commercial food dyes. The set of experiments will reveal the importance of molecule size, intermolecular forces, and solvent choices for three common liquid chromatography applications.
Learning Objectives
- Explore the basics of three liquid chromatography techniques: thin layer chromatography, solid-phase extraction, and molecular size exclusion.
- Gain practical experience with how the choices of mobile phase impact a separation of a mixture given the same stationary phase and components of the mixture.
- Understand the importance of polarity and molecular weight on the quality of separations using liquid chromatography methods.
To cite this lab manual: “Liquid Chromatography ”. A Manual of Experiments for Analytical Chemistry. Department of Chemistry at UW- Madison, Summer 2024.
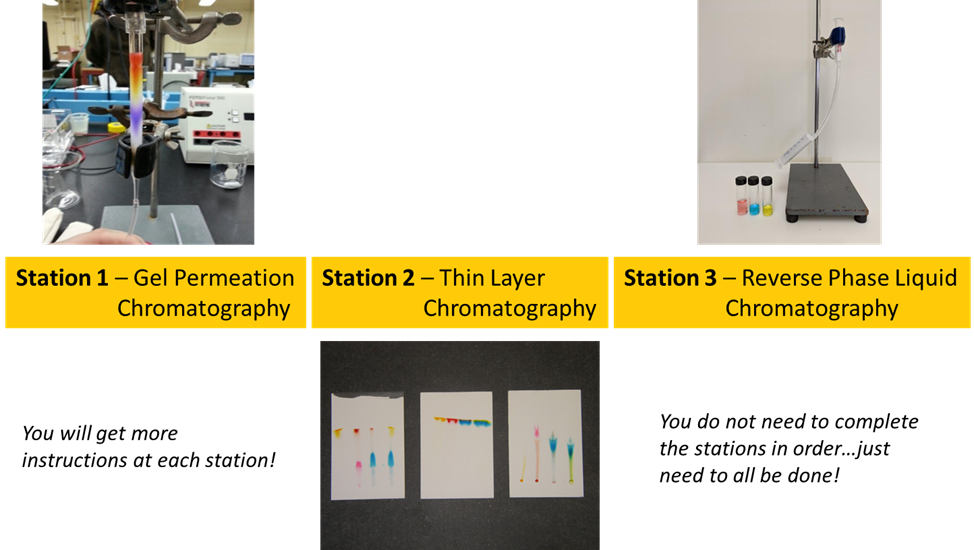
Visual Abstract

Background
This experiment is designed to introduce you to three different chromatography techniques: thin layer chromatography, gel permeation, and reverse phase liquid chromatography. You will use these techniques to separate mixtures of dyes. Colored compounds are used since they do not require special detection techniques, and you can watch the separations with your own eyes. The molecular structures of the dyes used are shown below.
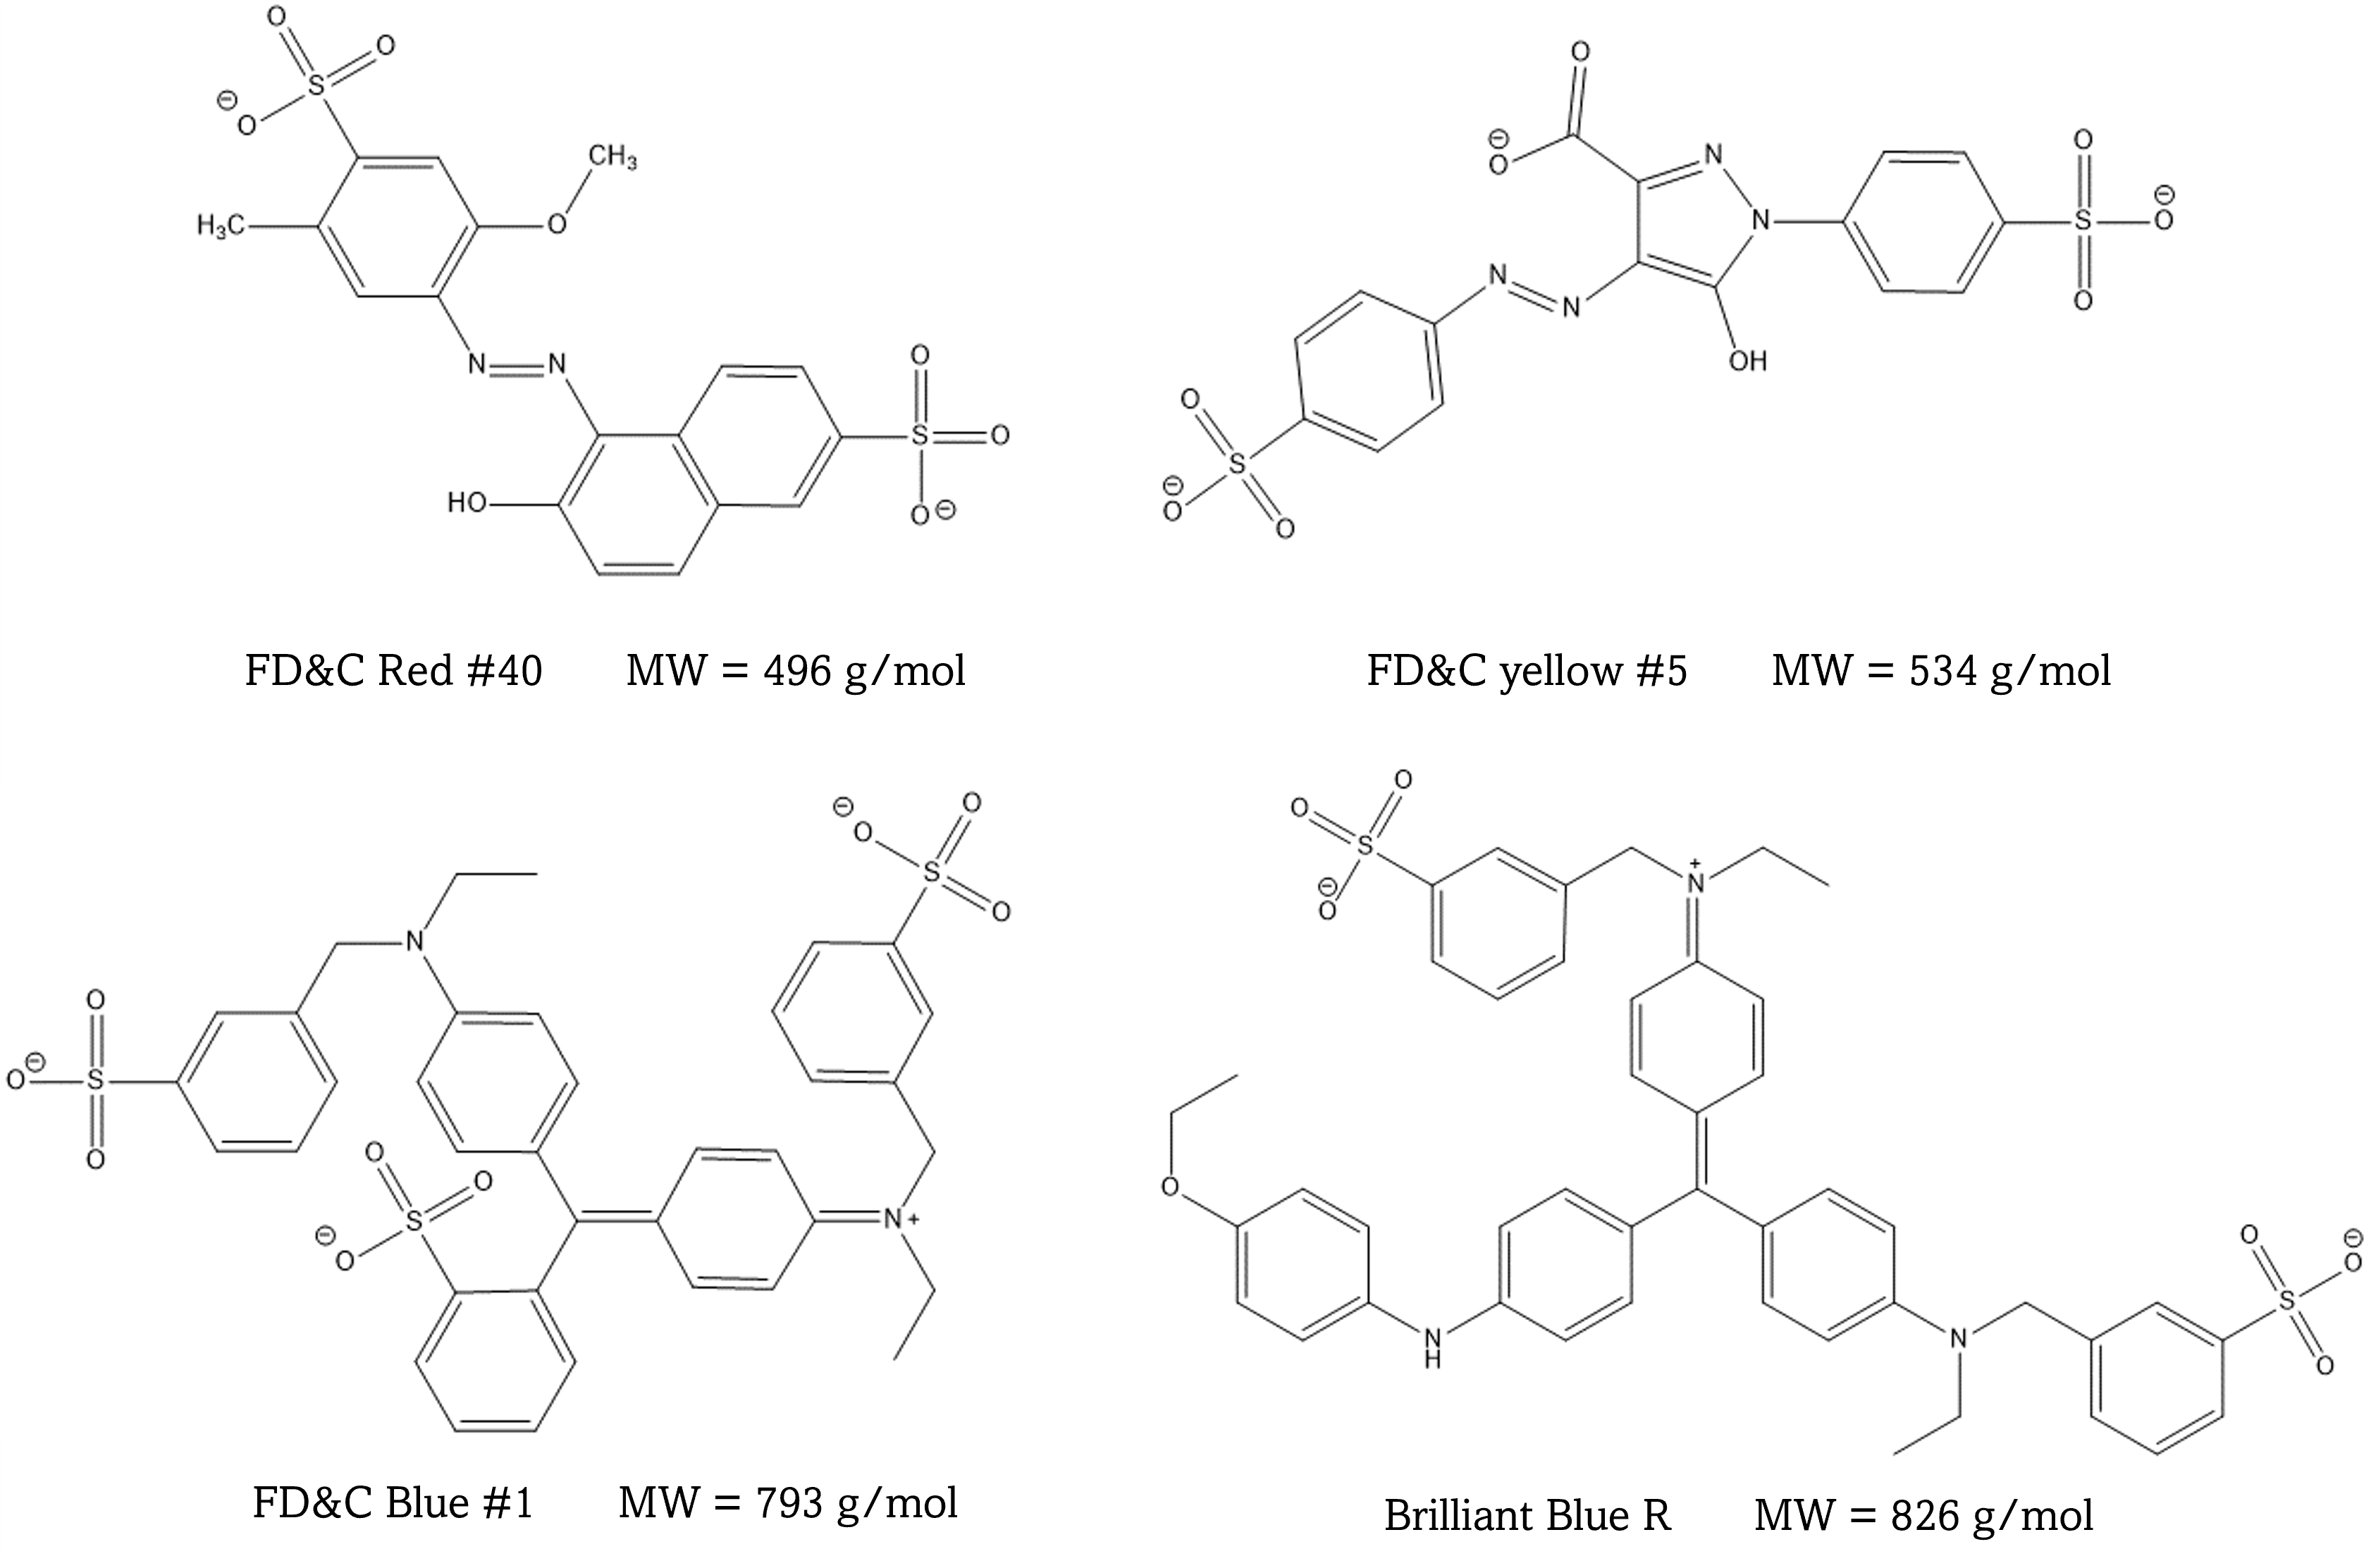
Described below are the three separation techniques you and your partner will investigate.
Gel Permeation Chromatography. Gel permeation chromatography is a non-interactive mode of chemical separation. Essentially a maze for molecules, a GPC column is packed with a stationary phase that has variously sized pores and pore networks. Sample molecules passing through the column migrate through some or all of the pores depending on their hydrodynamic volume (i.e. their size and shape). Large molecules cannot enter the pores of the stationary phase, so they elute very quickly from the column. Small molecules migrate into the pores created by the gel and elute much more slowly. Molecules are effectively separated according to molecular weight, since size scales with molecular weight, as they migrate through the column.
Thin Layer Chromatography (TLC). Thin-layer chromatography is one form of solid-liquid adsorption chromatography in which a solid adsorbent, about 100 to 300 μm thick, is coated on a piece of glass, plastic, or aluminum foil. To separate components in a solution, a drop of the solution is spotted near one edge of the plate, and the plate is placed upright in a developing chamber containing a layer of solvent as the liquid eluent. As the solvent migrates up the plate, components in the spot are carried at different rates, depending upon the strength of their adsorption to the solid layer. Differences in the distance of migration for components in the solution are used as the basis for the separation, and are expressed as values of Rf:
| [latex]R_f = \dfrac{distance\;moved\;by\;compound}{distance\;moved\;by\;solvent}[/latex] | (1) |
Note that all values of Rf must be less than or equal to 1, and that a value of Rf = 0 means that the compound has not moved from the original spot.
Common stationary phases include silica, with and without fluorescent indicator; alumina, cellulose, polyamide, and reverse-phase C18 on silica. Many solvents are used for developing the separations using TLC. Solvents are generally classified by their polarity into an eluotropic series, with more polar solvents having an increased ability to desorb polar molecules from the stationary phase.
Detection of the separated compounds can be accomplished using a variety of methods. If the compounds fluoresce under ultraviolet excitation, then a hand-held UV lamp can be used to see the spots. Chemical reagents can be used to visualize other compounds: ninhydrin spray reagent for amines; sulfuric acid spray for non-volatile carbon containing compounds; iodine. If the compounds are themselves colored, as in the case of the dye separation, then no detection reagent is necessary.
Reverse Phase Liquid Chromatography. There are a great number of HPLC methods based on reverse phase liquid chromatography. A column is packed with a non-polar bonded phase, and a polar mobile phase is pumped through the column. It is “reverse” phase simply because historically the first separations were carried out using polar bonded phases and relatively non-polar solvents. The separation depends on the continual partitioning of the sample between these two phases as it is carried through a column by the flowing mobile phase. Compounds in the sample which are less soluble in the mobile phase are retained longer on the column, while those that are more soluble in the mobile phase are eluted first.
In this activity you are going to develop a reverse phase chromatography method suitable for the separation of a food dye mixture. The stationary phase you will be using is a C18 bonded phase of the type commonly used in HPLC applications. Your column is just a small amount of this material in a plastic tube with a syringe fitting at one end. This will allow you to “pump” mobile phase through the column with a syringe. You will make your own mobile phase by mixing water and isopropanol. The relative amount of isopropanol allows you to control the polarity of the mobile phase and hence the partitioning of the solutes between the phases. The less isopropanol, the more polar the mobile phase, and the larger difference in polarity between the mobile and stationary phases.
The trick in separating analytes by partition chromatography is to get the analytes to retain on the column long enough to achieve separation, but not have them retain so well that you cannot get them off. Sometimes this requires changing the mobile phase during the run. This is called a gradient elution.

Lab Concept Video
click here to hide the video (for printing purpose).
Write down your observations or notes from the video in your lab notebook.
Pre-lab Work

Lab Skills
There is currently no lab skills video for this lab.
Extra Resources:
click here to hide the video playlist (for printing purpose).

Prelaboratory Exercises
Read the Introduction to Chromatography document in the manual before answering the questions below.
- List the dyes you will be analyzing in order of size—smallest to largest molecule.
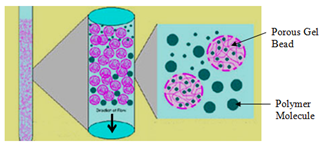
- The interior of the column you will make can be illustrated by the figure below, which shows cross-sections of the channel-filled particles. Predict whether the smaller or larger molecules will elute first based on the pathway opportunities available to traverse. Assume there are no other molecular interactions important to the separation other than the size of the molecule and the size and number of channels the molecule can access as it moves down the column.
- Would the retention time of the compounds increase or decrease if the SIZE of the pores are increased in the gel?
- The interior of the column you will make can be illustrated by the figure below, which shows cross-sections of the channel-filled particles. Predict whether the smaller or larger molecules will elute first based on the pathway opportunities available to traverse. Assume there are no other molecular interactions important to the separation other than the size of the molecule and the size and number of channels the molecule can access as it moves down the column.
- Now list the dyes you will be analyzing in order of polarity—from least polar to most polar. Remember that polarity is determined by the charge on a molecule and/or the molecular dipole moment resulting from polar functional groups (such as groups containing O or N). Polar molecules will be attracted to other polar molecules that will help stabilize the dipole moment or charge(s), but will actually be repelled by nonpolar molecules. The simple rule summarizing this phenomenon is “like dissolves like” or “like is attracted to like”. With this in mind, predict the retention order for the following combinations of mobile and stationary phases:
- A polar stationary phase/nonpolar mobile phase?
- A nonpolar stationary phase/polar mobile phase?

Before You Take The Quiz on Canvas
- Read the entire experiment and prepare your notebook with a procedure.
- Anwer the prelaboratory questions above, and have a hypothesis in mind as to how the differences in size, polarity, and types of functional groups may impact the time a molecule spends interacting with a stationary phase versus traveling along with the flow of a mobile phase.
- Be able to distinguish between the three types of chromatography you will be exploring in this experiment.

Experimental
As you go through the procedures, think about the important interactions or mechanisms occurring during the separation and justify the order of elution in each case. You don’t need to carry out the three experiments in any particular order.
PROTIP: Make sure you take photos of the experimental set up for each part and the results. At a minimum, you need:
- A picture of the gel permeation column as the sample makes its way to the exit.
- A picture of the vials collecting the eluent, and an estimate of the volumes collected for each color.
- A picture capturing the three TLC plates used for different solvents.
A. Procedure for Gel Permeation Separation of the Dye Mixture containing Brilliant Blue R, Red #40, and Yellow #5
- A pH = 7.0 phosphate buffered saline (PBS) buffer will be used as the eluent for the column. Prepare 100 mL of a 1× PBS (1 mM) buffer by diluting 10 mL of the 10× buffer in 90 mL of water. You also have a slurry of 1.0 g of SephadexTM G-25 (column packing material) in 25 mL of the 1× buffer. This slurry has been sitting for 3 hours to allow the gel to swell.
- You will build the column out of a glass transfer pipet. Score and cut the narrow end of the pipet so that the narrow end extends only 1 in. from the taper of the pipet. Attach a 3 in. piece of 1/16 in. I.D. tygon tubing to the end of the pipet and place a pinch clamp on the tygon tubing. The pinch clamp will serve as your shutoff valve. Add a small amount of glass wool to the pipet then add enough sand to make a 1 cm layer at the bottom of the pipet. Use a 1 in. piece of 1/4 in. I.D. tygon tubing to attach a plastic funnel to the top of the pipet and mount the apparatus on a ring stand. Use a transfer pipet to add the G-25 slurry to the column. You should notice a slow settling of the gel in the column. Open the column valve. Add more buffer as the buffer drains from the column and the gel settles. Add enough G-25 so that the packing fills the pipet up to the narrow in the pipet neck. Remember to make sure that the liquid in the column is high enough to keep the packing wet. Close the valve when the gel has settled and the buffer level is just at the top of the gel.
- Using an extended length pipet tip, gently apply a 20 μL drop of the dye mixture to the top of the packing material. Open the stopcock briefly to place the sample in the gel. After the sample is below the top of the gel, add buffer to fill the column and the funnel.
- GPC columns often employ single channel or multichannel visible or UV detectors. For this exercise, the eluent will simply be collected dropwise. Open the stopcock to start the separation. Try to collect as pure of fractions of the colors as possible into the 3 sample vials. Record an approximate volume for each fraction.
B. Procedure for TLC of the Dye Mixture containing Red #40, Yellow #5, and Blue #1
- Cut three pieces of Silica TLC paper 5 cm by 1.5 cm for the stationary phase. With a pencil, mark a line (lightly) 1 cm from the bottom of each plate. This is where you will spot samples.
- Add mobile phase to the TLC developing jar so that the solvent is less than 1 cm deep (~5 mL) at the bottom of the jar. You will set up three different jars with different mobile phases. The three mobile phases are (#1) 50/50/0, (#2) 50/30/20, (#3) 10/10/80 in 1-butanol/acetone/water. Wet a piece of filter paper with the mobile phase and place it into the developing jar in contact with the solvent. This will help saturate the air in the developing chamber with mobile phase vapor to prevent solvent evaporation as it migrates toward the top of the plate.
- Use the tip of a plastic pipette to spot the samples onto the plates. A few milligrams of compound in 0.1 mL of solvent is usually adequate for TLC analysis. Don’t let the spot size on the plate become too large: 1-2 mm is typical.
- Place the spotted plates into the developing chambers. Make sure that the height of the mobile phase is below the spot(s) on the plate. When the solvent front reaches a point about 1 cm below the top of the plate, remove the plate from the chamber and immediately mark the solvent front, since the mobile phase will evaporate quickly.
- Let the plate dry. Measure the distance from the original spot to the solvent front, and from the original spot to each compound spot, then calculate Rf for each compound in each mobile phase.
C. Procedure for Reverse Phase Separation of the Dye Mixture containing Red #40, Yellow #5, and Blue #1
In this activity you are going to develop a method suitable for the separation of the dye mixture using the small C18 column and water/isopropanol mixtures. Chromatography method development is done by insightful trial and error. You choose a mobile phase, try the separation, and alter the mobile phase based on your findings. The following steps outline the procedure for a single trial.
- Prepare the stationary phase by flushing the column with isopropanol and then water. A few mL of each should be sufficient.
- Add 40 uL of the sample to the top of the stationary phase. Gently push a small amount of air through the column so that the sample is placed directly on the stationary phase.
- Push mobile phase through the column and observe. Think and decide.
- Start at Step 1 with a new mobile phase.
Use your method to collect as pure of fractions of the colors as possible into the 3 sample vials. Describe your method and the results.
Post-Lab Work Up

Results/Calculations
Fill out the answer sheet for this experiment completely. Answer the following post-lab questions.
- Be sure to state experimental objectives and a succinct description of your methods for each experiment you perform. Be clear on the experimental choices you and your partner decided to explore when directed to create variable conditions for the method.
- Include photos of your results to support your conclusions. At a minimum:
- A picture of the gel permeation column as the sample makes its way to the exit.
- A picture of the vials collecting the eluent, and an estimate of the volumes collected for each color.
- A picture capturing the three TLC plates used for different solvents.
- For each method, report on the order of elution of each sample (based on color). Provide justifications (mechanisms or molecular interactions) for the observed order of elution for each dye.
- Report Rf for all analytes for the TLC methods.

Challenge Questions
1. Sephadex, the stationary phase used for the molecular exclusion part of this lab, has many varieties. Using the table below, which would be the best form of Sephadex for us to use to separate our dye molecules? Is this the same as what we use in the lab? If so, what is the difference between these 2 stationary phases?
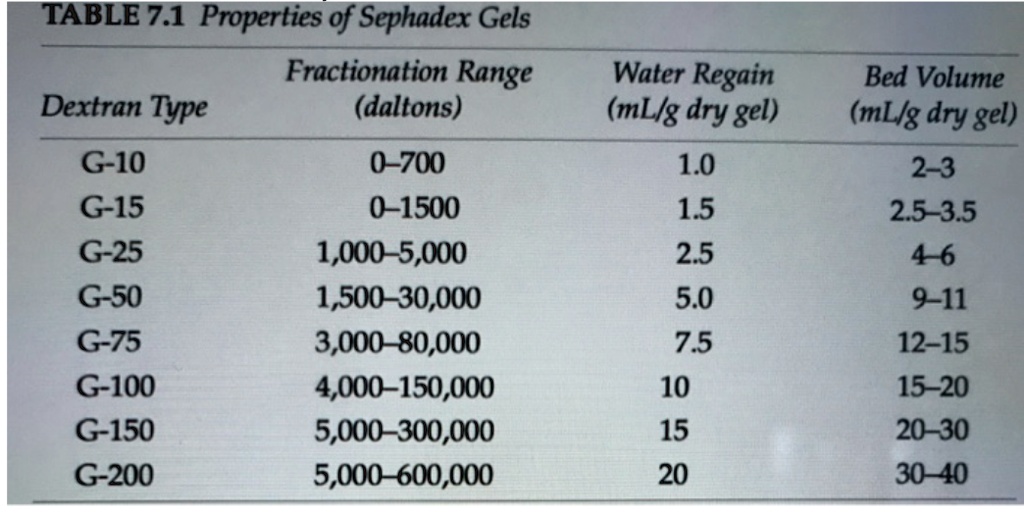
2. You now can see that we do NOT use the correct type of Sephadex for the size of our molecules. Propose a reason why, using the (individual subunit) structure of Sephadex- G-25 (which polymerized in its final form) and our mobile phase (pH=7.0 phosphate buffered saline) in your explanation. (HINT: Is this separation purely sized-based? Or could it be something else?)


Lab Report Submission Details
Submit your lab report on Canvas as 1 combined PDF file. This submission should include:
- The completed answer sheet.
- Your lab notebook pages associated with this lab, which should include answers to the post-lab questions.
The grading rubric can be found on Canvas.
References:
- Harris, D. C. & Lucy, C. A. Quantitative Chemical Analysis, 10th ed.; W. H. Freeman: New York, NY, 2020
Please use this form to report any inconsistencies, errors, or other things you would like to change about this page. We appreciate your comments. 🙂 (Note that we cannot answer questions via the google form. If you have a question, please ask your instructor or TA.)
