Spectrophotometric Determination of Iron
TOC/Help. Click to here expand/hide
Overview
Background
Pre-lab work
Experimental
Post-lab work
![]() For help before or during the lab, contact your instructors and TAs (detailed contact information are found on Canvas).
For help before or during the lab, contact your instructors and TAs (detailed contact information are found on Canvas).
Overview
In this experiment you will determine trace amounts of ferrous iron in a unique unknown sample using spectrophotometric methods.
Learning Objectives
- Apply concepts of absorption spectroscopy and complexation chemistry to determine the concentration of ferrous ion in an unknown sample.
- Construct a calibration curve for measuring the concentration of ferrous iron.
- Explore serial dilutions, as a way to prepare a set of calibration standards and practice precise delivery of solutions using a range of volumetric pipettes and flasks.
To cite this lab manual: “Spectrophotometric Determination of Iron”. A Manual of Experiments for Analytical Chemistry. Department of Chemistry at UW-Madison, Summer 2024.
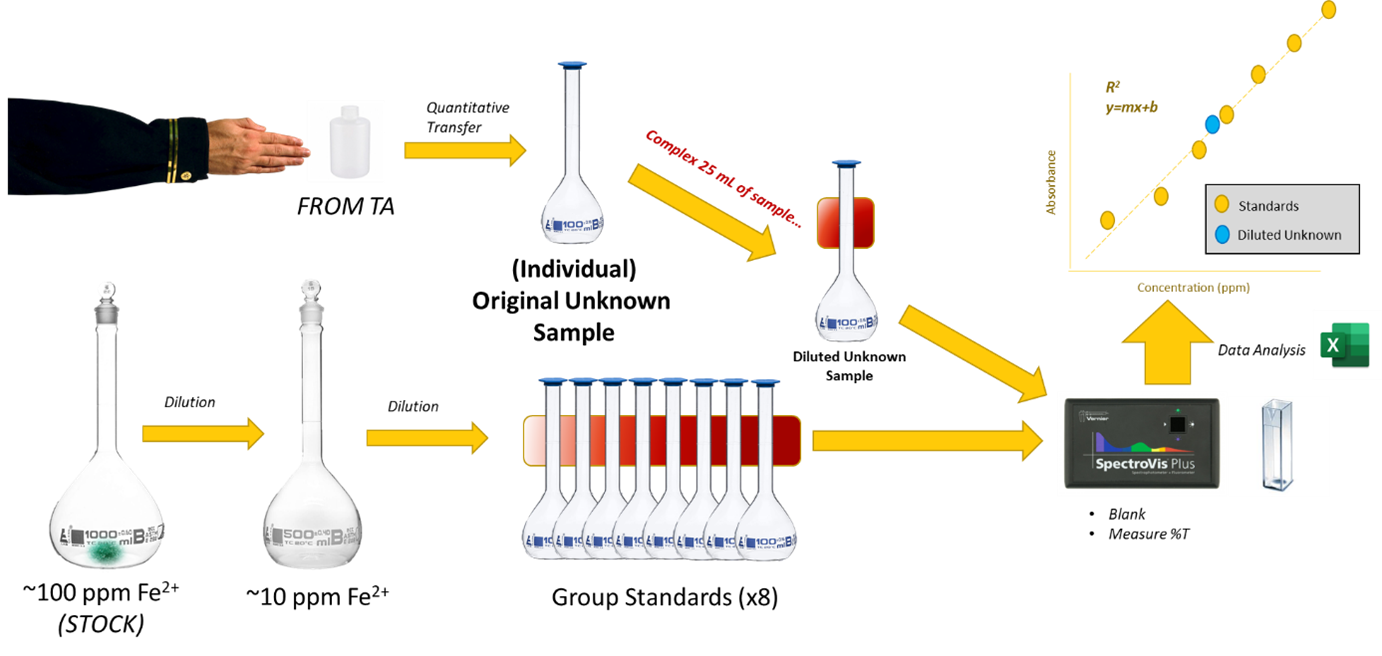
Visual Abstract


Background
The Chemistry
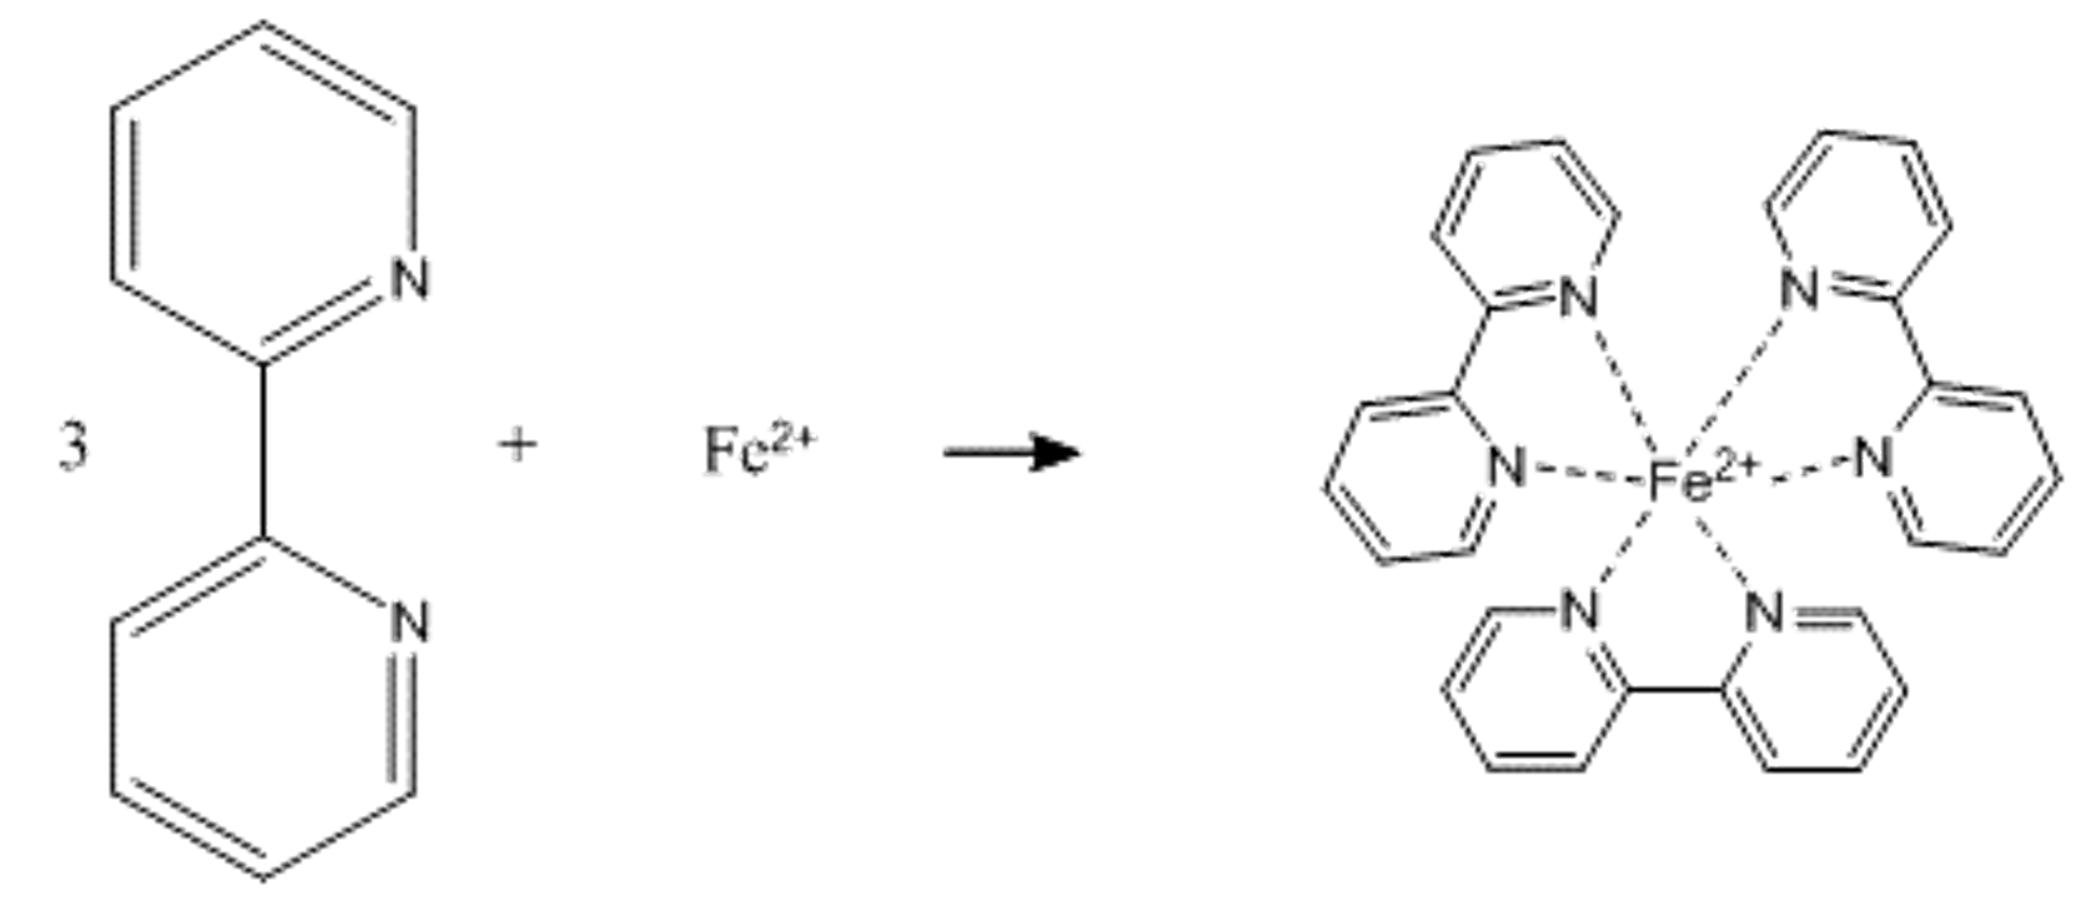
In solution, ferrous iron combines with 2,2’-bipyridyl to form an intensely red-colored complex that has a broad absorption band with a maximum absorbance at 522 nm (Fig. 1 and Fig. 2).


Moss and Mellon1 have shown that the color is developed rapidly and is very stable in the pH 3-5 range. In fact, colored solutions prepared under these conditions have been kept for up to three years without any noticeable change in intensity. For a set range of concentrations, Beer’s Law will work for this system, and therefore visible spectroscopy is an easy, cheap, and effective means to perform a quantitative analysis of Fe.
The experiment you will work through is well-defined and gives you a chance to practice performing the various manipulations important to forming the complex necessary for quantitative analysis. You should develop a clear understanding of the chemical function of each ingredient and rationale behind the chosen concentrations. Knowing these details for any standard method (such as this one) will allow you to modify the procedure as necessary to accommodate diverse sample types.
Standards are made with a ferrous containing compound since the sample and standards must exist in ferrous form for the analysis. The chemicals/ingredients need to be mixed/added in the sequence outlined in the procedure. Fe(II) oxidizes easily in water to Fe(III). Thus, the ferrous solution must be made fresh, and will not store well without additional chemicals to stabilize the ferrous ion. HCl is added to lower the pH, which increases the solubility of iron in solution and reduces the rate of the oxidation reaction, which starts the minute ferrous ion is released into an aqueous environment. Therefore, any Fe(III) should be chemically reduced back to Fe(II). Of several reducing agents suitable for this purpose, hydroxylamine hydrochloride has been found to be remarkably effective (Eq. 1).
| 2 NH2OH + 4 Fe3+ ⟶ N2O + 4 Fe2+ + H2O + 4 H+ | (1) |
The complex forms in a finite 3-5 pH range, thus acetate buffer is added to ensure the pH conditions are met. Finally, the complexing agent (2,2’-bibpyridyl) is added and IF ferrous ion is present, the characteristic red color should develop in solution. Sometimes it takes time for a complex to “age,” which refers to the kinetic process necessary for the complexing agent to fully coordinate with the cations in solution. Some procedures call for solutions to sit for as long as 30 minutes to allow the complex for fully form, although no wait period is necessary for this particular complex formation procedure.
The success of this method of analysis depends on proper buffering of the solution, presence of an effective reducing agent, and precise laboratory techniques.
The Application
In this experiment, you will receive a sample to transfer quantitatively into a volumetric flask and dilute to the mark. Your TA will assign you a specific volume of the sample, which, when diluted to 100 mL, will serve as your unique control sample. You should report the concentration of this 100 mL solution, which is the solution you prepared after the quantitative transfer of the volume provided by the TA. Your grade will partially depend on how closely your reported concentration matches the actual value determined by your TA.
There is a difference between ppm and mg/L units!
You will be using units of ppm to refer to the concentrations of Fe in both the standards and unknown (control) solutions. Technically, ppm refers to part-per-million and is a weight/weight ratio. For example, 1 ppm would be equivalent to 1 mg of the analyte (Fe) in 1 kg of sample. In this case, our sample is an aqueous solution. If we assume the density of water to be 1 g/mL, it’s usually okay to refer to 1 mg/L as equivalent to 1 ppm. Note this convention is only appropriate for aqueous and relatively low concentration units.

Lab Concept Video
click here to hide the video (for printing purpose).
Write down observations or notes from the video in your lab notebook.
Pre-lab Work

Lab Skills
Review these lab skills videos prior to lab.
click here to hide the video playlist (for printing purpose).
Key Takeaways
- Clean glassware will be critical to this lab, as the assay used is incredibly sensitive and can detect trace amounts of iron in your glassware.
- Volumetric glassware and good analytical technique using those pieces are critical components to measuring the amount of iron in a sample with confidence.
- Your success using the spectrophotometer depends upon you understanding the nuances of the instrument and setting up the instrument correctly.
Extra Resources:

Prelaboratory Exercises
The following questions should be completed in your laboratory notebook before you take the quiz, and especially before you start the lab.
- Write out the chemical reactions important to the formation of the Fe(II)-2,2-bipyridyl complex. Note the importance of each chemical component and the order in which they should be added.
- Based on what you know about the chemistry, propose what might happen should you forget to add the hydroxylamine when preparing the solution?
- In the procedure below, you are directed to add 1 mL of 1 M HCl to the mixture made in a 100 mL flask. What is the pH of the solution AFTER HCl is added and BEFORE the acetate buffer is added? Assume the addition of HCl will fully control the pH.
- Based on what you know about the chemistry, propose what might happen should you forget to add the acetate buffer when preparing the solution.

Before You Take The Quiz on Canvas
- Review the calibration curve technique and how it is used in this experiment.
- Review the chemistry involved with forming the colored complex.
- Be able to calculate the precise concentration of iron(II) for a solution prepared from ferrous ammonium sulfate hexahydrate.
- Be able to calculate the precise concentration of the iron(II) standards given the precise concentration of the 100 ppm iron(II) stock solution.
- Be able to calculate the concentration of iron(II) in the undiluted unknown (solution prepared in step 3) from a calibration curve and the absorbance of the sample prepared from the unknown solution (‘Sample’ solution prepared in step 4).
- Be able to convert between units of transmittance and absorbance.

Experimental
Equipment Needed:
- 5, 10, 25, 50 mL pipets
- 10 – 100 mL volumetric flasks
- 1000 mL volumetric flask
- 500 mL volumetric flask
- 9 – plastic storage bottles
- 50 mL buret (optional)
- 100 ppm Iron Solution (MAIN STOCK). In a 400 mL beaker, add 5 mL of 6 M HCl to about 250 mL of water. Dissolve 0.7022 g of ferrous ammonium sulfate (FAS; Fe(NH4)2(SO4)2·6H2O) in the acidified water. Transfer to a 1000 mL volumetric flask and dilute to the mark with deionized water. Mix well.
- 10 ppm Iron Solution (WORKING STOCK). Pipet 50 mL of 100 ppm iron solution into a 500 mL volumetric flask. Dilute to mark with deionized water and mix well.
- Unknown Solution. Turn in a clean 10 oz. plastic bottle labeled with your name to your laboratory instructor. When you receive your unknown solution, quantitatively transfer to a 100 mL volumetric flask, dilute to the mark with deionized water and mix well. DO THE QUANTITATIVE TRANSFER FIRST. The resulting 100 mL solution serves as the “prepared sample” in Table 1.
- Preparation of Standards, Blank and Sample. Label nine 100 mL volumetric flasks according to the following scheme (0.5 ppm, 1.0 ppm blank, sample). Prepare the nine solutions following the block outline in Table 1.
Table 1. Preparation of ferrous standards, blank, and sample. Standard Solution Conc (right)
Reagents (mL) (down, in order)0.5 ppm 1.0 ppm 2.0 ppm 3.0 ppm 4.0 ppm 5.0 ppm 7.0 ppm Blank Sample Unknown solution
(This is an aliquot of the 100 mL solution prepared in step 3.)– – – – – – – – 25 10 ppm Fe2+ Sol (step 2) 5 10 20 30 40 50 70 – – 1 M HCl 1 1 1 1 1 1 1 1 1 1% Hydroxylamine 5 5 5 5 5 5 5 5 5 2 M Sodium Acetate 2 2 2 2 2 2 2 2 2 0.1% Bipyridyl 10 10 10 10 10 10 10 10 10 Water Dilute to the mark BE SURE TO MIX WELL. Visually examine the solutions and place the sample solution next to the standard that appears to have the same intensity of color as the sample.
- Transmittance Measurements.
- If you have not previously used a spectrophotometer, consult the operating instructions and your laboratory instructor about the operation of the instrument assigned to you. Using the LabQuest to Collect Spectrophotometry Data contains instructions for using the Vernier visible spectrometer to collect absorbance or transmittance data. Proper technique for making this type of measurement is also explained in that document.
- Rinse a 1 cm square cuvet several times with small portions of the blank and then fill 3/4 full. Set the wavelength at 522 nm. Using the blank solution, calibrate the instrument to 100% T. Discard the blank solution and refill the SAME cuvet with the standard or sample solution. Be sure to insert the cuvet in the same orientation as you did the blank. Record your readings in %T, which will be displayed on the LabQuest readout.
- Take your data as much as possible by measuring from low to high concentrations. Do this by starting with the 0.5 ppm solution. Rinse the cell several times with 0.5 ppm solution. Then fill 3/4 full and measure the %T of the solution. Discard the solution in the cell and then rinse several times with small portions of the next (e.g., 1 ppm) solution, then fill 3/4 full and measure the %T of the solution. Repeat this procedure for the other standard and SAMPLE solutions proceeding from the lower to higher concentrations. Be sure to include the SAMPLE solution. Re-blank your spectrometer several times to check the 100% T setting is retained.
- Repeat the transmittance measurements for all eight colored solutions again, starting with the lowest (0.5 ppm) and proceeding to the next higher concentration.
Post-Lab Work Up

Results/Calculations
Fill out the answer sheet for this experiment completely. Answer the following post-lab questions.
- Convert the individual %T values to absorbance (A) values. Calculate an average A value for each measurement and use these average A values as you continue with your calculations.
- Prepare a working curve of average absorbance (A) against exact (meaning calculated from your mass of FAS weighed out) concentration of iron. Make sure to include the 0.0 A point from the blank you prepared (but do not force graph through 0). Include this plot with materials you hand in to your TA.
Pro Tip: Beer’s Law is valid (meaning a linear relationship) between 0.1 and 1.0 absorbance units. Before finalizing your graph, make sure to assess the linearity with your eyes and consider the validity of Beer’s Law. Remove points as needed.
- Using the working curve, determine the concentration (ppm Fe) of the UNKNOWN solution you prepared in step 3.

Challenge Questions
Challenge questions are designed to make you think deeper about the concepts you learned in this lab. There may be multiple answers to these questions! Any honest effort at answering the questions will be rewarded.
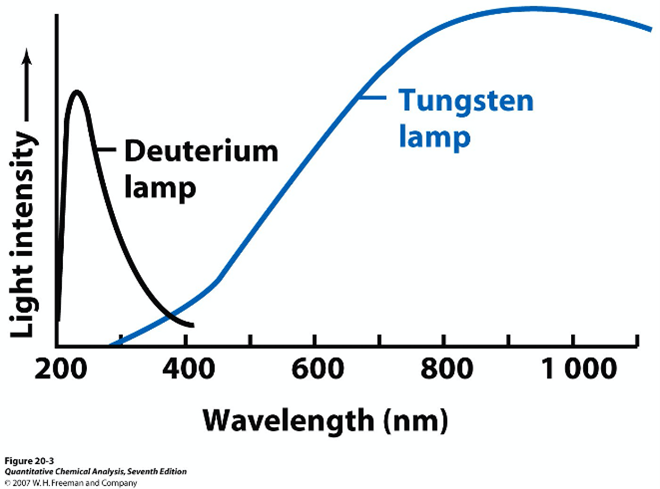
- Figure 3 displays the light intensity emitted by two sources common to spectrophotometry:
- The deuterium lamp, used for experiments utilizing absorbance or transmittance phenomenon in the UV region of the spectrum
- The tungsten lamp, common for applications in the Vis region.
Suppose a spectrometer in your lab ONLY has a deuterium lamp. What modifications would you need to make to the procedure to allow you to complete the experiment? How would the quality of your measurements be impacted? For example, do you predict the transmittance or absorbance measured for the current concentrations of the standards will increase or decrease? Do you predict Beer’s Law will still work for the system? Justify your answers using principles from lecture, the textbook, and your own experience in lab.


Lab Report Submission Details
Submit your lab report on Canvas as 1 combined PDF file. This submission should include:
- The completed answer sheet.
- Your lab notebook pages associated with this lab, which should include answers to the post-lab questions and challenge questions.
The grading rubric can be found on Canvas.
- Moss and Mellon, Ind. Eng. Chem., Anal. Ed., 14, 862 (1942).
- R. A. Day, Jr., and A. L. Underwood, pp. 383 392; 396 399.
- R. W. Ramette, pp. 138 140; 145 151.
- D. A. Skoog and D. M. West, Chap. 20; pp. 539 546.
- Harris, D. C. & Lucy, C. A. Quantitative Chemical Analysis, 10th ed.; W. H. Freeman: New York, NY, 2020
Please use this form to report any inconsistencies, errors, or other things you would like to change about this page. We appreciate your comments. 🙂 (Note that we cannot answer questions via the google form. If you have a question, please ask your instructor or TA.)
