Spike Recovery and Determining a Method Detection Limit (Fe)
TOC/Help. Click to here expand/hide
Overview
Background
Pre-lab work
Experimental
Post-lab work
![]() For help before or during the lab, contact your instructors and TAs (detailed contact information are found on Canvas).
For help before or during the lab, contact your instructors and TAs (detailed contact information are found on Canvas).
Overview
This experiment explores quality assurance practices which are commonly used to determine the limits, accuracy, and precision of an analytical method.
Learning Objectives
- Utilize the Quality Assurance method of a Spike Recovery to reveal whether or not the sample matrix interferes with the chemical measurement of an analyte.
- Utilize the Quality Assurance method of Method Detection Limit to learn the lower limit of detection for an analysis using absorbance spectroscopy.
- Predict the suitability of a method for a particular chemical measurement based on results obtained from Quality Assurance experiments.
To cite this lab manual: “Spike Recovery and Determining a Method Detection Limit – Fe-bipyridyl”. A Manual of Experiments for Analytical Chemistry. Department of Chemistry at UW- Madison, Spring 2025.
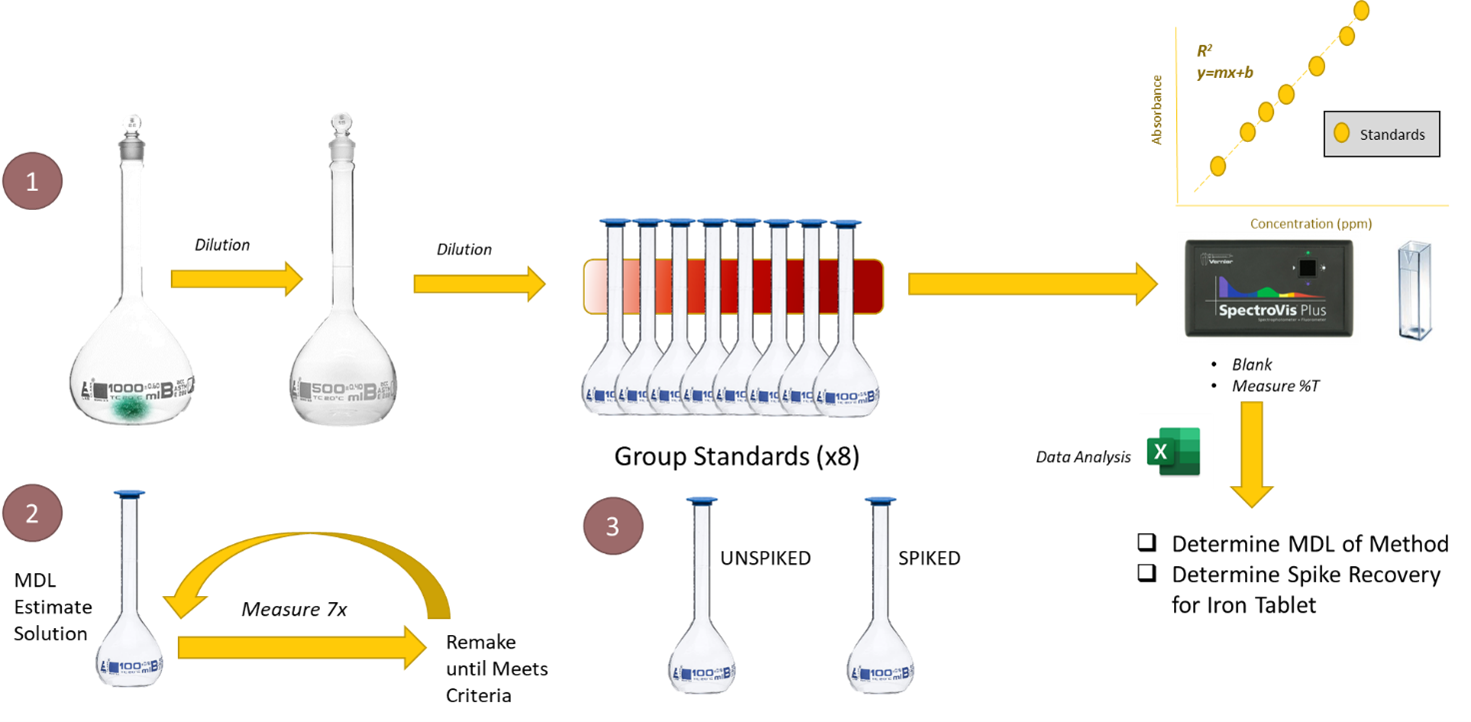
Visual Abstract


Background
The experiments you have done in this class and in your other lab courses are likely structured with the procedure clearly stated and the outcomes well known and explicitly defined. In fact, these experiments were once research questions that experimentalists developed to measure specific aspects of a system with an acceptable level of precision and accuracy. Quality Assurance is the practice of checking whether the right answer is achieved, essentially ensuring the user gets the right data, gets the data right, and KEEPS the right data every time a method is used.1 Method validation exists as part of Quality Assurance and is a means to proving a method is appropriate for all intended purposes.
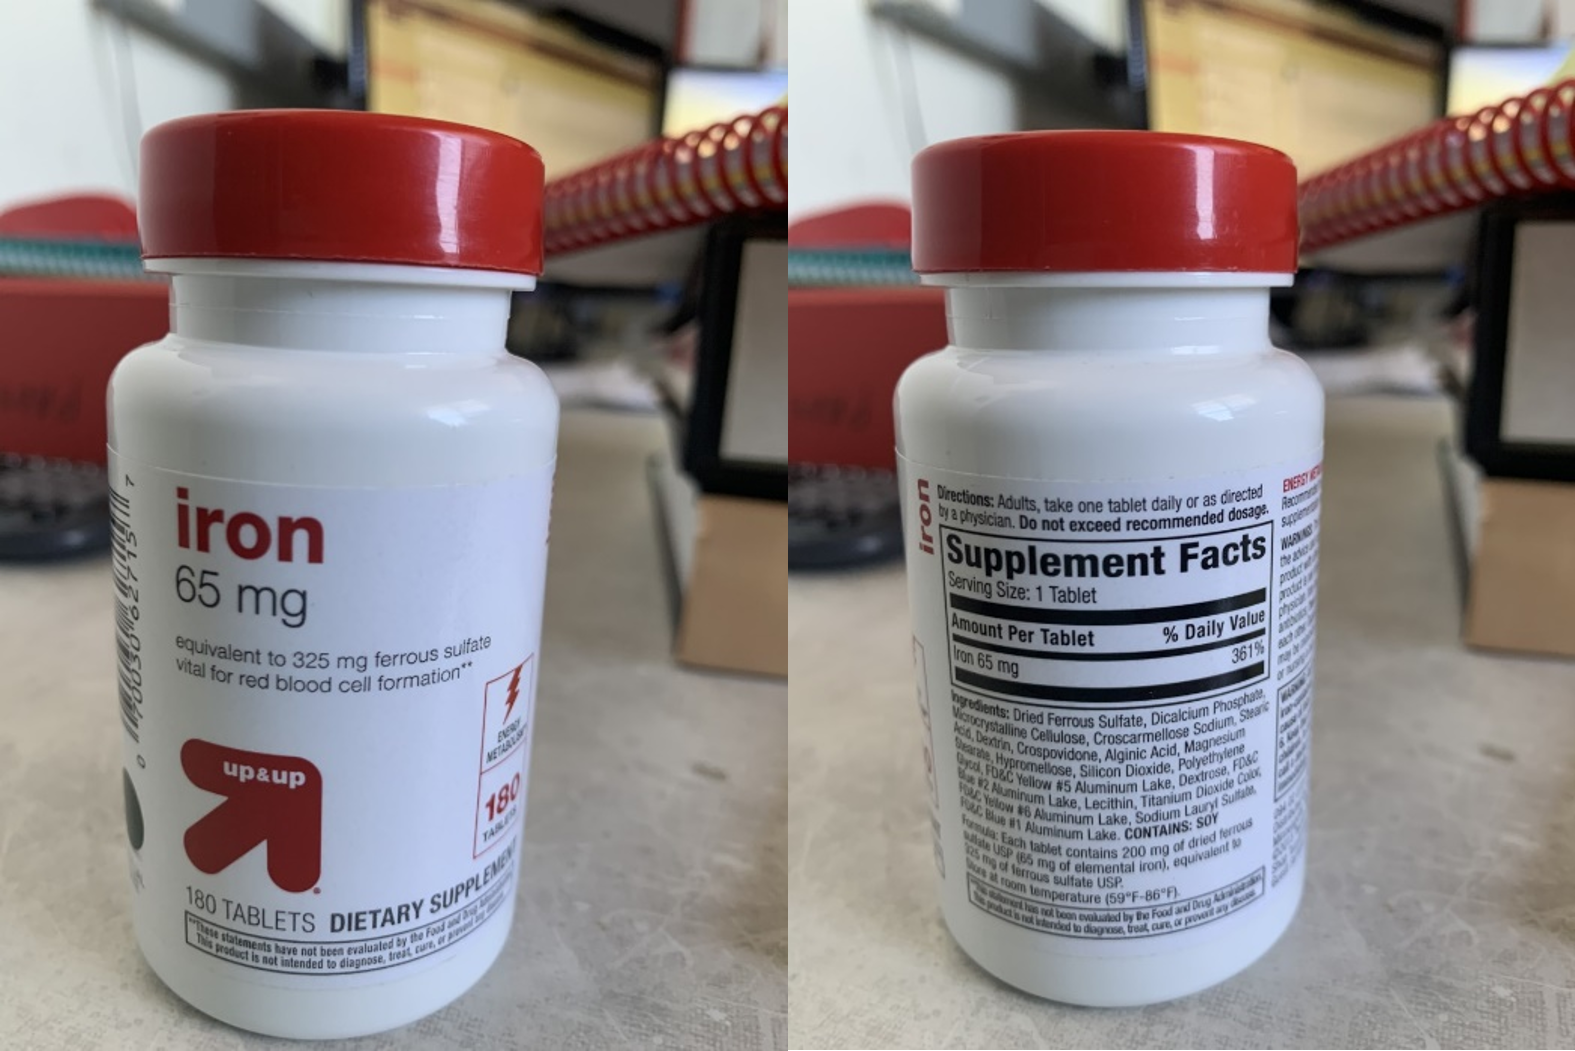
Imagine you work in a food hygiene testing lab, and your boss has just charged you with measuring the iron content in iron supplement tablets (see Figure 1). How do you pick the best method to do the job? How do you know whether your measurements meet a minimum level of accuracy and precision? How can you prove there are no interfering substances in your sample matrix that shifts your measured value from the true value? Quality Assurance best practices are how you would navigate these questions to ultimately defend your experimental choices and resulting data.

In this experiment, you will practice two commonly used quality assurance methods. One is the recovery of a known addition, or spike, of analyte to a sample. This method is used to determine whether a systematic shift occurs in the analytical signal of an analyte due to matrix effects. To determine the percent recovery of a spike, the sample is split into two portions and a known amount of a standard solution of analyte is added to one portion. The concentration of the analyte is determined for both the spiked and un-spiked portions. The percent recovery is calculated as:
| [latex]\%\;recovery = \dfrac{c_{spiked\;sample} - c_{unspiked\;sample}}{c_{added}} \times 100\%[/latex] | (1) |
where c stand for concentration.
The second quality assurance measure is to determine the method detection limit (MDL). The MDL is the smallest measurable concentration of analyte that is statistically different from the blank. The MDL is calculated as
| MDL = t(n-1, 99%)(s) | (2) |
for 99% confidence level for a one-tailed distribution and n-1 degrees of freedom.2 Read the truncated procedure from the standard Environmental Protection Agency (EPA) procedure carefully and use the method described as guidance in determining the MDL for the method. There are several ways to derive the MDL, and most of them involve estimating the “noise” (e.g., the standard deviation) of a measurement and then more accurately measuring the standard deviation (either of a sample or blank) with additional statistics. The Harris text, for example, presents a slightly different procedure for determining the MDL than the EPA, but for our purposes we will stick with the EPA procedure explained in the addendum to this experiment.
In the mock scenario of being tasked with learning the suitability of a method, how do you begin? Typically, the analyst will review the literature or other SOPs (Standard Operating Procedures) already known to identify some possible experiments to do the job. In this case, we already explored an easy, inexpensive, and straight-forward experiment for measuring iron in a solution by complexing the iron(II) with bipyridyl (see Spectrophotometric Determination of Iron). This seems like a good place to start!
The next step is to prepare the sample so the result can be measured using the intended method. What do we know about the sample? Iron in the sample is present in its ferrous form, and the sulfate (SO42-) is used to preserve the ferrous oxidation state. The sample is a solid and pressed into a tablet, probably using some sort of filler that is safe for human consumption. Can we be sure the ferrous sulfate will dissolve if we put it in water?
Concepts about solubility, which you may remember from general chemistry but also will be addressed in detail in this course, provide tools to answer that question. Let’s do a quick review of the solubility product constant (Ksp), but remember, for a more detailed review, you can always reference the Harris text. The solubility product constant represents the product of the equilibrium expression of the solute under standard temperature and pressure conditions. The Ksp of a species is a constant, which can be looked up in the product literature (such as an MSDS sheet) of the sample you’re interested in. Reference texts, such as the CRC handbook of Chemistry and Physics or the Merck Index, list this information. The reaction representing the dissolution of FeSO4 is represented as equation (3):
| FeSO4(s) ⇄ Fe2+(aq) + SO42-(aq) | (3) |
and the Ksp expression for FeSO4 is equation (4):
| Ksp, FeSO4 = [Fe2+][SO42-] | (4) |
where the Ksp of ferrous sulfate is 0.84 at room temperature3 (assuming that ferrous sulfate heptahydrate is formed once anhydrous ferrous sulfate is dissolved in water). Solving the equilibrium expression for the concentration of Fe2+ will allow you to learn the maximum concentration of soluble Fe before reaching a saturated solution.
Assuming we can proceed with the knowledge we can likely get the sample completely into solution (you should confirm this is the case), is there a way to design the sample preparation such that the result will fall into the operating range of an already developed method? This is a general chemistry question involving a simple dilution, which you will work out in the prelaboratory questions below.
Another question: are there other dyes in the sample that might interfere with the analysis? Well, the spike recovery can tell us more about that. All things considered, so far it seems like the bipyridyl complexation of Fe might be an inexpensive, fast, and accurate method for our analysis. We are in the discovery phase of learning whether the method will work or not. Let’s do some quality checks to confirm the hypothesis that the method is suitable.

Lab Concept Video
click here to hide the video (for printing purpose).
Write down observations or notes from the video in your lab notebook.
Pre-lab Work

Lab Skills
Review these lab skills videos prior to lab.
click here to hide the video playlist (for printing purpose).
Key Takeaways
- Clean glassware will be critical to this lab, as the assay used is incredibly sensitive and can detect trace amounts of iron in your glassware.
- Accurate (and precise) glassware will help you measure the amount of iron in a sample with confidence.
- Your success using the spectrophotometer depends upon consideration of the nuances of the instrument and setting up the instrument correctly.
Extra Resources:
- Using the LabQuest to Collect Spectrophotometry Data
- EPA Method for Determining the Method Detection Limit
- Making Scientific Plots
click here to hide the video (for printing purpose).

Prelaboratory Exercises
- Your boss advises you try to dissolve the tablet first in 100 mL of DI water. Your sample is a complex mixture of dye, analyte, and filler material. Provide a reasonable argument using what you know about solubility and chemistry, to convince a coworker or your boss that all is not lost if the sample looks to not completely dissolve.
- Estimate the MDL of the Fe-bipyridyl method as three times the standard deviation of a method blank, analyzed at 522 nm. Absorbance values of a method blank and the equation of the calibration line are given in the table below. The correct answer to this question will serve as the estimated MDL needed to prepare your MDL standard iron solution for the experiment. Hint: For the purpose of maintaining correct significant figures, the calculation should be done by converting A to concentration units before calculating for the MDL. The calibration equation was generated by measuring standard solutions (units: ppm) (x-values) and measuring their absorbance (y-values). The calibration equation does not contribute to significant figures.
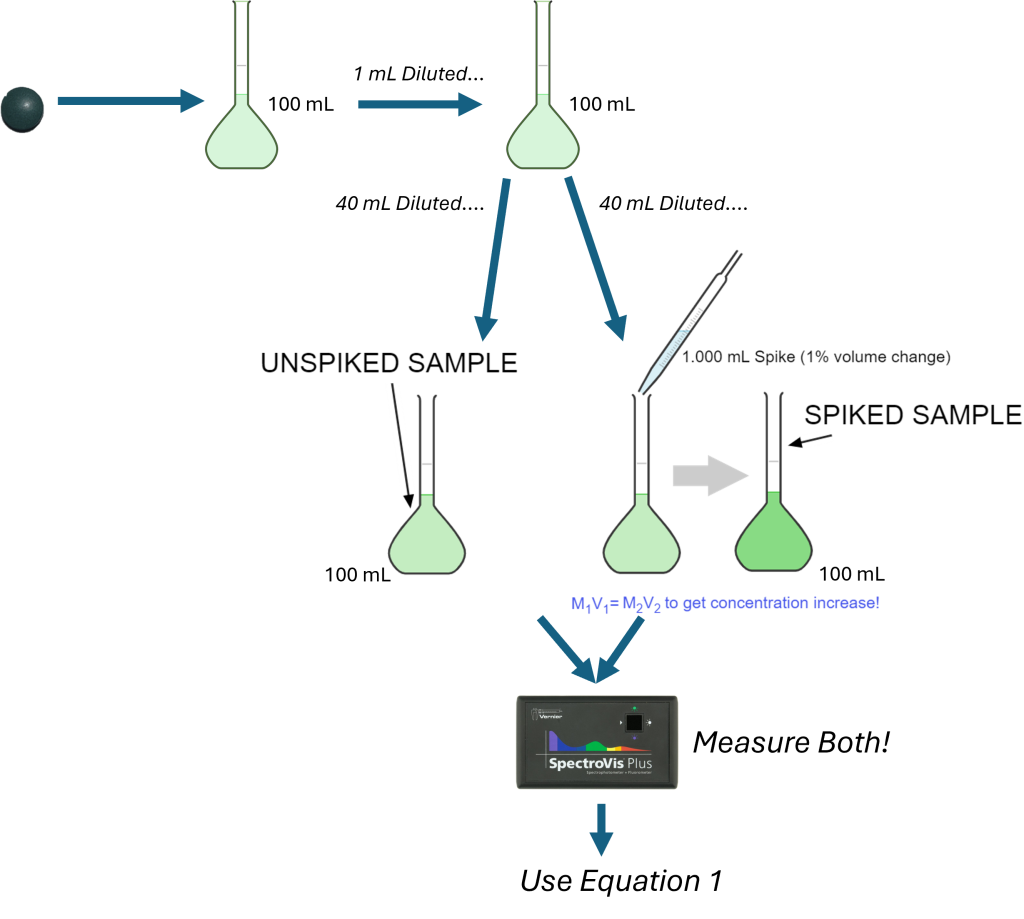
Blank Aliquot Absorbance 1 -0.003 2 0.003 3 0.001 4 -0.001 5 0.001 6 0.000 7 0.002 Calibration Equation: y = 0.166812x - 0.00666 - One pill of the iron supplement was crushed with mortar and pestle. The result was slurried with a few mL of DI water, and then quantitatively transferred to a 100.0 mL volumetric flask. Before diluting to the mark, a little HCl was added to ensure full dissolution of the iron material. After mixing, 1.000 mL of the stock sample solution was diluted to 100.0 mL using a volumetric pipet and a 100.0 mL volumetric flask. If we use a 40.00 mL aliquot to prepare the sample, estimate the concentration of the resulting 100.0 mL solution. Will this concentration fall within our current set of planned standards (see Experimental section below)? Use math to justify your estimate.
- Calculate what the estimated increase in iron concentration should be if a 1.000 mL spike of ~100 ppm Fe is used for the spike recovery test. This question only addresses the general calculation for the spike.
Pro Tips: Use the actual concentration of the spike solution you prepare in the lab when determining the results for the spike recovery analysis in the subsequent experiment.Here is also a photo that describes what would happen for pre-lab Q3 & 4:


Before You Take The Quiz on Canvas
- Know what an MDL is and what information/data is needed to calculate it.
- Know what a spike recovery is and what information/data is needed to calculate it.
- Understand why it is necessary to determine the MDL and to perform a spike recovery for an analytical method.
- Be familiar with Beer’s law and how to determine concentrations using absorbance data.
- Know what matrix effects are.
- Be comfortable with the calculations and experimental process of making dilutions from stock solutions.

Experimental
Create a Calibration Curve for the Determination of Iron
Prepare a set of iron standards using the instructions described in the Spectrophotometric Determination of Iron experiment. Plot the calibration curve and determine the linear regression for the curve.
Determine Amount of Iron in Tablet
Using either a prepared slurry or a whole tablet, prepare a solution that allows you to determine the concentration of iron in the tablet. Make sure that you prepare the final, complexed solution such that the final concentration of iron is within your calibration curve range.
Spiked Iron Sample
The prelaboratory question suggests one way to prepare the unspiked/spiked samples from the provided sample stock solution. (If you use the method described in this question, you should have already estimated the concentration of the diluted samples you prepared.) Be sure you’re preparing two samples—one is a spiked sample, while the other is an unspiked sample. Add a calculated volume of the spike solution (100 ppm Fe) to the other, SPIKED sample. Proceed with the steps described in the Spectrophotometric Determination of Iron lab to fully form the complex in preparation for the analysis. Measure the absorbance of the spiked and unspiked samples. Calculate the concentrations and determine the spike recovery for the experiment.
MDL Standard Ferrous Iron Solution
Prepare 100 mL of a standard iron solution with a concentration equal to the estimated MDL that you calculated in the prelaboratory exercises. Determine the concentration of iron in at least 7 aliquots of this standard solution using the Fe-bipyridyl method. Be sure to use the standard curve you prepare today to calculate the concentrations of the solutions. Check that your estimate meets the MDL criteria described in the manual. Note that you may need to make additional dilutions if the criteria are not met. If you do not meet the MDL described (meaning the estimated MDL does not match the solution used to determine that MDL), make sure your reflective summary discusses the limitations of the MDL you end up with.
Post-Lab Work Up

Results/Calculations
Fill out the answer sheet for this experiment completely. Answer the following post-lab questions.
- Using EXCEL, prepare a calibration curve using the absorbance values of the calibration standards. Turn in a copy of your calibration curve along with your notebook and answer sheet.
- Use the calibration curve to determine the concentration of Fe in the spiked and unspiked sample solution. Report on the percent recovery of the spike.
- Determine the amount of iron found in the tablet using the Fe-bipyridyl method. How does this compare to the bottle?
- The USP has studied the uniformity of dosage from tablets, and their tests implied that the mean content is between 98.5% and 101.5% of what is on the bottle. Did the Fe-biyridyl method confirm this? Or, are there some sources of error that could impact the accuracy of your measurement?
- Calculate the MDL for measuring Fe concentrations using the Fe-bipyridyl method. Is this method sensitive enough for measuring Fe in the tablet?
- In the reflective summary, write a short, data-driven report to your boss on the suitability of the Fe-bipyridyl method for measuring Fe in a dietary supplement.

Challenge Questions
Challenge questions are designed to make you think deeper about the concepts you learned in this lab. There may be multiple answers to these questions! Any honest effort at answering the questions will be rewarded.
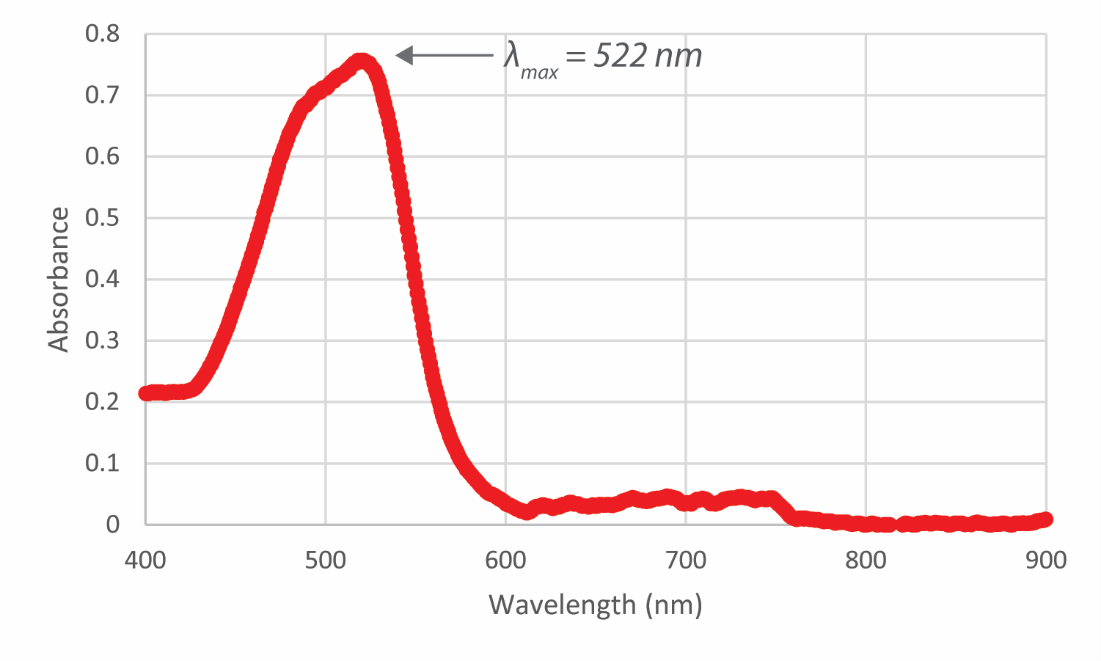
- Looking at the full wavelength spectra for the 7 mg/L Fe solution, do you think 522 nm is the best wavelength to analyze your data? Why or why not? How would it change your results above if you analyzed the iron data at a 450 nm wavelength? Make a prediction about the following results specifically:
- MDL
- if the assay would be sensitive enough to analyze the iron in the tablet
- the linearity of your calibration curve at the lower concentrations
- the spike recovery accuracy.


Lab Report Submission Details
Submit your lab report on Canvas as 1 combined PDF file. This submission should include:
- The completed answer sheet.
- Your lab notebook pages associated with this lab, which should include answers to the post-lab questions and challenge questions.
The grading rubric can be found on Canvas.
- Nancy W. Wentworth, U.S. Environmental Protection Agency
- Electronic Code of Federal Regulations, Title 40: Protection of Environment Part 136: Guidelines for Establishing Test Procedures for the Analysis of Pollutants, Appendix B: Definition and Procedure for the Determination of the Method Detection Limit—rev. 1.11
- PubChem. https://pubchem.ncbi.nlm.nih.gov/compound/Ferrous-sulfate
- Harris, D. C. & Lucy, C. A. Quantitative Chemical Analysis, 10th ed.; W. H. Freeman: New York, NY, 2020
Please use this form to report any inconsistencies, errors, or other things you would like to change about this page. We appreciate your comments. 🙂 (Note that we cannot answer questions via the google form. If you have a question, please ask your instructor or TA.)
