Lab 8 Procedure
ELISA Assay
- Obtain a set of samples with known concentration and put them on ice. The set of samples are wild-type T7 phages with the concentrations of 1010, 108, 106, 104, and 0.
- Take out the original phage stock put the tube on ice.
- Obtain a 12-well plate that contains filter papers in 6 of the 12 wells. The primary T7 antibody is conjugated on the filter papers.
- Add 150 μL of each phage solution into each well.
- Agitate the plate at room temperature on an agitator for 10 minutes.
- Using a 1 mL pipette, remove as much liquid as possible from each well of the plate. You can do so by tilting the plate ~45 degrees.
- Add 1 mL of PBS washing buffer into each well, agitate slightly, and remove all PBS buffer.
- Add another 1 mL of PBS into each well and agitate the plate on an agitator for 5 minutes.
- Remove PBS buffer.
- Add 1 mL of the secondary antibody solution into each well and agitate the plate at room temperature for 10 minutes.
- Remove the secondary antibody solution.
- Add 1 mL of PBS washing buffer into each well, agitate slightly, and remove all PBS buffer.
- Add another 1 mL of PBS into each well and agitate the plate on an agitator for 5 minutes.
- Remove PBS buffer.
- Obtain the DAB buffer.
- Add 200 μL of the DAB buffer onto each filter paper.
- Let it sit for 1 minute, and remove the DAB buffer.
- Leave the plate in your drawer (no light) for 30 minutes.
- Here is a video showing the basics of this process (please be aware that some procedures have been updated):
Imaging and Analysis
- Arrange the filter papers for all six samples on a paper protection sheet.
- Take a picture of the filter papers against a white background using your phone.
- Save the image.
- Download ImageJ from here or open the ImageJ software on the web browser.
- Go to “File” ->“Open” and open the scanned image.
- Before taking the measurement, go to “Analyze” ->”Set measurements” and check if the “Mean grey area” box is checked. If not, check the box and uncheck all other boxes.
- Use the rectangle tool to select the first filter. Make sure to include the entire filter paper but not too much larger.
- Go to “Analyze”->”Gels” ->”Select the first lane”. You should see a “1” appear on the gel
- Go to “Analyze” ->”Measure”. The grey area value should show up in a new window. Record the number in the notebook.
- Re-click on the rectangle.
- Go to “Analyze” ->”Gels” ->”Select next lane”. You should see a “2” appear on the gel.
- If it doesn’t work, move the first rectangle to another location and try again.
- Drag the rectangle so it covers the second filter paper. Make sure the letter 2 appear on the filter paper.
- Go to “Analyze” ->”Measure”. The grey area value should show up in the window that contains the measurement of the first filter paper. Record the number in the notebook.
- Repeat this step for the rest of the filter papers.
- Here is a video showing how to use ImageJ to process the data:
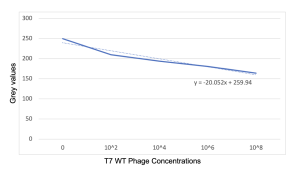
- You will use the T7 wild-type sample values to plot grey values vs T7 phage concentrations in Excel. This will be the standard curve to be used in calculating the concentration of your mutant phage sample.
- See an example in Figure 8.1 below (please note that the concentrations used are different).

Note: the values you recorded are the intensity of the color that is converted into the grey color by ImageJ. The formula used is [grey = (red + green + blue)/3]. The RGB color scheme uses a numbering scale ranging from 0 to 255 where the ‘black’ is numbered 0 and the ‘white’ is numbered 255, which means the lower the number, the darker the color.
- Here is a tutorial video on how to make the graph with the equation:
- Use the equation calculated by Excel to calculate the mutant concentration. To do so, plug in the analyzed value for the mutant in place of y in the equation, and then solve for x. The x value would be the concentration of your mutant phage.
- Record the concentration in your lab notebook.
