Study and Identification of an Unknown Weak Acid
TOC/Help. Click to here expand/hide
Overview
Background
Pre-lab work
Experimental
Post-lab work
![]() For help before or during the lab, contact your instructors and TAs (detailed contact information are found on Canvas).
For help before or during the lab, contact your instructors and TAs (detailed contact information are found on Canvas).
Overview
In this experiment you will explore the acid-base equilibrium chemistry of a weak polyprotic acid by way of potentiometric titration. You will also learn aspects of instrument building as you construct, calibrate, and then use an automated titrating system to collect data for this experiment.
Learning Objectives
- Apply concepts of acid-base chemistry to identify an unknown acid by titrating the sample with a strong base.
- Develop a mathematical model of the titration of a weak acid with a strong base.
- Compare the mathematical of the titration with the experimental result.
To cite this lab manual: “Study and Determination of an Unknown Weak Acid”. A Manual of Experiments for Analytical Chemistry. Department of Chemistry at UW- Madison, Spring 2025.
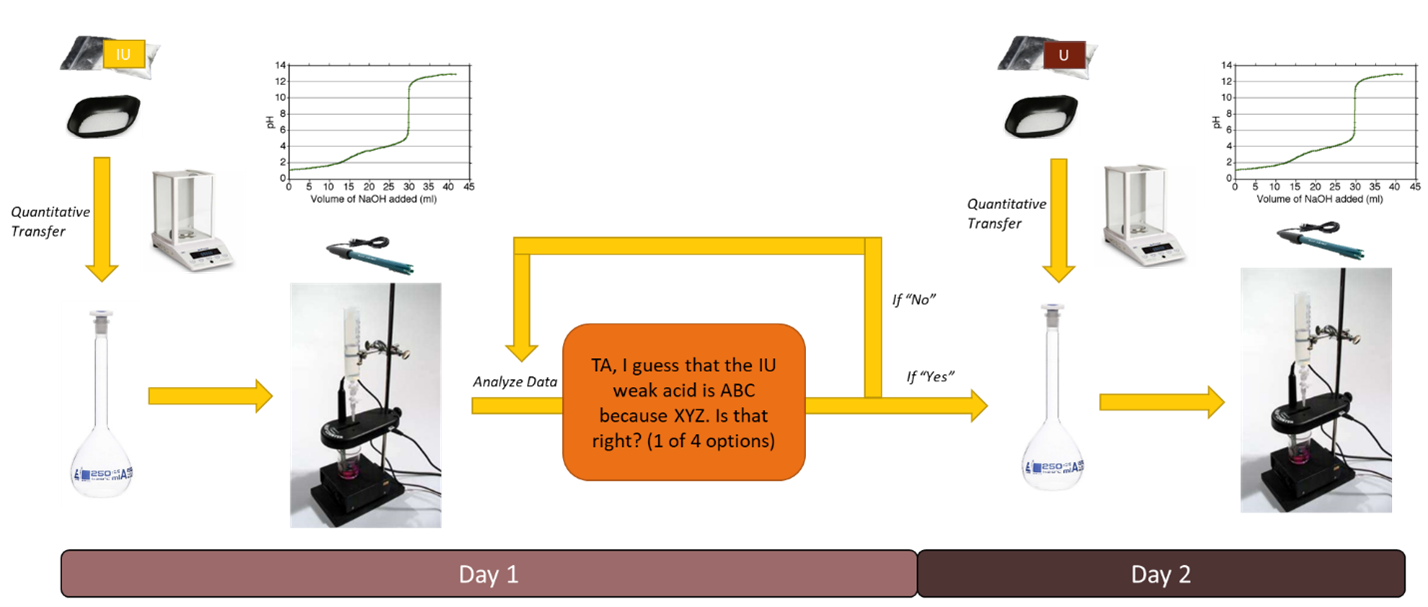
Visual Abstract


Background
So far in your lab experience, you have used the color of an indicator to determine the endpoints of titrations between acids and bases. The intermediate green color of the indicator bromocresol green, for example, identified the endpoint of the titration between the strong acid, HCl, and the weak base, THAM. Another way to measure the endpoint of a titration is to use a pH meter to monitor the pH change in the bulk solution as titrant is added. The meter is sensitive to the activity of H+, or AH, by way of an electric potential that develops across the glass membrane of the electrode. This is called a potentiometric measurement.
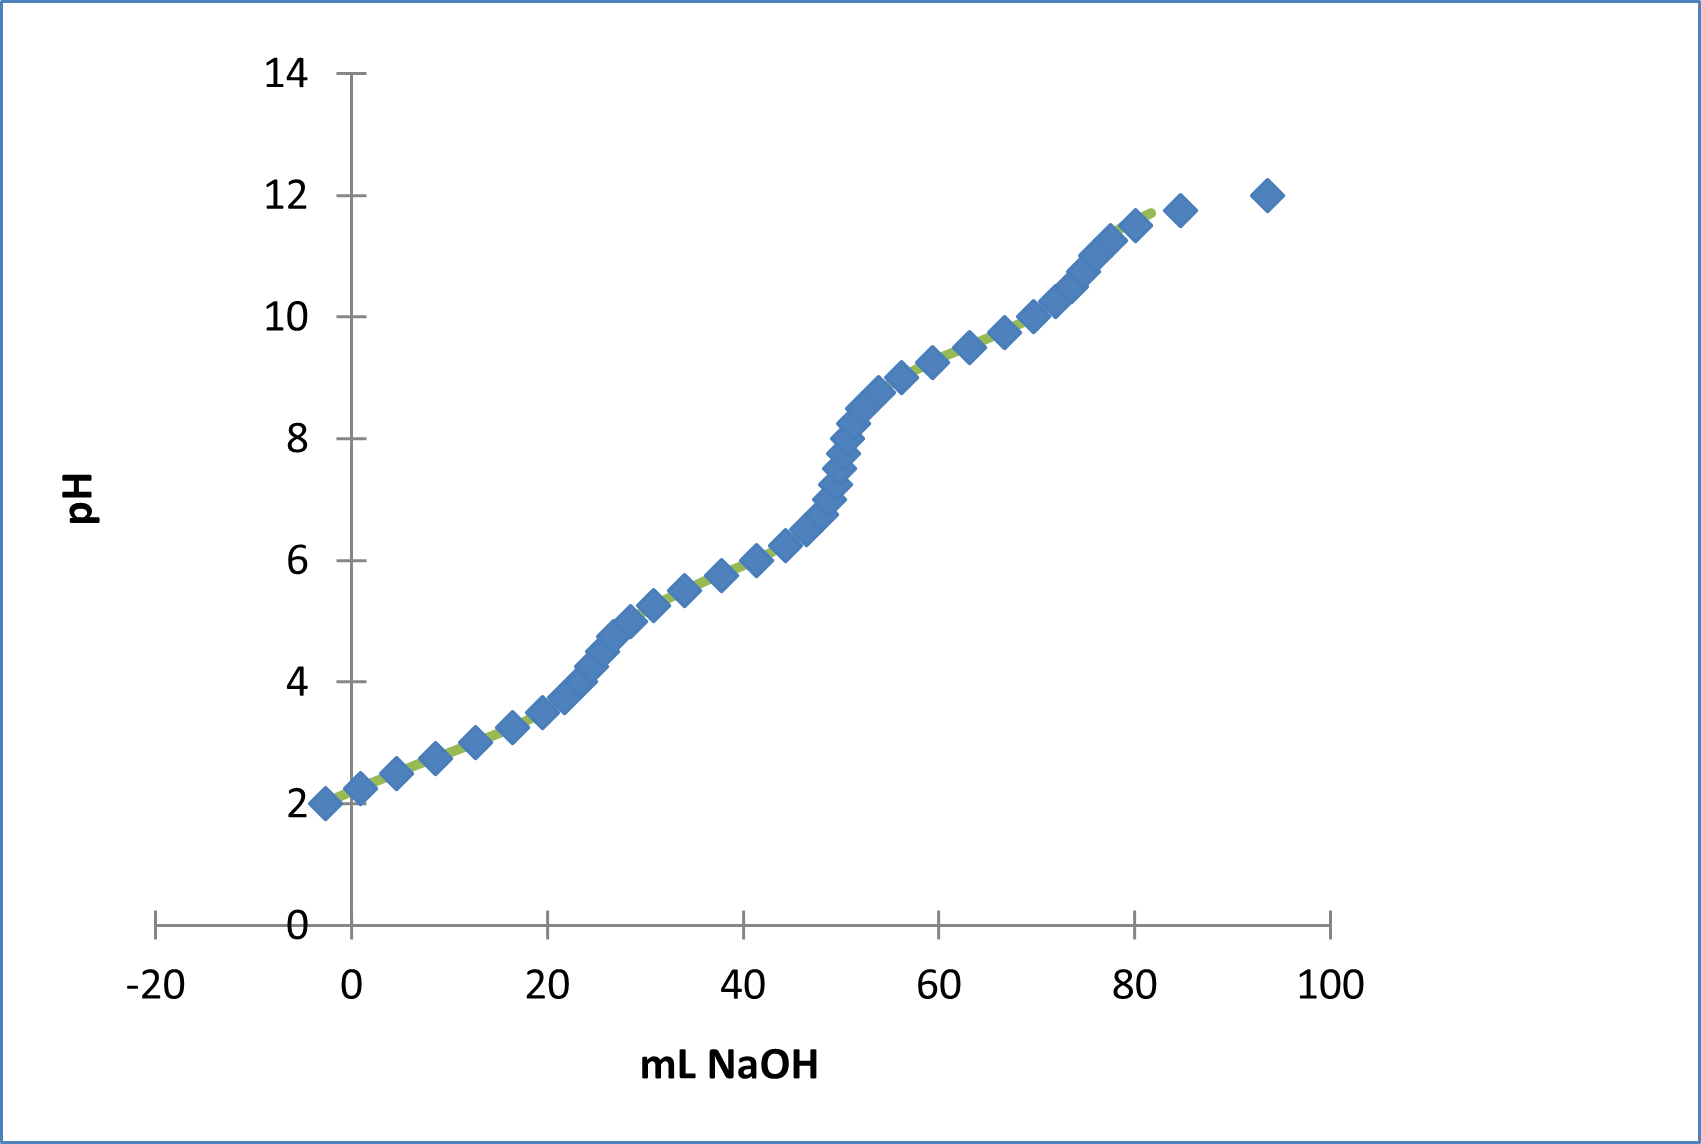
A titration curve is a graph that shows explicitly how the pH changes as titrant is added to the bulk solution. An example is shown below (Figure 1).

Let us consider the example titration curve in Figure 1. These data were taken using a procedure like that described in the experimental section:
- The acid was prepared by accurately weighing 1.500 g of the pure reagent and dissolving it in 250 mL DI water.
- A 50.0 mL aliquot of the acid was titrated with 0.1000 M NaOH.
The x-axis on the titration curve represents the volume (v) of NaOH solution dispensed from the buret. The y-axis shows the measured pH from the meter. The weak acid in the Figure shows three pKa values, pKa1 = 3.00, pKa2 = 6.00, and pKa3 = 10.00. How do we know that? Remember, mixtures of weak acids and the conjugate bases resist changes in pH approximately ±1 pH unit about each pKa. You can see in the graph there exists a long flat region between v = 30 mL and v = 50 mL, indicating that the solution is doing a decent job resisting pH change between the pH values of 5 and 6, even though we are adding a strong base. When all the protons from the polyprotic acid are finally consumed by the titrant and only the conjugate base of the acid remains, defined as an equivalence point for the titration, we notice a very sharp change in the measured pH (a steep pH jump).
Assuming a pure acid was used to make the stock acid solution, how many protons do you think were titrated at the apparent equivalence point at about v = 55 mL? If you answered two, this is correct. The flat regions of this curve before v = 55 mL are regions where this acid buffers quite well. You can clearly see two pKas and two steep pH jumps (i.e., two equivalence points). Sometimes the pKas are close together, so that the boundary between the two buffer regions is blurred resulting in an apparent buffer region that is quite long and spans over several pH units (e.g., more than the expected ±1 pH units around a pKa). If this is what you observe in the experiment, the buffer region may contain 2 pKa values rather than one.
For an unknown acid, one set of identifiable characteristics are the pKas of the experimental titration curve. It is also possible to calculate the molecular weight of the acid by considering the equivalence points of the curve. To calculate the molecular weight, you need to understand that at the FIRST equivalence point, the moles of NaOH added to solution are equal to the moles of acid present. At the SECOND equivalence point, the moles of NaOH are equal to 2× moles acid present, and so on. Using this fact, along with the accurate mass measurement of the original acid sample (remember you used a 50 mL aliquot!) you can determine the grams/mole of the acid you think is present in solution. Proper and careful experimental technique is necessary to accurately determine the observed pKa values and the endpoints of the curve. Also keep in mind that the pH is a measurement of AH, not [H+]. So, to do the best job of modeling the titration curve, activity corrections should be included when developing an accurate model for your system.
In this experiment, you will work to identify an unknown weak acid. In the process, you will also construct, calibrate, and then use an automatic titrating apparatus to perform the experiment.

Lab Concept Video
click here to hide the video (for printing purpose).
Write down observations or notes from the video in your lab notebook.
Pre-lab Work

Lab Skills
Review these lab skills videos prior to lab.
click here to hide the video playlist (for printing purpose).
Key Takeaways
- Using glassware to make precise measurements will be critical to your ability to determine the weak acid unknown you have been given.
- You will need a flashdrive to transfer your data from the LabQuest.
Extra Resources:

Prelaboratory Exercises
The following questions should be completed in your laboratory notebook before you take the quiz, and especially before you start the lab.
- Sketch the titration curve from Figure 1 in your notebook. Then label the important points on the titration curve that can be used to identify characteristic information about the weak acid. This should include all the pKa and equivalence points you observe.
- Using the information describing the experiment conducted to collect Figure 1, estimate the molecular weight of acid sample. HINT: Recall that the sample mass was dissolved in 250 mL of DI water and a 50.0 mL aliquot of that sample was used for the titration analysis. If you assume a homogeneous solution in the original 250 mL sample, that means 1/5 of the original mass was titrated. This detail is important to consider when thinking about calculating the estimated molecular weight, or grams/mole, of the sample.

Before You Take The Quiz on Canvas
- Understand the underlying chemistry at every point of a potentiometric titration.
- Understand the reasons behind the steep pH jumps and flat pH curves in a titration curve.
- Understand how overlapping buffer regions impact the shape of the titration curve for titrations of polyprotic acids.
- Be able to identify pKa values from a titration curve.
- Be able to calculate the molecular weight of a polyprotic acid given a set of raw data—the volume required to reach a particular equivalence point, concentration of NaOH, and the mass of the weak acid weighed out for the experiment.

Experimental
A. Building the Titrator and Testing with a Control
- Build the titrating apparatus.

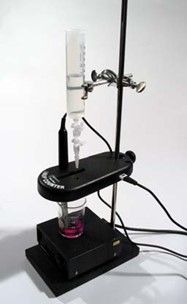
Figure 2. Automatic titrator set up you will recreate in lab using a drop counter, LabQuest, and pH probe. - You will assemble the Vernier LabQuest with the drop counter and pH probe as shown in Figure 2.1
- You will need a 100 mL beaker, a magnetic stir plate, and a metal clamp in addition to the Vernier equipment.
- Place the 100 mL beaker in the center of the stir plate and slide the drop counter over the ring stand. Remove the pH probe from its storage bottle and insert through the larger round hole on the drop counter. Slip the microstirrer onto the bottom of the beaker, and then slide the drop counter down the ring stand to position the microstirrer at the bottom of the beaker.
- Connect the pH probe to “CH1” on the LabQuest interface. Connect the drop counter cable to the “DIG 1” channel on the LabQuest interface. The LabQuest device should automatically detect the pH probe when it is connected.
- After the assembly, you will need to calibrate both the pH probe and the drop counter prior to collecting data for your titration curve. The instructions for calibrating the pH probe is here.
- Calibrate the Vernier Drop Counter.
- Connect the spout and two 2-way valves to the plastic reagent reservoir. (Note: There are two 2-way valves on this device. The top valve is used to regulate the delivery rate of the titrant, while the bottom valve is an on-off valve.)
- Please make sure both valves are in the closed position, and then add approximately 20 mL of titrant to the plastic reagent reservoir. Your titrant in this experiment will be ~0.1 M NaOH (be sure to record the exact molarity of the solution in your notebook).
- Before calibrating the drop counter, you should adjust the flow rate of the two valves of the reagent reservoir by opening the bottom valve (i.e., the on-off valve) and then slowly opening the top valve (i.e., regulates delivery rate) until you achieve a very slow drip rate. The ideal rate is one drop every two seconds or slower. Close the bottom valve once the drip rate is established. DO NOT adjust the top valve for the rest of the experiment. If you do, you will need to recalibrate the drop counter!
- Next, you will calibrate the drops so that the volume of your titrant added to your sample can be measured in milliliters.
- First, place a 10-25 mL graduated cylinder below the drop counter slot and fill the reagent reservoir with titrant.
- On your LabQuest, touch the blue box on the meter display labeled “DIG:1 Volume.” Select the one option that appears, “Calibrate.” A new screen will appear, and you will need to click the button “Calibrate Now.”
- Open the bottom valve to begin releasing titrant. Continue to release drops of titrant until there are between 9 and 10 mL of titrant in the graduated cylinder. (Note: Be sure to check that the LabQuest device is counting the drops by monitoring the counter on the LabQuest screen.) Some Drop Counters will blink if a drop has been counted.
- Once the volume reaches 9-10 mL, close the bottom valve, and type the precise volume of titrant collected in the graduated cylinder in the Volume (mL) box of the “Calibrate drops” dialog box.
- Select the “Equation” tab at the top of the screen. Record in your notebook the drops/mL value from the calibration. If at any time your drop counter loses calibration, you may return to this screen and enter the number of drops/mL instead of repeating the calibration process. If you do not write this number down and the system loses calibration, you will need to recalibrate the drop counter again!
- Prepare your Instructional Unknown sample.
- Obtain a sample of the Instructional Unknown (IU) from your laboratory instructor. The purpose of the IU sample is to act as a control for your set up and analysis strategies. The IU sample is a pure compound. Do not dry the IU sample or store it in a desiccator.
- Weigh accurately ~1.5 grams of the IU sample and quantitatively transfer it to a 250 mL volumetric flask, BUT only add about 25 mL DI water. Observe whether the sample easily dissolves. If you observe crystals or suspended powder after agitating the flask for several minutes, add (IN 5 mL ALIQUOTS, mixing each time) about 50-75 mL of ethanol from the stockroom. After every addition, agitate the flask again for several minutes and check the solubility.
- When crystals are fully dissolved, dilute to the mark with deionized water.
- The IU is either hydroxybenzoic, succinic, maleic, or malonic acid. Once you have collected the data, use the strategies described in the introduction to determine the identity of your IU. Check with your instructor to confirm if you have correctly identified your IU sample.
- Titrate the IU sample.
- Transfer a 50.00 mL aliquot of the IU sample to a 250 mL beaker. Place the beaker under the drop counter, making sure that the microstirrer touches the bottom. Turn on the stir plate prior to adding titrant to get the microstirrer moving. The microstirrer should be moving fast enough to mix the solution thoroughly but not splashing on the side. Make sure it is not hitting the pH probe as well!
- Touch the green arrow on the LabQuest screen and completely open the bottom valve (i.e., the on-off valve) on the reagent reservoir to begin collecting data. (Note: No data are collected until the first drop falls through the drop counter.) You will begin to see pH vs. volume of titrant data being plotted on the screen.
- Continue to titrate until the pH of the solution in the beaker reads more than pH 11 and seems to have reached a steady state reading (i.e., flattened off). Once you have reached this point, shut off the lower valve and stop data collection by touching the red square on the screen. A plot of pH vs. volume will be displayed on the screen.
Saving Data from LabQuest
Insert a USB drive into the port on the LabQuest. Click “File” → “Save”. The save file screen will appear. Select the button at the top of the screen that indicates your USB drive. Once selected, provide your file with an appropriate name. Click the “Save” button to complete the process. This file is good to have JUST IN CASE, but, you won’t be able to use it unless you have LabQuest software on your computer.
Thus, to export the data for subsequent analysis in Excel, you can export the data as a text file. To do this click “File” → “Export”, then choose the file with the stylus before clicking “OK”. If you previously saved your data and closed it, you will need to re-open it on the LabQuest before you can export it to a flashdrive.
- Analyze your acquired data. From your titration data, calculate the molecular weight and determine the pKa value(s). You can use the information in the Table of Weak Acid (Table 1) below to make an informed guess as to which acid of the four options your IU sample might be.
- Test your prediction against a model.
- Construct a theoretical titration curve using the Weak Acid Titration Generator Excel macro that models the system you’ve been working on experimentally.
- Input the Ka values of the acid you THINK you have in the top left corner of the spreadsheet. Using the molecular weight listed in Table 1 for your IU, calculate the molarity of the weak acid solution, and enter it in cell E2. Enter the titrant molarity in cell G2. Be sure to input the experimental data (exported from the LabQuest) by manually entering the vol. NaOH vs. pH data in columns O & P, starting in row 55.
- Compare the experimental titration curve to the computer-generated curve. If the match is less than excellent, your educated guess is not correct. Try another guess.
B. Identification of an Unknown Weak Acid
- Obtain an “Unknown” from your laboratory instructor. Using what you have learned while studying the IU sample, following the same general procedures, identify the unknown. Your unknown acid is a pure compound and is one of the acids listed in Table 1. Good luck!
| Code | Acid | M.W. (g/mol) | pKa1 | pKa2 | pKa3 | pKa4 |
| 1 | Acetic | 60.03 | 4.76 | 0 | 0 | 0 |
| 2 | Adipic | 146.1 | 4.42 | 5.41 | 0 | 0 |
| 3 | Aspartic | 133.1 | 1.99 | 3.9 | 9.9 | 0 |
| 4 | Ascorbic | 176.14 | 4.1 | 11.79 | 0 | 0 |
| 5 | Benzoic | 122 | 4.2 | 0 | 0 | 0 |
| 6 | Butyric | 88.06 | 4.82 | 0 | 0 | 0 |
| 7 | Carbonic | 62.01 | 6.35 | 10.33 | 0 | 0 |
| 8 | Citric | 210.2 | 3.13 | 4.76 | 6.4 | 0 |
| 9 | Cysteine | 121.12 | 1.96 | 8.54 | 10.5 | 0 |
| 10 | Cystine | 240.23 | 1.65 | 2.26 | 7.85 | 9.85 |
| 11 | EDTA | 372.2 | 1.99 | 2.67 | 6.16 | 10.22 |
| 12 | Formic | 46.02 | 3.77 | 0 | 0 | 0 |
| 13 | Fumaric | 116.1 | 3.02 | 4.39 | 0 | 0 |
| 14 | Glutamic | 147.1 | 2.11 | 4.13 | 9.49 | 0 |
| 15 | Glycine | 75.07 | 2.35 | 9.78 | 0 | 0 |
| 16 | Glycolic | 76.03 | 3.18 | 0 | 0 | 0 |
| 17 | Histidine | 155.2 | 1.8 | 6.04 | 9.33 | 0 |
| 18 | Histidyltyrosine | 176.2 | 2.5 | 6 | 9 | 10.1 |
| 19 | Homocystine | 268.36 | 1.59 | 2.54 | 8.52 | 9.44 |
| 20 | Hydroxybenzoic | 138.1 | 4.6 | 9.5 | 0 | 0 |
| 21 | Iminodiacetic | 133.1 | 3.02 | 9.9 | 0 | 0 |
| 22 | Lactic | 90.05 | 3.86 | 0 | 0 | 0 |
| 23 | Leucine | 131.2 | 2.36 | 9.6 | 0 | 0 |
| 24 | Lysine | 146.2 | 2.18 | 8.95 | 10.53 | 0 |
| 25 | Maleic | 116.1 | 1.92 | 6.22 | 0 | 0 |
| 26 | Malonic | 104.1 | 2.85 | 5.66 | 0 | 0 |
| 27 | NTA | 191.1 | 3.03 | 3.07 | 10.7 | 0 |
| 28 | Oxalic | 126.1 | 1.24 | 4.28 | 0 | 0 |
| 29 | Phosphoric | 98.05 | 2.23 | 7.21 | 12.32 | 0 |
| 30 | Pyrophosphoric | 178.1 | 1.52 | 2.36 | 6 | 9.25 |
| 31 | Phthalic | 166.1 | 3.11 | 5.39 | 0 | 0 |
| 32 | Proline | 115.1 | 1.99 | 10.6 | 0 | 0 |
| 33 | Succinic | 118.1 | 4.19 | 5.48 | 0 | 0 |
| 34 | Salicylic | 138 | 2.98 | 0 | 0 | 0 |
| 35 | Serine | 150.1 | 2.21 | 9.15 | 0 | 0 |
| 36 | Sulfanilic | 125.1 | 3.22 | 0 | 0 | 0 |
| 37 | Tartaric | 150.1 | 3.04 | 4.37 | 0 | 0 |
| 38 | Taurine | 125.1 | 1.5 | 8.74 | 0 | 0 |
| 39 | Threonine | 119.1 | 2.63 | 10.43 | 0 | 0 |
| 41 | Tryptophan | 204.2 | 2.38 | 9.39 | 0 | 0 |
| 42 | Tyrosine | 181.1 | 2.2 | 9.11 | 10.07 | 0 |
| 43 | Valine | 117.1 | 2.32 | 9.62 | 0 | 0 |
Weak acid work sheet: this worksheet can be used as a reference table to build in your lab notebook for data collection!
Post-Lab Work Up

Results/Calculations
Fill out the answer sheet for this experiment completely. Answer the following post-lab questions.
- A clearly labeled and detailed graph of the experimental data for both the instructional unknown and unknown acids overlaid with a theoretically derived titration curve. Label key areas of the curve you used to extract important experimental information such as the pKas and transition areas for determining the molecular weight.
- A clear description and calculation of the IU and unknown samples’ molecular weights.
- In your reflective summary, propose how you would go about choosing an indicator to detect the endpoint, or transition interval, of the titration of your unknown acid. Explain the advantages and disadvantages of using a pH meter versus an indicator to detect the endpoint of titration.

Challenge Questions
Challenge questions are designed to make you think deeper about the concepts you learned in this lab. There may be multiple answers to these questions! Any honest effort at answering the questions will be rewarded.
- Based on that experimental titration curve of the IU unknown sample, can you sketch out the titration curve if both the starting weak acid solution and the NaOH solution are diluted 10 times? What about diluting another 10 times on top of that? Particularly, you should pay attention to the size of the pH jumps around each equivalence point, as well as the relative positions of the flat regions before or after the pH jumps. For the sake of simplicity, no need to consider activity in this exercise.

Lab Report Submission Details
Submit your lab report on Canvas as 1 combined PDF file. This submission should include:
- The completed answer sheet.
- Your lab notebook pages associated with this lab, which should include answers to the post-lab questions and challenge questions.
The grading rubric can be found on Canvas.
- These instructions for assembling the Vernier equipment are modified from the Vernier Drop Counter instruction manual.
- Harris, D. C. & Lucy, C. A. Quantitative Chemical Analysis, 10th ed.; W. H. Freeman: New York, NY, 2020
Please use this form to report any inconsistencies, errors, or other things you would like to change about this page. We appreciate your comments. 🙂 (Note that we cannot answer questions via the google form. If you have a question, please ask your instructor or TA.)
