
12 Preparing Posters
Posters are a commonly used form of scientific communication that is used to share information and generate dialog with other scientists at scientific meetings and symposia. Posters are either one page or one slide/canvas of text and graphics that summarize your science as either a proposal, final data, or an infographic in a concise and visually pleasing way. In Biocore we make use of posters as a means to communicate research proposals and final research reports that replace papers or oral slide presentations. Before preparing your own poster, observe some made by other Biocore students hanging in Noland hallways or by scientists in other research buildings on campus.
See the Writing Center handbook for creating and presenting posters
https://writing.wisc.edu/Handbook/PosterPresentations.html
Developing a scientific poster is quite different from writing a paper or creating a PowerPoint presentation.
Tips to start with
- Easy to read and visually appealing: In class, you will be presenting your poster to peers and instructors, primarily in digital form but sometimes in print. You want the most important aspects of your poster to stand out (e.g. results figures and BR diagrams). Use large font to allow for easy reading. During a scientific meeting, there may be as many as 200 posters in a room, and you do not want your poster to be ignored. Use large font and lettering (larger for titles, headings and subheadings) so that the information can be read easily from at least 5 feet away (or at arms-length without enlarging if viewed on a computer screen).
- Emphasize the science: Although the poster should be visually appealing, don’t get carried away with this – put your efforts into substance over form. In evaluating the posters, we pay much more attention to the poster’s scientific soundness and ability to tell an integrated story than we do to its glitz.
- Save Space and Graphic Design: The poster is a summary of your research, in a graphically rich and informative graphic design. To save space, 1.) introduce acronyms that shorten long chemical names or biological terms that describe independent or dependent variables used repeatedly in throughout your poster (e.g. rather than repeating anthocyanin pigment intensity, introduce and use API to save space), 2.) use smaller font for literature cited, 3.) diagram your biological rationale, your methods and the reasoning in your discussion, 4.) use numerical citations in the body of your text (see below).
- Numerical Citations: In papers or oral presentations you are used to seeing parenthetical citations within the body of the text (e.g. Smith et al. 2018) which is helpful for reference in a multiple paged document or slide set, however, in a one-page document such as a poster this takes up a great deal of space. Therefore, we recommend using numerical citation format where use of a superscript number in the text or in a graphic is keyed to the number in your literature cited section.
Components of your poster
Informative title
Gives the reader the take home message of your experiment stating the organism (or general system) you are studying, the independent variable, and the direction of your results. Titles are a critical component of posters since they draw people in to talk with you during a crowded scientific meeting.
TITLE THAT NEEDS WORK: The Effects of n-Butanol on mating in Saccharomyces cerevisiae
IMPROVED TITLE: Increasing Concentrations of n-Butanol Inhibits the µ-mating Response in Saccharomyces cerevisiae MATa cells
Author’s names in alphabetical order
Order of authors’ names generally indicates the researchers’ level of involvement in the study. However, we expect all group members to have equal involvement in the study and preparation of the poster, therefore authors should be listed without indication of hierarchy, in alphabetical order. *Underline or bold your name when handing the poster as an individual assignment.
Department and institution affiliation where the work took place
In this case, Biology Core Curriculum, University of Wisconsin-Madison. Affiliations are generally placed directly under the author/ co-author list.
Introduction
Be brief, but include;
- Question: What question did you address with your experiment?
- Background: key issues, concepts, or terminology needed to understand the reason for the experiment.
- Biological rationale: Often a diagram or conceptual model illustrating how the background information on the independent and dependent variable leads to knowledge gap, and provides reasoning for the hypothesis. The BR is the heart of your introduction and provides the logical, biological reason for doing the experiment and your predicted hypothesis. This is NOT a social justification. Remember your audience: gear your poster to classmates in Biocore who are not taking lab.
- Hypothesis: It is of particular importance that you define and present a clear hypothesis that is testable given your experimental design. In general, your hypothesis should indicate your independent variable (what you are manipulating), your dependent variable (what you are measuring), your study organism or system, and the direction or trajectory of your predicted result(s). This is the only place in your poster that requires full sentences.
Methods
There is not room for a lot of details, but you should give your readers enough information that they can evaluate your claims—not necessarily repeat your experiment. We strongly recommend using a chart or annotated diagram to convey your experimental design, sequence of events, timeline and tools.
Results (or Expected & Alternative Results for proposals)
Organize your poster such that your data are presented in large and prominent figures or tables (use large font for your axes and numbers). It is appropriate to use titles to label your tables and figures. Figures and tables need legends which are often more lengthy, “beefy legends”, than in a paper since you are trying to tell your story with graphics. Briefly state your results in the legends or in a short bulleted list, referring to a series of figures/graphs displaying your data.
Discussion and Conclusions (or Implications for proposals)
Your discussion should clearly restate or represent your hypothesis and state whether you support or reject it with supporting evidence from your results. In a proposal, describe the implications of the predicted expected results as it relates to the knowledge gap and the broader rationale presented in your introduction. Sometimes use of a diagram or conceptual model here (similar to that used in your BR) is helpful for explaining the implications of both the expected and alternative results. Avoid over interpretation (particularly if your design or protocol had weaknesses, flawed rationale, or suffered from excessive experimental error) and stick to what you can or cannot say about the system given your data. If your data supported your hypothesis, connect your final conclusion with the knowledge gap and biological assumptions embedded within the biological rationale presented in the Introduction. If your data did not support your hypothesis, describe how they might be the result of alternative rationale, new or unanticipated variables/ interactions that you had not considered previously, or other biological assumptions you made. If possible, briefly describe literature that would help explain your alternative results.
Overall Conclusion statement
End with a clear conclusion statement that is based on your results– the take home message from your research. This final conclusion statement will likely be very similar to your poster’s title.
Literature Cited
Follow guidelines in this manual. Use numerical citations rather than parenthetical citation format to save space within the text for posters. The literature cited can be done in smaller font than the rest of the poster in order to save space.
Example Poster
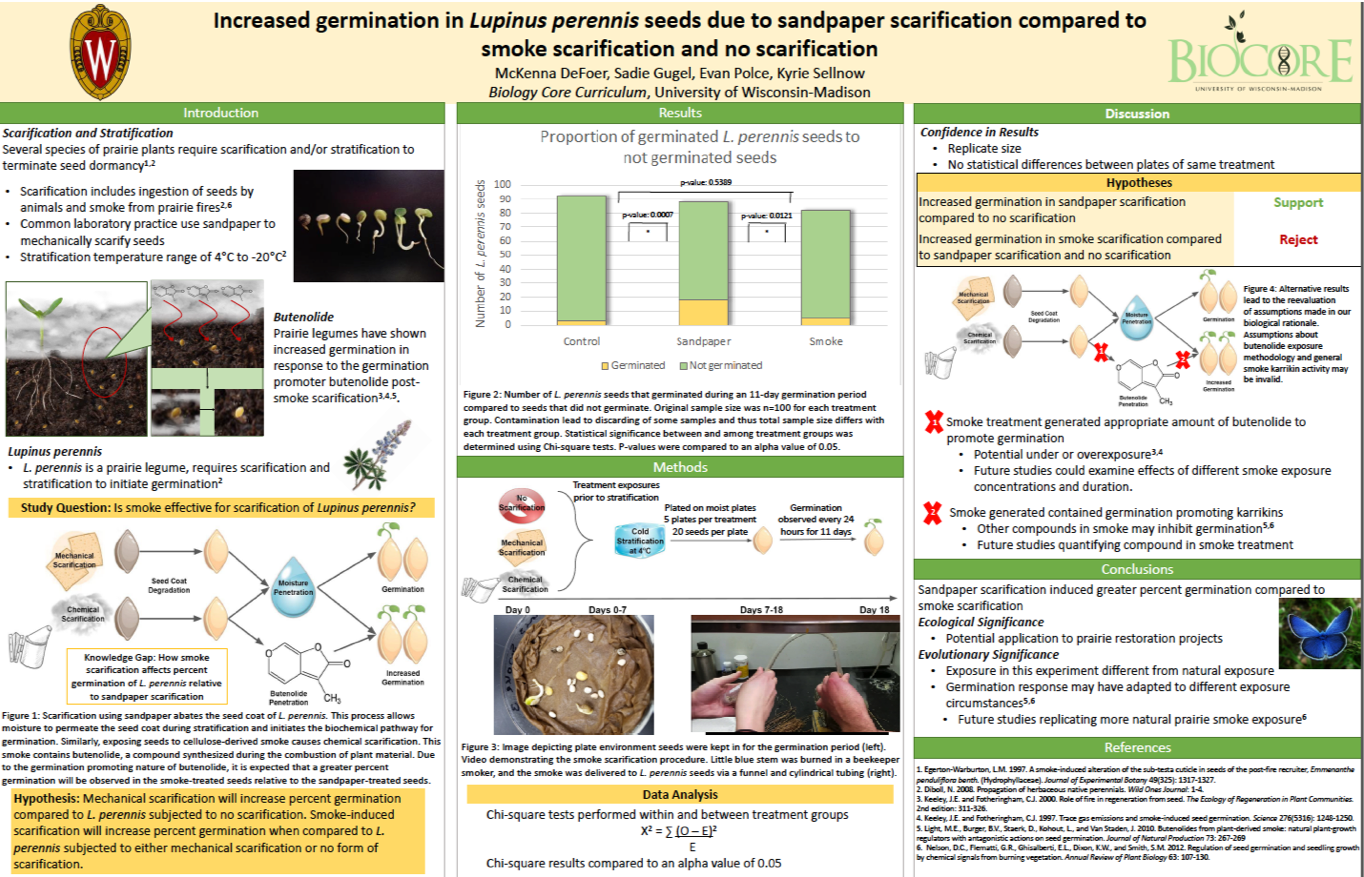
Example Poster contributed by McKenna DeFoer, Sadie Gugel, Evan Polce, and Kyrie Sellnow from the plant physiology unit in Biocore 486.
Features of note:
- the use of graphics to illustrate background information
- the paired set of visual diagrams with ‘beefy’ figure legends for the biological rationale and to illustrate reasoning in the discussion—the pair serve as ‘bookends’ to clearly communicate the proposed mechanism for the response observed
- large figure displaying results prominently in the center top
- numerical citation in text saves space
- not more than two major colors (green and yellow) carry a theme, contrast nicely and complement the photographs and diagrams
