
16 Presentations
We want to give you practice orally communicating your research to others. We have several types of presentations in Biocore labs:
- Informal Feedback presentations, where teams present their research plans and receive input from classmates and instructors on experimental design questions, data analysis questions, etc. Informal feedback presentations allow your peers and instructors to critique your proposal so that you can make necessary changes before carrying out the experiment.
- Formal Final presentations, featuring either posters or PowerPoint slides which summarize completed research.
Informal Feedback Proposal Presentations
We expect all group members to have equal involvement in the study and in preparing and delivering PowerPoint presentations and posters. Come to class ready to receive feedback, with paper and pencil in hand.
Informal PowerPoint feedback presentations should be 8-10 minutes long and have 7-8 PowerPoint slides.
They should have the following components:
Question
What question do you wish to address with your experiment?
Background Information
This is the pertinent background information that you used to support the rationale and to develop your hypothesis. The references you gathered should be mentioned here including relevant data/conclusions from other studies.
Biological Rationale
How is this experiment related to what we know and how will this experiment add to our knowledge? What are the biological mechanisms you think are likely to be operating? In short, the rationale could be stated as follows: –the purpose of our experiment is …………. because we think ………..is occurring. State any biological assumptions you are making. Use a graphic or visual model for your biological rationale slide.
Hypothesis
Single sentence, specific, testable, based on your biological rationale. Recall that you need to identify an independent variable, dependent variable, and a direction in your hypothesis.
Methods
Clearly define:
- How you will set-up the experiment. Tables would be handy here and/or graphics such as flow charts.
- What data you will record and why these are appropriate
- your controls
- How many experimental units you will use and which you will replicate, including controls. State why you think these numbers are appropriate.
- The assumptions for how you think your methods will work.
- Your pilot study- if you are planning one. And contingency plans if it doesn’t work.
- How you will analyze your data (e.g., means? standard deviations?)
Expected/Alternative Results
- Begin by describing the axis of your figure or components of data table. Be sure to include units on all of your axes!
- Then present the controls- describing the predicted behavior of both the positive and negative controls (if applicable).
- Describe the trends apparent in the graph or what your data should look like if your hypothesis is supported. Explain why these results might occur or might be reasonable (refer back to biological rationale and assumptions met).
- Include an additional slide or overlay of biologically plausible alternative results (i.e., data that doesn’t fit your expectations, such as no significant difference or effect). Explain what biological assumptions that, if not met, would explain these alternative results. (Do not present results that would occur if errors were made in carrying out your protocol.)
Implications
- Describe how your research will contribute to the existing understanding of the system and inform next steps, questions or decisions.
- As you present your implications refer back to your biological rationale and knowledge gap. If your hypothesis is supported, does this also supported the mechanism proposed in your BR? Keep your implications at the level of your rationale—and balance your introduction and implications like two bookends for your proposal. There is no need for social justification.
Safety
What safety concerns exist if you are adding a chemical or applying a physical treatment (e.g. electrical current, UV radiation)? How should your chemical be safely stored, handled or treatment done safely to limit exposure? How will your treatment chemicals be safely/properly disposed of? If you perceive risk of any kind, you need to thoroughly research the risks, safety procedures and communicate those risks to your peers and instructors (who may also be at risk). A safety slide is not necessary if there is no apparent risk.
Data Management Plan (DMP)
- What kinds of data are you collecting? Numerical (numbers requiring manipulation), images, observational descriptions
- How will you name your data files (lab section, independent variable, initials of researchers, date)? E.g. lab2_burn_jbsm_20170904.xlsx
- How will you protect and share your data among your team? Take a photo of your data if collected without access to computer; enter into a spreadsheet, in a shareable file, and distributed to all group members.
Questions You Still Have
Use this last slide to pose questions you haven’t found answers to yet, but would be good to answer before you begin your experiment. Have a pencil/paper ready to receive feedback!
Formal Final Presentations
Final PowerPoint presentations are graded assignments. We will use the oral presentation rubric below to grade your team presentations. They have the same components as informal PPT’s except that “Expected Results” are replaced by “Results” and a “Discussion” section, and there is no “Questions You Still Have” section. Final PPT’s are necessarily more detailed yet still very concise and are modeled after talks given at scientific meetings. Final presentations should take 15 minutes to deliver. Each member of your team should contribute equivalently to the presentation and to the question/answer session following your presentation. Practice, practice, practice your talk as a team beforehand!
Here are some field-tested tips for preparing PowerPoint slides.
Keep it simple
- Think of your PowerPoint slides as ‘billboards’ conveying the major points of your presentation. Present only one to two major ideas per slide. You can provide clarification or transitions in your verbal presentation.
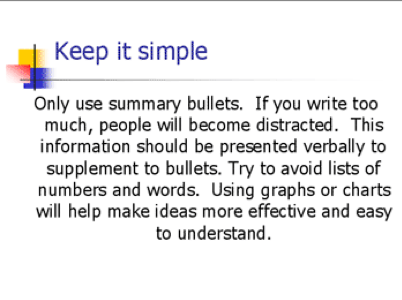
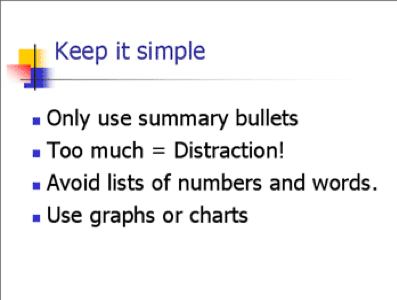
- The least effective visuals are crowded, complex lists of numbers or words. They strain the eyes and attention of your audience. By the time you get to your point, the audience may no longer care what it is. Bulleted key ideas, simple graphs, charts or tables are much more effective because they quickly communicate your major ideas. You can include important details in your oral narrative. Below at the top is an example of a slide with too much text. The same information is conveyed with the concise, visually appealing slide below.
- If your methods are complicated, show a concrete illustration of it in a visual diagram, flow chart, concept map, or table rather than a lengthy list of procedures.
Design every slide for the back-row viewer
- Fill the slide with the statement/diagram/chart/graph. Use sharp bold lines and print clearly with characters large enough to be read by the people in the back row.
- Choose colors of high contrast (black on white is much easier to read than red on black).
- Use large font sizes to label all parts of graphs, charts and tables (e.g., column headings, units of measure, axes of graphs, etc.) so that the audience clearly understands what they are looking at.
- Design using a consistent background and color scheme throughout presentation (a background of your own creation or pre-made template). This gives your presentation continuity, providing a visual thread or theme for your viewers. Avoid busy-looking backgrounds which distract your audience.
Use color, slide transitions, and animation for emphasis of your science, not ornament
- Thoughtfully planned use of color can emphasize relationships and organization throughout your presentation.
- Use only simple slide transitions which do not distract the audience from the contents of your slide.
- Use animation only if it helps to emphasize an important point you want to make. Flashing words or endless animation loops are distracting and draw the audience away from your point.
- In summary, use color, transitions, and animation that engage your audience rather than distract them!!
A well executed visual aid is simple, informative, and pleasant to view
Have a friend look over your slides before your presentation. If she/he can grasp the key points without extensive explanation from you, you have probably prepared effective visual aids.
Figure legends
There is usually no need for figure legends in a PowerPoint presentation. The words are usually too small to read. Instead, use a large descriptive title for your figures and a well-displayed key for your different treatments.
Inserted pictures
If you grab a picture from an online article, scanned text figure, etc., you must cite the website and/or publisher appropriately below the picture.
Last presented slide
End your talk with a simple slide that summarizes your conclusions. Prepare a slide that lists your references, but don’t show it to your audience as part of your formal presentation. This reference list is important for your instructors in evaluating your presentation, but usually is not interesting to your audience. You may, however, be asked about your information sources immediately after your presentation, and so you could refer to your reference slide on such an “as-needed” basis.
