
5 Conversational Coloring: Mapping an Interview
Joanna Wilson
In September of 2018 I traveled to Dickinson, North Dakota, as part of a seminar class in vernacular architecture field methods. The week in North Dakota was spent gathering oral histories, speaking to farmers about their histories with the land, and visiting properties to create measured drawings of still-standing (or partially standing) farm structures built during the early twentieth century.
Armed with large sheets of graph paper, drawing boards, mechanical pencils, architectural rulers, and a stockpile of 25, 50, and 100 foot measuring tapes, we broke into groups of two or three and systematically recorded a series of measurements that we translated in the field to quarter-inch scaled drawings of each building’s plan. The field trip was rewarding, and exhausting. And when we returned to Madison, we were each tasked with creating content for this book.

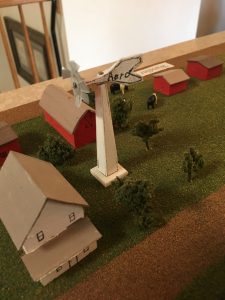
I began my project with a diorama of Schefield, North Dakota. The diorama’s creator, ninety-year old Nick Olheiser, grew up on a farm outside of Schefield, and the tiny town served as the center for culture, commerce, and religion for Nick and hundreds of other families in the area, who, like Nick’s family, emigrated from Germany via Russia to farm in North Dakota. From the time he was born until he was married and starting his own family, Schefield was the location of almost all of Nick’s formative experiences that took place outside his home. And for many years now, the town of Schefield has ceased to exist.
My imagination was sparked by the idea of this gentleman lovingly plotting and recreating his vanished hometown with plywood, paint, and other kit model materials. But, having missed the opportunity to meet Nick and study the Schefield diorama in person, I wasn’t sure how to create a project based only on photos of the diorama, my romantic perspective on its origins, and a hunch that it functioned as a sort of memory portal for Nick to access his own distant past.
Fortunately, I had access to the audio record of an interview that our class professor, Andrzejewski, and my classmates Kendra Greendeer and Carly Griffith, conducted with Nick. I volunteered to create an index log—a detailed, time-stamped, summary of what is discussed in each portion of an interview—of the recording. The interview took place in Nick’s home with interviewers and interviewee seated around the diorama, where Nick spoke for one hour and twenty-eight minutes. I hoped that in the process of indexing the interview I would find the key to connecting Nick’s diorama to a larger narrative about spatial representation and memory.
Although less time-consuming than creating a verbatim transcription, the process of indexing an interview is slow and laborious. Each minute or two of audio required multiple listens to create roughly a paragraph of text describing the topics discussed in that short segment. My southern-Alabama ears sometimes had trouble discerning the Germanic dialect and names of people and places as relayed by a western-North Dakota accent. I often worked on indexing Nick’s interview when I had an hour or two between other obligations. The hours flew by and I would find I had only finished logging another five minutes of the audio. In this manner I slowly worked my way through the interview until early November 2018, with the process finally completed, I was ready to begin identifying patterns in the interview as a whole.
Numbers and Colors
Over the course of this seminar several of my classmates and co-authors were working from data sets—mostly statistics about energy, agriculture, and regional demographics—to create maps that relate compelling narratives about the landscape with visual immediacy. I was inspired by the informative impact of those projects, but struggled to see how my specific source material might be similarly translated. How do you map an interview? Though rich in personal historic details, a long, meandering, oral history does not easily conform to the systematic arrangement of quantitative information represented by a chart.
I decided to attempt it anyway.
The completed and formatted log of Nick’s interview was 6,121 words long—or just over thirteen pages of indented single-spaced text. I decided to use the length of the interview itself as the metric framework, and to use the same tools we use when making our measured drawings of buildings to graphically represent that length of time. In the interest of space and only partial confidence in this experiment, I chose to visually condense the interview using the scale of my architectural ruler to represent each minute of the interview as one quarter-inch unit. At this scale, the entire eighty-eight minute interview could be drawn along a twenty-two-inch base line.
Step 1:
To begin, I combed through the index and highlighted every time-stamped segment in which Nick is talking about events that take place in Schefield—the town whose physical replica was central to the literal space of the interview.
Step 2:
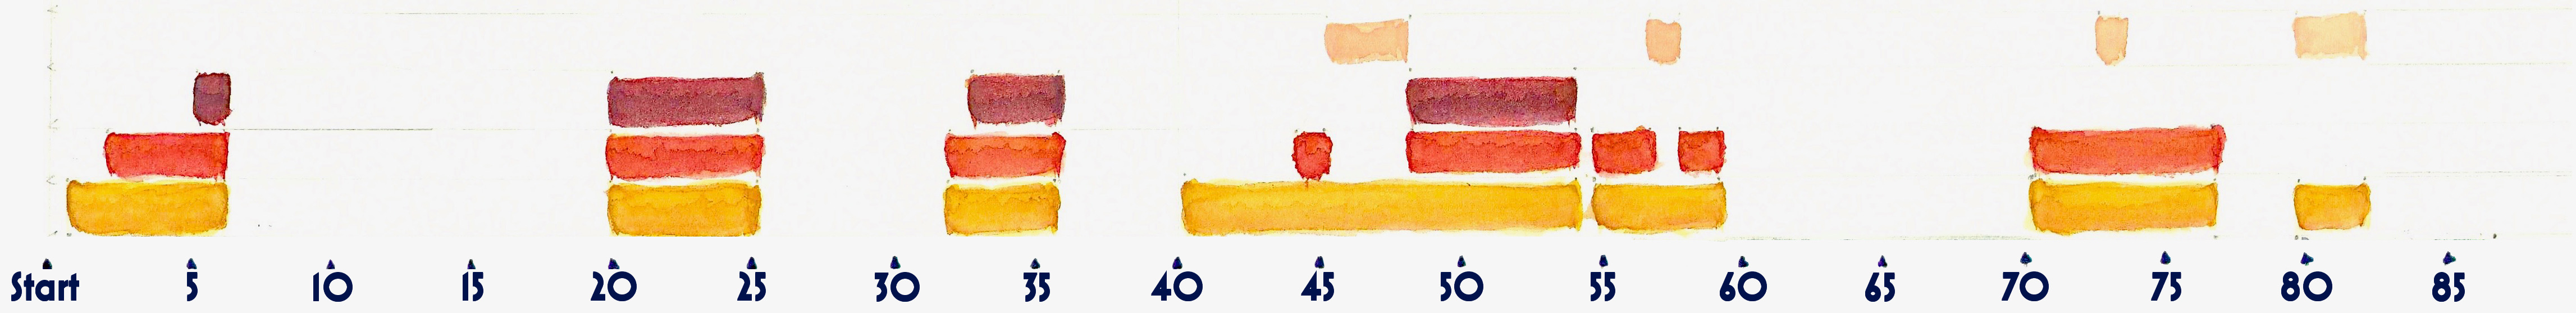
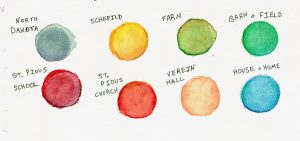
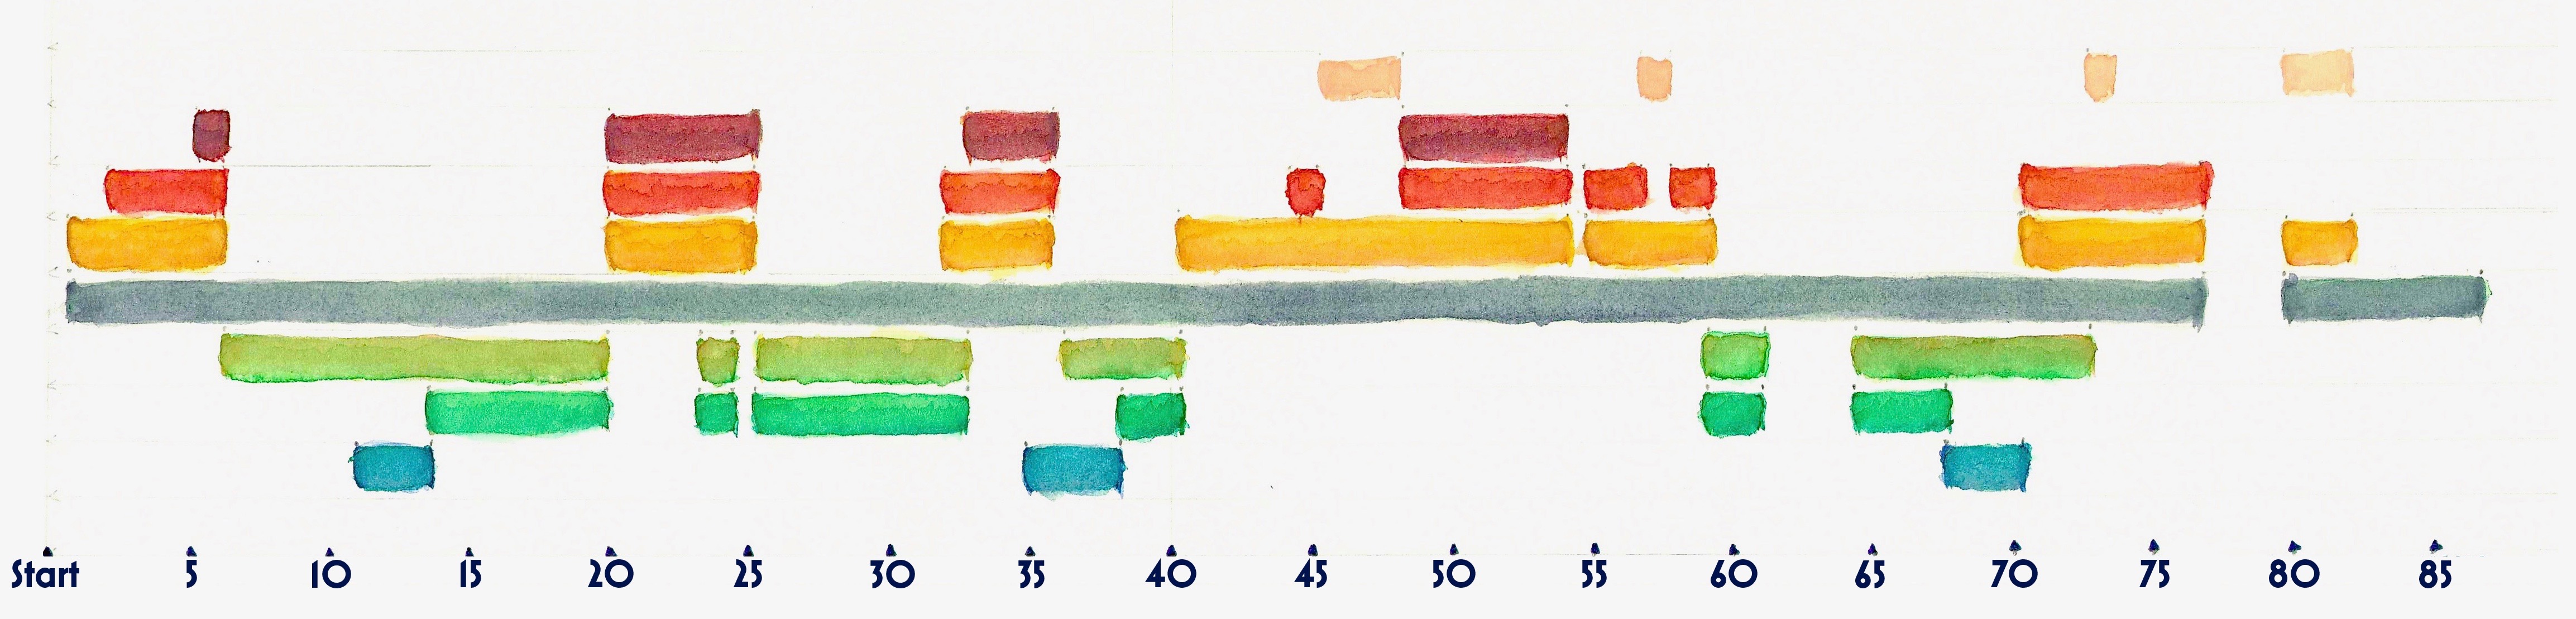
I then noted the start and end times of each of those segments, and chose a specific color with which to draw in the topic of Schefield along the base line. The first time Nick discusses Schefield, from timestamp 00:00:33 to 00:06:10, I used a deep yellow to draw that segment on the measured line beginning one-half unit into the base line, and ending a little over six units in. I continued this process of drawing when and how long Nick discusses Schefield for the whole interview until Schefield’s presence in the interview appears distinctly on paper as a series of long yellow dashes across the page.

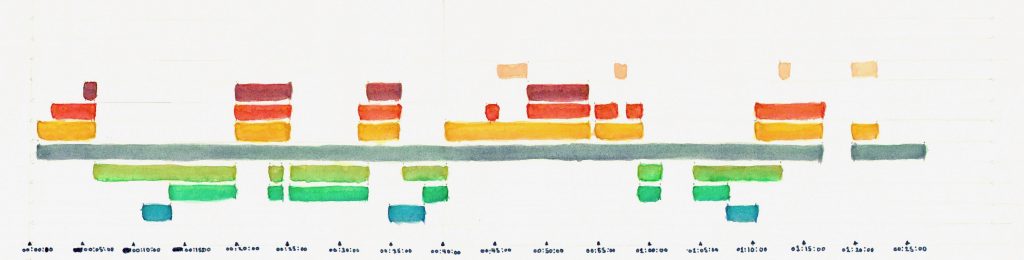
As you can see, there is a kind of symmetry to when and how long Nick’s discussion of Schefield occurs in the interview. Particularly in the first half of the interview where the first long yellow dash is followed by a long break representing around 14 minutes, another yellow dash slightly shorter than the first, another gap slightly shorter than the first gap, then that pattern is repeated once more before you come to the longest yellow dash in the middle of the interview. That dominant yellow dash, beginning at 00:40:18 and ending at 00:59:06, represents Nick’s most sustained discussion of Schefield or, as I would learn later in my interview-charting experiment, of any other location discussed in the interview. The long central yellow dash, is followed by a long gap, a long yellow dash, a short break, and a short dash at the end.

Although immediately struck by the visual pattern of Nick’s discussion of Schefield, I wanted to further test this method of measured color mapping before drawing conclusions. After identifying several other places that appear frequently in the interview, I repeated steps 1 and 2 with distinct colors for each of those places. Several of the place categories that I mapped in the interview are sub-categories of place that fall within the boundaries of other categories, and thus always overlap them. For instance, whenever Nick discusses his life at “home” it appears under the “farm” line because home was always on the farm for Nick. To distinguish Nick’s discussion of the agricultural and other workspaces of the farm, additional categories of “field and barn” are added, which also always overlap the “farm” line. Although it stretches through almost the entirety of the interview timeline, I added a line for North Dakota to emphasize the few brief times that Nick speaks about things that take place outside of state boundaries.
Now, with a more complete picture, I began to draw some conclusions about what the frequency and duration of places discussed in the interview can tell us about Nick’s relationship to those places.

The three most frequent specific buildings discussed in the interview—St. Pius Church, St. Pius School, and the St. Pius Verein Hall—all fall within the boundaries of Schefield, as you can see from the frequency of their respective red, orange, and pink lines dotted above Schefield’s yellow. The importance Schefield holds for Nick was already evident in his diorama of the town, and as I anticipated, the memories and events connected to Schefield occur at a high rate in an interview conducted in the presence of the diorama. But what I did not anticipate, or notice in the course of listening to and indexing the interview, was what the colored patterns of my map of the interview would suggest about how the town anchored Nick’s memories of his past beyond the town limits.
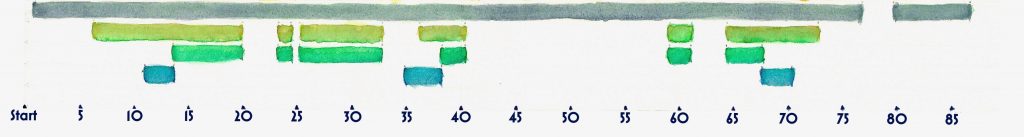
The long green “farm” lines that separate every discussion of Schefield visibly testify to the dominance of that space inNick’s memories of a long life of farming, and the pairs of brief blue lines dotting each half of the interview mark a life in which the house was more a place to retire than a space to entertain or relax. But the pattern of long green lines filling the gaps between yellow lines suggest to me that the specific structures of Schefield are better able to house and organize Nick’s memories than the open space of the farm. The interview begins and ends with Schefield, and every segment that moves beyond Schefield seemed to naturally segue from Nick’s concrete memories associated with Schefield’s specific buildings. The long green lines follow and fore the yellow (and red and orange) in a pattern that mirrors the rhythm of
Nick’s childhood spent boarding at the School in Schefield, then returning home to the farm. The colors tell a story not only of what places dominate Nick’s memory, but the sequencing of how he experienced those spaces. And the hard-edged structures of Schefield, recreated in miniature in Nick’s current living room, allow him to revisit the ritual regularity of church and school that the rest of his memories appear to be anchored to.
At the beginning of this project I thought that my completed contribution would focus on Nick’s diorama–that my training as an art historian would compel me to explore the details of when, why, and how Nick created the form of Schefield in his living room. Instead, I appropriated Nick’s technique. I was inspired by Nick and his diorama to use the language of color and form to illustrate and access my own memory and comprehension of his interview and emulate the process of miniaturization.
In his interview, Nick expresses his motivation for building the diorama as a way to prevent the town where he grew up from being forgotten. By recreating the town in the dimensions of a card-table, he made the now-vanished Schefield tangible and accessible to family, friends, and neighbors in a way that allows them connect to the space of Nick’s formative memories. Nick’s diorama inspired me to further condense this man’s history to a number of pixels on a web page…which now, help to make the space of his memories visually accessible to anyone with a computer or smart-phone.
Here are 90 years of memories condensed to 88 minutes of audio, condensed to 13 pages of an index-log, condensed to 22 inches of colored bars, now scaled to fit on a screen as small as your hand. And somehow, the process of repeatedly shrinking the documentary records of this man’s life seem to be expanding it.