Marginal Poll Responses (static version)
The online version of this book includes live statistics for responses to the Marginalia Attitudes Participant Survey. This static page documents snapshots of participant responses.
This page was last updated in December 2019 during the beta run of The Woman in White: Grangerized. At the time of last update, eight participants had taken the survey.
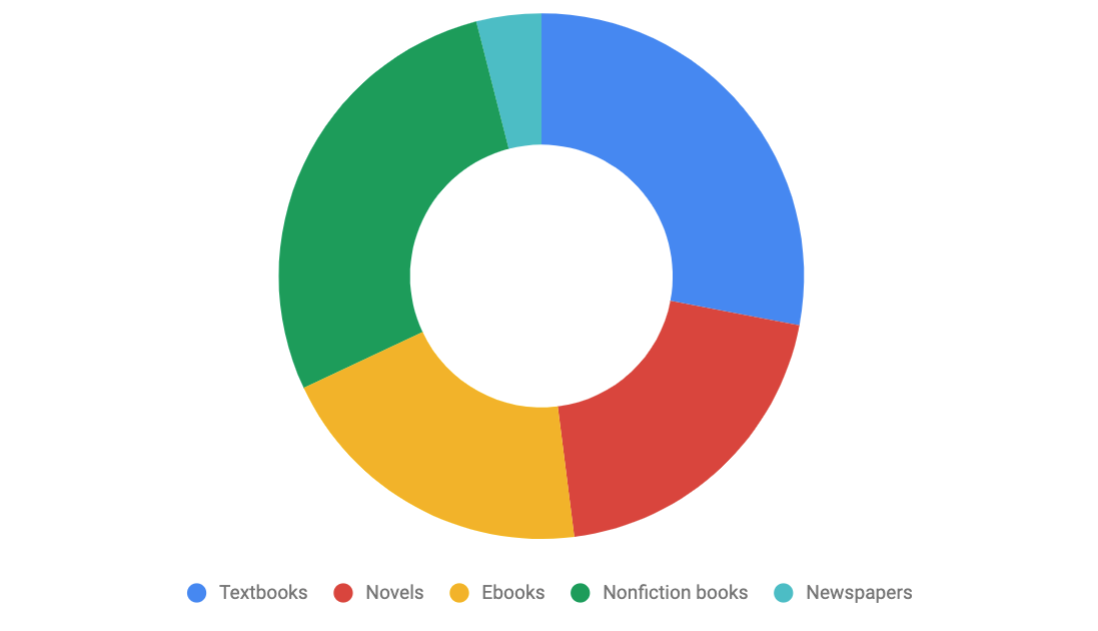
What do you annotate?
| Medium | Number of responses | Percent of total responses | Percent of respondents |
| Textbooks | 7 | 28% | 87.5% |
| Nonfiction books | 7 | 28% | 87.5% |
| Novels | 5 | 20% | 62.5% |
| Ebooks | 5 | 20% | 62.5% |
| Newspapers | 1 | 4% | 12.5% |
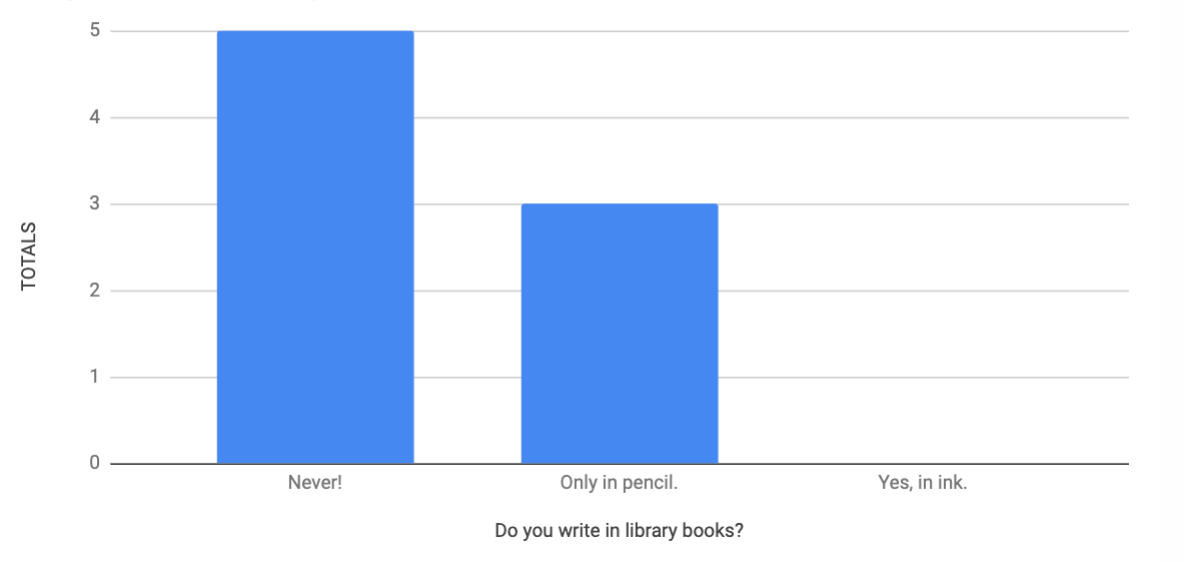
Do you write in library books?
| Response | Number of responses | Percent of total responses |
| Never! | 5 | 62% |
| Only in pencil. | 3 | 37% |
| Yes, in ink. | 0 | 0% |
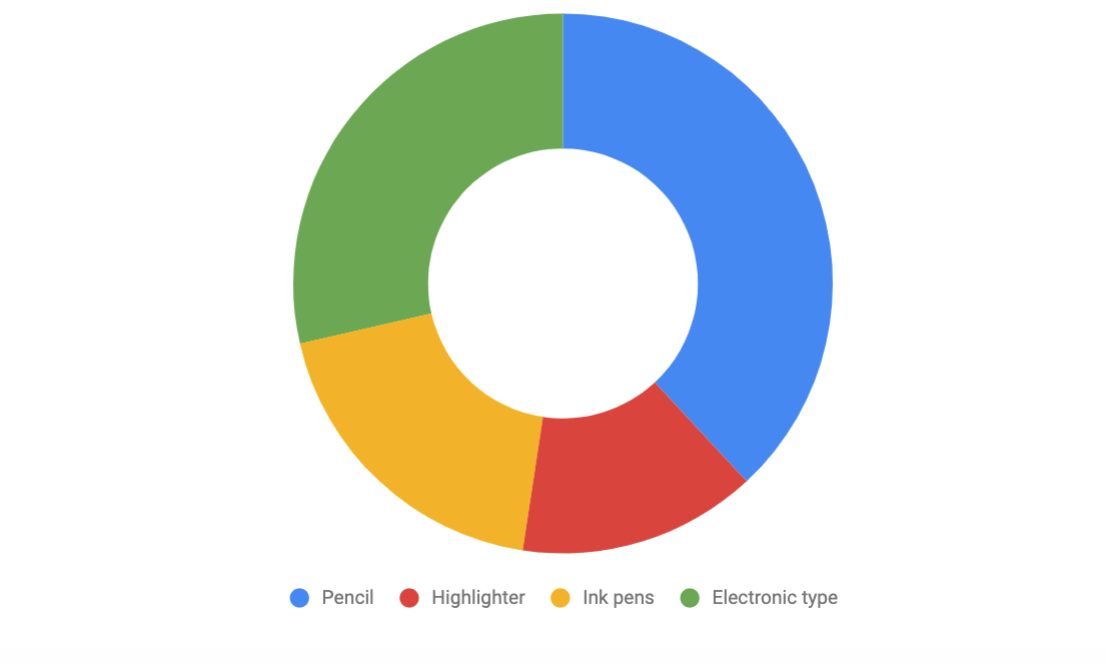
Which media do you use to write or draw in texts?
| Medium | Number of responses | Percent of total responses | Percent of respondents |
| Pencil | 8 | 38.1% | 100% |
| Electronic type | 6 | 28.6% | 75% |
| Ink Pens | 4 | 19.0% | 50% |
| Highlighter | 3 | 14.3% | 37.5% |
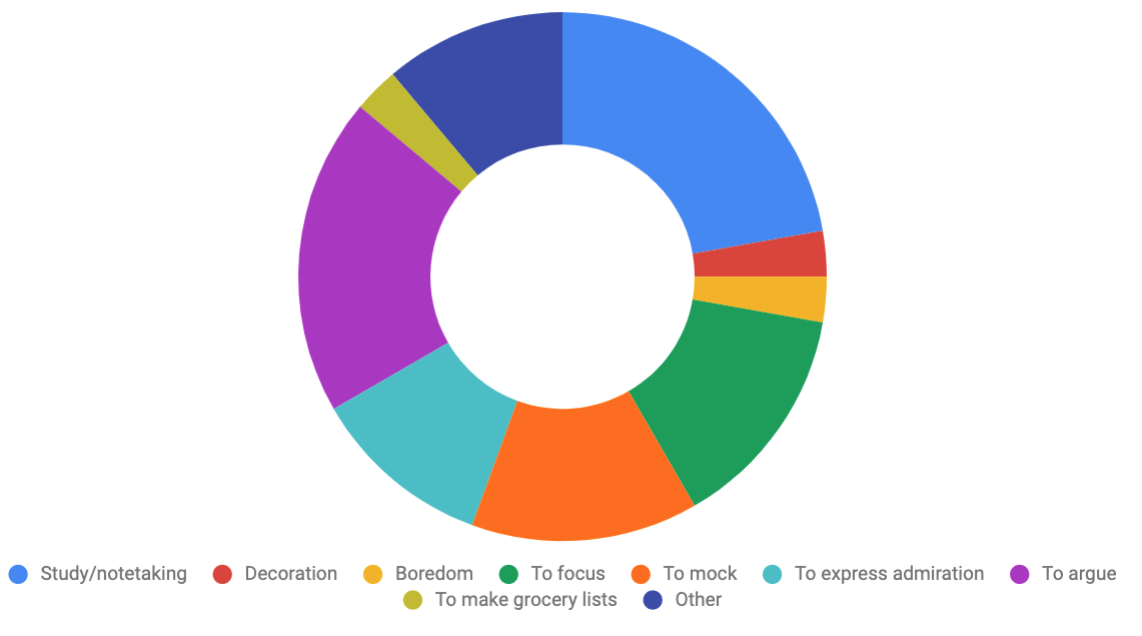
Why do you write or draw in texts?
| Motivation | Number of responses | Percent of total responses | Percent of respondents |
| Study/notetaking | 8 | 22.2% | 100% |
| To argue | 7 | 19.4% | 87.5% |
| To focus | 5 | 13.9% | 62.5% |
| To mock | 5 | 13.9% | 62.5% |
| To express admiration | 4 | 11.1% | 50% |
| Decoration | 1 | 2.8% | 12.5% |
| Boredom | 1 | 2.8% | 12.5% |
| To make grocery lists | 1 | 2.8% | 12.5% |
| Other | 4 | 11.1% | 50% |


