Lab 3: BACKGROUND
To determine whether our PCR resulted in the desired DNA fragments that will allow us to do Gibson Assembly, we will run a small amount of the PCR product on an agarose gel.
Part 1: Agarose Gel Electrophoresis
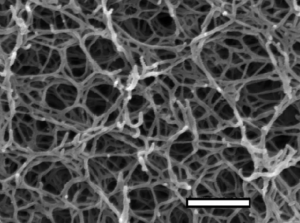
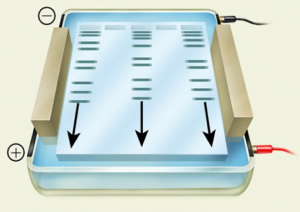
Agarose forms a porous gel, as seen in the micrograph image below. You load your DNA in the wells at the top and apply a current, forcing the charged DNA molecules through the gel. This separates the DNA by size, with the smallest DNA fragments able to migrate more quickly through the pores and running farther down the gel.
Different concentrations of agarose are used in gels depending on the relative sizes of the DNA fragments expected or the separation desired; in this experiment you will be running a 1.0% agarose gel. The molecular weight of DNA determines its rate of migration. Typically, the smaller the molecule, the faster it will migrate through a gel. However, DNA pieces of the same size can have different mobilities depending upon whether their shape is linear, circular relaxed, or circular supercoiled. Circular supercoiled DNA migrates faster than either linear or circular relaxed DNA, while linear DNA typically migrates faster than circular relaxed DNA.
Samples containing DNA are mixed with a solution containing bromphenol blue and xylene cyanol as tracking dyes; the bromphenol blue migrates at about the same rate as a 0.3–0.5 kb fragment and the xylene cyanol migrates similarly to a 4–5 kb fragment. Sucrose is also added to make the sample denser than the buffer so the sample will sink to the bottom of the well when it is loaded. Generally about 2 μL of loading dye is added per 10 μL of sample.
For additional information about agarose gel electrophoresis, please see the appendix: Appendix 3: Additional laboratory details
Preparing your agarose gel
In lab, you will be making 1% agarose gels in TAE buffer. Each pod will make 50 mL of agarose solution to pour two ~25 mL gels.
w/v% = weight of agarose in gram/volume of solution in milliliter
Analyzing your Gel: Ethidium Bromide Staining
Since DNA alone cannot be detected in a gel, ethidium bromide (“EtBr”), a fluorescent dye, is added to the DNA. Ethidium bromide intercalates between the bases of double-stranded DNA or RNA.
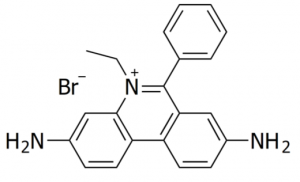
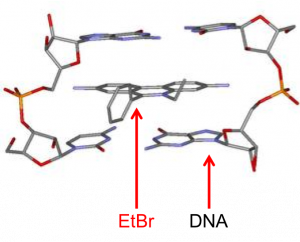
EtBr absorbs UV light at 302 nm and produces a reddish-orange fluorescence at 590 nm; the amount of this fluorescence is proportional to the mass of the DNA. Therefore, if you shine UV light on your gel, the EtBr will fluoresce, thus visualizing your DNA.
The ladder you load on your gel has bands of known size. This will allow you to estimate the size of your DNA fragments by comparison. A pdf containing information on the ladder we will be using, including the sizes of the bands, is available here (pdf opens in a new tab): NEB quick load DNA ladder
Part 2: Preparing for Gibson Assembly
Restriction digest
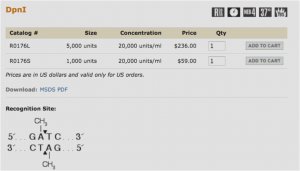
Restriction enzymes are proteins that cut dsDNA at very specific recognition sequences. The enzyme you will be using (DpnI) recognizes methylated DNA. E. coli contains enzymes that naturally methylate its DNA, so that any plasmid that originated in a bacterium will be methylated. Our PCR products, however, will not be methylated and so will not be digested by DpnI. This digest then allows us to eliminate the template plasmids, which are not the clones we are trying to obtain, but are still present in the PCR tubes along with our products.
The New England Biolabs website is an excellent source of information on restriction enzymes and digestions (link opens in a new tab): www.neb.com
DNA Purification
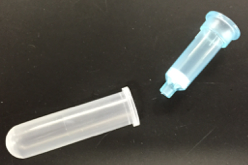
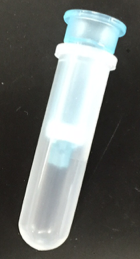
After digestion, DNA must be purified using a spin column. The spin columns contain a resin (white) that will bind to DNA, while other components will flow through into the collection tube.
For more molecular details on spin columns, please see the lab manual appendix: Appendix 3: Additional laboratory details
Spectrophotometric Determination of DNA Concentration and Purity
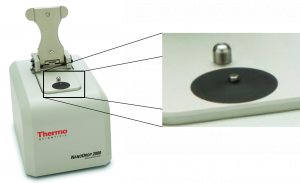
Biological molecules absorb light of different frequencies in a characteristic manner, and we can take advantage of this using spectrophotometry. In general, DNA exhibits maximum absorption of light at 260 nm. In this lab, we will use a spectrophotometer called a NanoDrop to measure the absorbance at 260 nm, or A260, of your purified DNA samples. The NanoDrop reads 2 μL of sample. The inset image below shows the pedestal (within the black circle) where the 2 μL of sample needs to be placed.
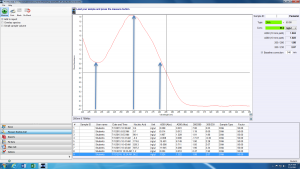
Look at the sample NanoDrop absorbance plot below. The arrow in the center highlights the point of most interest to us: the absorbance at 260 nm. The NanoDrop uses this number to calculate the concentration of DNA (96.2 ng/uL in this example).
The absorbance at 230 nm (left arrow) should be low. If it is high, it may indicate a small molecule contaminant, such as EDTA or carbohydrates. Expected A260/A230 values for pure DNA are in the range of 2.0-2.2. If the ratio is appreciably lower, it may indicate contaminants that absorb at 230 nm.
The absorbance at 280 nm (right arrow) should also be low. The expected A260/A280 value for pure DNA is ~1.8. If the ratio is appreciably lower, it may indicate the presence of protein in your sample.