
Geography/Environmental Studies 339
Climate Change as an Environmental Justice Issue
Learning Objectives
This chapter concerns the differences in vulnerability to climate change experienced by different countries and social groups around the world. By working through this chapter, you will be able to:
- Explain why climate change is a global environmental justice issue;
- Describe the general distribution of greenhouse gas (GHG) emissions around the world;
- Characterize the reasons why different countries or social groups are more or less vulnerable to climate change than others;
- Describe what is meant by exposure, sensitivity, and capacity to adapt as dimensions of climate change vulnerability;
- Characterize the vulnerability to climate change of peoples within Bangladesh and the Sahelian Region of West Africa;
- Describe how groups in these two areas respond to biophysical changes associated with climate change, and;
- Characterize why different groups are more vulnerable than others within these case study areas.
Climate change is a global environmental problem but it is important to recognize that responsibilities for it and its burdens are not shared equally by the world’s population. A relatively small portion of the world’s population have contributed to most greenhouse gas emissions. These emissions have led to global climate changes that have negatively impacted people around the world, most of whom have contributed very little to global greenhouse emissions. In this way, climate change represents a global environmental justice issue driven by unequal responsibilities and burdens. This chapter explores climate change as an environmental justice issue by first describing the nature of unequal benefits and burdens followed by case studies of two areas in the world that the burdens of climate change greatly exceed the benefits associated with the relatively meager greenhouse gas emissions: Bangladesh in South Asia and the Sahelian region in West Africa.
Uneven Benefits and Burdens of GHG Emissions
Responsibilities for, and Benefits from, GHG Emissions
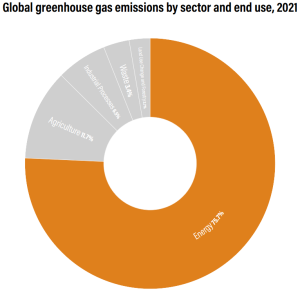
Different human activities result in the net release of greenhouse gases (GHG). As shown in the figure below, the vast majority of global greenhouse gas emissions are produced by the burning of fossil fuels to provide us heating, manufacturing power, transportation and electricity (75%) with non-energy sectors such as agriculture (livestock and rice), land uses (net deforestation and burning), and waste (methane produced in landfills) accounting for just the remaining quarter. An interactive version of this chart, including more specific GHG-generating activities contributing to these numbers, can be found here.
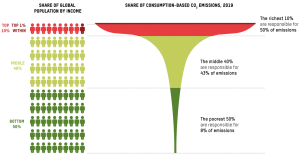
 Through their larger rates of consumption of goods and services, fueled largely by fossil fuels, the world’s wealthy are responsible for a significant fraction of global greenhouse gas emissions. As shown by the figure below, the 2019 consumption of the richest 10% of the world’s population was responsible for 50% of global greenhouse gas emissions, while the poorest 50% produced 8% of emissions. As we will learn, this variation is not only due to the individual life choices, but by a range of factors affected by government policies in places where the wealthy live and consume such as energy and transportation infrastructure, building codes, waste disposal, etc.
Peoples, economies, and countries each benefit differently from the human activities that result in GHG emissions — most importantly fossil fuel use. The world’s wealthy are largely found in the world’s richest countries within the industrialized world. The figure below shows the greenhouse gas emissions (expressed in CO2 equivalents) from the consumption of an average citizen across countries in the world. For example, in 2022 the consumption emissions of the average person from Brazil was 2.2 tons of CO2equiv and that of the average Chinese citizen was 7.2 tons of CO2. Compare these to the average American, whose consumption emissions were 16.5 tons of CO2 in 2022.
Although the difference in GHG emissions between countries is important to consider in debates about global GHG responsibilities and thus the development of international agreements – a focus of the next chapter – there are also important differences in GHG emissions within countries. The graph below shows us a comparison of carbon emissions between more affluent places and nearby poorer areas in two U.S. metropolitan areas (Los Angeles, CA and Boston, MA).
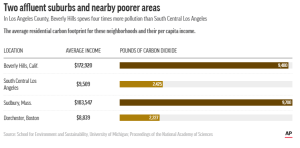
Despite being close to one another, you can see that wealthier areas have significantly higher GHG emissions from poorer areas, even within wealthy countries. Still, GHG emissions are not solely explained by the wealth; not all wealthy countries or communities within countries have high emissions levels. Look, for example, at a comparison between the US, Canada, the Netherlands, and Sweden in this figure which plots countries’ per capita consumptive GHG emissions against per capita GDP. Countries on the to the right in the graph have higher average wealth per person while those toward the top of the graph have higher average GHG emissions per person (size of circles represent national populations).
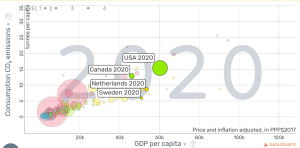
In 2020, all four countries had relatively similar GDPs, but very different emissions levels. Note that the bubble size corresponds with the country’s population.
Despite relatively similar incomes, the US had significantly higher consumption emissions (15.4 tons of CO2/yr) than the Netherlands did (8.67 tons of CO2/yr). Canada, which has the lowest GDP per capita of the four, still had higher CO2 emissions than both Sweden and the Netherlands. It is important to keep this variation in mind since we will be exploring climate change mitigation strategies in subsequent chapters that can maintain the material well-being of human communities at significantly reduced greenhouse gas emissions.
Go to the Gapminder website and look at an interactive version of the chart above to answer the following questions.
Burdens of GHG Emissions
Vulnerability to Climate Change: Exposure, Sensitivity, and Capacity
Not only do we bear unequal responsibility for the buildup of greenhouse gases in our atmosphere but the effects of climate change are also unevenly distributed. Climate changes vary across the globe and different areas of the world are more vulnerable to the effects of climate change (temperature rise, drought, flooding, sea level rise, etc.). Those who have benefited from the release of GHG emissions are not those that bear most of the costs with respect to social and ecological impacts.
Given that changes to our climate are long-term, vulnerability to climate change indicates a susceptibility to harm, and refers to a dynamic condition, meaning it changes over time. The concept of vulnerability can be applied to different types of social groupings, from households to communities to nations. No matter which grouping is considered, climate change vulnerability is highly uneven across the globe due to difference in three dimensions of vulnerability: exposure to the physical effects of climate change, the sensitivity of human societies to these changes, and the variable capacities of human societies to adapt. Each of these dimensions will be discussed below.
Exposure to the physical effects of climate change
While it is a global phenomenon, the physical effects of climate change are variable across the world. This means that different places, and the people who live there, will be affected by, or exposed to, the physical effects of climate change differently. Sea-level rise is one example. As shown here, sea-level rise due to climate change is expected to cause increased land loss. The figure below shows the projected number of people affected by sea level rise in each country by 2050.
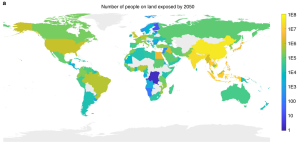
As can be seen, countries in Southeast and East Asia are particularly exposed (shaded in lighter colors). 70% of the global population projected to be affected by sea level rise live in the countries of China, Bangladesh, India, Vietnam, Indonesia, Thailand, the Philippines, and Japan.
Storms, particularly hurricanes, and their impacts, are another example of exposure. Rising temperatures will increase the prevalence and force of hurricanes, tornados, and storms due to the increased heat energy within the atmosphere. While coastal areas are most vulnerable to hurricanes, it is difficult to predict their exact location and thus climate scientists can only predict an increase in likelihood of hurricanes in the areas prone to them. While there have been major advances in global circulation modeling, changes in rainfall are very difficult to predict. Rainfall is affected by a range of interacting factors including: shifts in atmospheric circulation, ocean circulation patterns (e.g. El Nino, El Nina), proximity to mountains and ocean coastline, and heat distribution and its effect on atmospheric moisture. Below is map showing estimates in changes in precipitation by the end of the 21st century, published by NOAA.
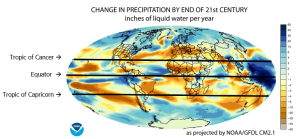
Many developing countries are located in the tropics, defined as the area falling between 23.5 degrees north and south of the equator. The climate in the tropics is monsoonal, with rainfall being highly seasonal falling the hemisphere’s summer and declining as one moves north and south of the equator. Some models predict a narrowing of the latitude band affected by monsoonal dynamics resulting in the areas directly around the equator getting wetter and the areas moving away from the equator getting drier. You can see this in the map above, as affected by topography and ocean proximity, with a blue band (wetter) right at the equator, and areas of increased dryness as one moves away from the equator. Tropical areas such as the Sahel Region in West Africa, where agricultural productivity is already constrained by limited rainfall, would get even drier based on these models.
Changes in monsoonal climate are very difficult to model, not only because of the differential warming of lower atmosphere driving rainfall patterns, but also because of ocean circulations. These interactions can have significant threshold effects leading to the potential for dramatic changes. One change of particular note is the weakening of the Atlantic Meridional Overturning Circulation (AMOC) which brings warm waters north from the equator and cooler waters to the south in the Atlantic Ocean. This weakening has the potential to shift the monsoonal rainfall zone north of equator further south, which will exacerbate the drying in the semi-arid tropics described above in the northern hemisphere (such as the Sahel). For more information about the AMOC and why climate scientists are worried about it weakening, please watch the first 3 minutes of this video.
Sensitivity to physical changes caused by climate change
Differences in sensitivity, or the degree to which people and their environments can be harmed by the physical changes of the climate changes that they experience, are another aspect of vulnerability. Societies with a large fraction of their population in rural areas and with economies dominated by agriculture are often seen as more sensitive to climate change than those with more industrial or service sector economies. Moreover, those that are poor with inadequate health infrastructure and limited government safety nets are also seen as more vulnerable. Clearly, many factors contribute to a social group’s sensitivity to climate change and all of them are distributed unevenly across the world. For example, the figure below shows the fraction of national populations living in urban areas. If we consider rural residency as a sign of dependence on agriculture, lower urban population percentages among African, South Asian and Southeast Asian countries suggest higher sensitivities (all else equal).
This second map provides an idea of the sensitivity of a population to changes in the prevalence of disease vectors, heat, and any malnutrition caused by food shortage tied to climate change. Areas of the world without a significant health infrastructure would be more vulnerable to these negative impacts on human health. As you can see, there are some countries, such as Niger, in West Africa, that might be considered highly sensitive to climate change, given their low expenditures on health and high reliance on agriculture, whereas countries like France have high health expenditures and are significantly more urbanized, so they may not be as sensitive to the effects of climate change.
Capacity to adapt to climate change
Capacity to adapt is the degree to which communities and societies can mitigate the potential for harm by taking action to reduce their exposure or sensitivity to the physical effects of a changing climate. Like sensitivity, human societies with limited wealth, low education levels, limited infrastructure, and few technological options are seen as having lower capacities to adapt. The ability of the society to shift its activities and develop new approaches is tied to adaptation capacity. Health spending, for instance (map above), not only affects sensitivity to climate change but also a society’s ability to shift its health services and conduct research to address newly experienced threats to human health.
It is important to note that equating the capacity to adapt based simply on various measures of technological and financial resources to innovate is misleading. A society’s ability to adapt also depends on its political ability to utilize these technological and financial resources. Countries that have nonfunctional political systems, skepticism of science, or have a high prevalence of climate change denialism, may have lower capacities to adapt, even with sufficient technological and financial resources.
If we consider a society’s sensitivity and capacity to adapt to climate change, one simple conclusion is that poorer societies are likely to be more vulnerable to climate change effects (assuming for now that exposure to physical effects are equal).
Since a country’s wealth is thought to reduce its sensitivity and increase its capacity to adapt to climate change, vulnerability to climate change is generally highest among those countries who have contributed least to its cause (GHG emissions).
Considering Vulnerability
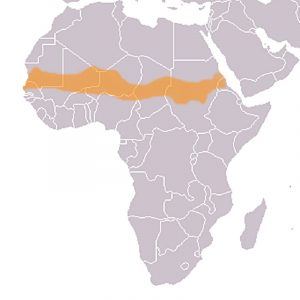
Two examples of places in the world that have contributed very little to the problem of climate change while at the same time are extremely vulnerable due to sensitivity and limited capacity , but also due to high exposure are Bangladesh and the Sahel region of West Africa. Both are locations that climate models predict will experience substantial impacts from climate change. As a low-lying coastal country, Bangladesh is exposed to sea level rise. The Sahelian region, lying just south of the Sahara desert, is exposed to increased variability of rainfall affecting the incidence of both drought and flooding. Both offer examples of 1) the ways in which vulnerable populations may be affected, and 2) the adaptation measures that may be necessary for individuals, households and governments to adopt.
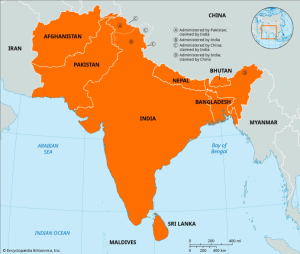
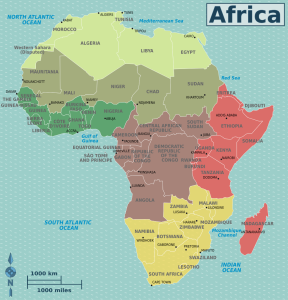
Make sure that you can find Bangladesh on the map of South Asia to the left and the West African Sahelian countries (Senegal, Mali, Burkina Faso, Niger, and Chad ) on the map of Africa to the right.
Considering vulnerability: Bangladesh
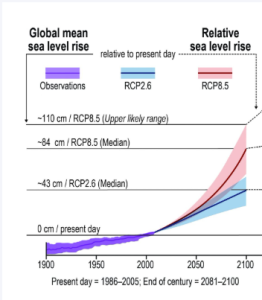
Sea level rise is expected to have a major effect of the warming of the earth’s climate due to the melting of land-based ice with the released water ending up in the oceans. Due to this phenomena, various estimates have been made about predicted sea level rise. For example, in 2019 , the Intergovernmental Panel on Climate Change, the international scientific body charged with synthesizing the available data on the effects of climate change, estimated global mean sea level rise under a range of scenarios, with a blue line, representing sea level rise if steep cuts in emissions were to occur and the red line representing sea level rise with continued high GHG emissions (see figure below).
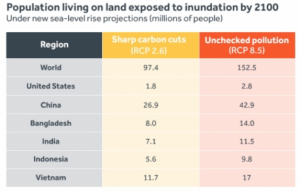
Subsequent estimates incorporate new understandings of a more rapid breakup of the Antarctic ice sheet, with warming resulting in a more rapid sea level rise. Using these estimates, a study by the research organization Climate Central predicts the land that will be lost, and the associated number of people affected due to rising sea levels by 2100 based on the same IPCC scenarios (different degrees of warming) described above. While this provides only a partial list of the countries affected, this and other studies point to South, Southeast and East Asia being particularly exposed to future sea-level rise.
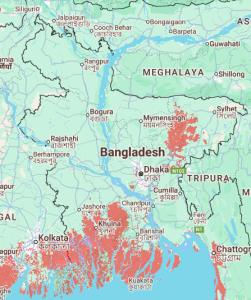
Bangladesh is one of the world’s most densely populated countries and a top exporter of clothing globally – it is likely that you own clothing that was made there. It is also one of the most exposed countries to sea-level rise. This reflects the significant percentage of its land area that is within several meters of the current sea level. The added risks of sea level rise are not simply those caused by the gradual inundation of land as sea levels exceed the land’s elevation. Increased risks of salt water intrusion as well as the increased flooding and top soil erosion caused by more destructive storm surges at higher sea levels are even more important because they reduce arable agricultural land and safe drinking water. In addition, climate models suggest that changes in rainfall patterns tied to the monsoons will also increase the chance of flooding under climate change.
The effects of these exposures is magnified by the sensitivity of Bangladeshi society due to widespread poverty and to the fact that more than half of the population lives in rural areas (as of 2024) and thus depends on agriculture (see the earlier map). In this way, Bangladesh represents a range of developing countries vulnerable to sea-level rise, such as Vietnam, India, Thailand, China, and Myanmar as well as Island Nations such as the Maldives, the Philippines, and the Marshall Islands.
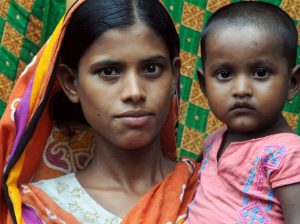
In evaluating how people are vulnerable, it is very important to consider the social and economic systems that affect peoples’ lives. For example, in a country like Bangladesh, where women tend to have fewer resources to acquire income than men, gender affects vulnerability. A female-headed household may be more sensitive to flooding or sea level rise than a male-headed household simply because a woman will have a harder time finding income to repair the family’s house and to reestablish fields.
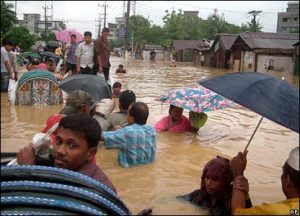
Watch the three videos on Bangladesh climate migrants below. As you watch, consider the following questions:
- People in the US who have resources to fall back on during hard times often have savings accounts in banks or retirement accounts. What kinds of resources do Bangladeshi villagers depend on? Why are those resources less transferable (than, say, a bank account) when they migrate?
- What kinds of resources are offered to Bangladeshis who have lost their homes in storms?
- Is there a difference between Bangladeshis and Americans when they lose their homes to weather events? How are their experiences different? Why?
For this video, you can stop after the three-minute mark.
Although these videos are about an older storm, Bangladesh has continued to experience severe weather (cyclones and flooding) in subsequent years , displacing hundreds of thousands and causing billions of dollars of damage. Bangladesh has also been putting in place successful mechanisms to deal with storms like this, such as their National Adaptation Programme of Action, early warning systems, infrastructure upgrades, and storm shelters that serve numerous community purposes, and planting mangroves to act as storm buffers, with considerable success; the death toll from has dropped significantly. Bangladeshi representatives serve as advisors to leaders in places like New York City, who are only now grappling with major flooding.
Considering vulnerability: The Sahel
Like Bangladesh, the Sahelian region lies in the tropics (+/- 23.5 degrees latitude) but it is farther from the equator and therefore drier. The word “Sahel” means “shore” in Arabic — the region which serves as sparsely-vegetated shore of the “sea” which is the Sahara Desert. It has long been an area of variable and sparse rainfall with native vegetation best described as steppe (brush land) changing, with increasing average rainfall, into savanna as one moves south from the desert edge. Despite the sparse rainfall, the Sahel, including the famed city of Timbuktu, has been home to farming communities for thousands of years. Rains always come during the rainy season, which is the northern hemisphere’s summer. Within that period though, rains are often highly variable.
As described earlier, predicting changes in rainfall due to climate change is difficult anywhere and is especially difficult for the tropics. In general, climate change in the tropics is predicted to make dry areas farther from the equator drier and wet areas, closer to the equator, wetter. The Sahel, as a drier region, is predicted to become drier with climate change. The historical record of rainfall supports this. The figure below shows annual deviations of regional rainfall for the Sahel from its long-term average.
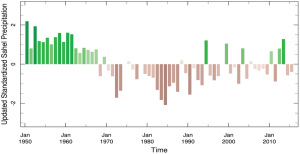
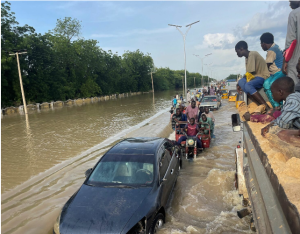
Since the early 1970s, there has been a significant drying trend with some recovery of rains since 2000. The rainfall “recovery” has been marked by changes in the distribution of rainfall within the rainy season, with more rain falling in large events separated by dry periods (associated with early cessation of the rainy season). This explains the flooding that has occurred during some recent years of harvest failure, such as in Niger in 2022. In 2025, floods killed over 150 people in Nigeria.
As in Bangladesh, the people of the Sahel are some of the world’s poorest, with large fractions of the population dependent on agriculture. The changes in the climate, with rains coming late or ending early, or even causing flash floods, affect how farmers grow their crops. Inadequate or poorly timed rains can mean farmers get little or no harvest. Sahelian farmers have been dealing with these kinds of conditions for a very long time, but conditions are becoming increasingly difficult. Grain (millet or sorghum) is the staple food for all families, but local grain prices all rise rapidly during periods of shortage (drought years and near the end of the dry season when grain stocks become depleted).
Most rural families attempt to reduce the risk of food shortage and malnutrition through involvement multiple livelihood activities (economic diversification) including crop agriculture (which provides major food staples), livestock husbandry (livestock is major store of wealth that can move to where rain occurs), and seasonal labor emigration to more resource-rich areas to the south (a source of cash). Small families and those lacking land and livestock are the most vulnerable. Women, due to their limited access to agricultural land, are often vulnerable if their husbands have left to find work elsewhere. Thus, while there are significant differences in the risks facing Sahelian societies, the distribution of these risks shows some similarities to the situation in Bangladesh.
Consumption-based greenhouse gas emissions trace the greenhouse gas emissions stemming from the consumption of goods and services (by an individual, group, or nation) no matter where these greenhouse gas emissions are produced. Emissions across the whole lifecycle are included from extraction, processing, manufacturing and disposal.
Greenhouse gas emissions include emissions of gasses such as methane, nitrous oxides and carbon dioxide or CO2. Reference to all such gas emission is often expressed in units of CO2 of equal warming potential or CO2 equivalents. Unless otherwise noted, expressions of GHC gas emissions in tons of CO2 actually refer to tons of CO2 equivalents.
GDP stands for Gross Domestic Product which is the monetary value of all the goods and services purchased within national borders by persons, businesses, governments. It is a measure of the circulation of money and is commonly used as a measure of a country's wealth.
The numbers on the figure are expressed in scientific notation with 1E6 referring to 1 times 10 to the sixth power or 1 million (1,000,000).
North of the equator, rainfall generally falls between April and October with shorter rainy seasons as one moves north toward the Topic of Cancer. South of the equator, with rainfall generally falling between October and April with shorter rainy seasons as one moves north toward the Topic of Capricorn.
Bangladesh and the Sahel have very low GHG emissions. In 2023, Bangladesh averaged 0.66 tonnes per person of GHG; the Sahel region averaged 0.29 tonnes per person. The global average is just under 5 t/per capita; the US emitted 14.3 t/per capita in 2023.