
Wisconsin Climate Impacts
Climate Map
Your next step is to start to consider what these changes will mean to people in Wisconsin. Please visit the climate map by clicking on the image below:
The web page requires flash to display the map, so be sure to allow flash on this page. Read the directions (in grey) carefully before you begin. Click “Begin Using Map” when you have read the directions.
About the map:
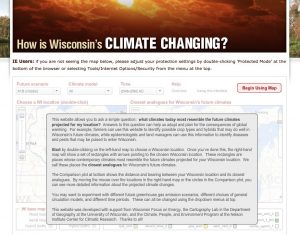
The map at right shows proxies for Wisconsin’s future climate. You will click on a location, and the new rectangles (pop-up boxes) on the map to the right will tell you which current climates are likely to resemble your chosen location’s future climate.
Practice example:
Click on Madison on the left-hand map. According to the average of all of the climate models (the line & rectangle in red), which Illinois city has a climate similar to what Madison’s will be like in the middle of the 21st century? Note that you can click and drag the map to see different areas of it. (The answer is Springfield).
Remember, you can scroll around the window that contains the map by going to the right or bottom to use the scroll bars.