
Geography/Environmental Studies 339
Challenges to International Agreements Addressing Climate Change
Learning Objectives
By the end of this chapter, you should be able to describe:
- The strengths and weaknesses of different metrics to measure greenhouse gas emission responsibility among countries;
- The categories of responsibility designated in the Kyoto protocol;
- Why major emitters resist participating in climate agreements, and;
- The pros and cons of voluntary vs. binding greenhouse gas reduction targets.
International Climate Agreements

Our atmosphere is truly a global commons shared by us all. Only recently have we recognized that human activities, through changes in the chemical composition of our atmosphere, can strongly change our climate (this new understanding is behind the idea of the Anthropocene). To reduce the extent of climate change, countries need to reduce their release of greenhouse gases (GHG). To do so, countries need to develop agreements, policies or rules that lead to such reductions, and ensure that parties to the agreement comply. In this chapter, we will explore the challenges in developing and enforcing reduction targets by looking at the Kyoto Protocol, an international agreement that sought to establish binding GHG reduction targets on countries. The experience of the Kyoto Protocol illustrates the challenges faced by forging such agreements including:
- Ethics of responsibility
- Metrics for distributing responsibility
- Assigning responsibility
- Overly simplistic categories and complex realities
We will start by learning about the Montreal Protocol - a very successful international agreement based on binding targets, which served as the model for the Kyoto Protocol.
The Context for Kyoto: The Montreal Protocol
The international community’s approach to reducing GHG emissions has been both motivated and guided by the success of the Montreal Protocol (1987) to reduce the release of ozone-depleting chemicals into the atmosphere.
Scientists observed an erosion of the stratospheric ozone shield (an “ozone hole”) in 1985 over Antarctica. In 1987, an international agreement was signed to protect the ozone layer by eliminating the manufacture and use of “ozone depleting substances” such as CFCs. This agreement, called the Montreal Protocol on Substances that Deplete the Ozone Layer, came into force in 1989 and stipulated different phase-out schedules for the manufacture and use of different chemicals. Developing countries were given longer periods of time to comply with the phase-out stipulations than industrialized countries.
The Montreal Protocol had binding restrictions on ratifying countries (which included all 197 UN member states at the time), and resulted in an estimated 99% reduction in the release of ozone depleting chemicals. The reduced concentration of these chemicals in our atmosphere has led to signs of ozone recovery in the stratosphere and reduction in the size of the ozone hole over the Antarctic. For more information on the success of the Montreal Protocol, check out this video.
Kofi Annan, the former UN Secretary-General, in his September 2000 address to the Millennium Assembly of the United Nations, stated the following:
“Perhaps the single most successful international environmental agreement to date has been the Montreal Protocol, in which states accepted the need to phase out the use of ozone-depleting substances.”
Its success led to the development of new international institutions and frameworks to address novel understandings of how human society was changing climate, including the Intergovernmental Panel on Climate Change (IPCC) and the UN Framework Convention on Climate Change (UNFCCC).
The IPCC and the UNFCCC
Following the dramatic success of the Montreal Protocol, international attention shifted its focus toward the growing evidence that chemical changes in our atmosphere are causing our climate to change. In 1988, 195 countries came together under the United Nations to form an intergovernmental scientific body called the Intergovernmental Panel on Climate Change (IPCC) and charged it with synthesizing current knowledge about the causes and consequences of climate change.
The 1990 IPCC report formed the basis for the United Nations’ Framework Convention on Climate Change (UNFCCC), an international climate treaty that came into force in 1994 (after 154 countries signed and ratified it). The treaty committed participating countries to voluntarily reduce GHG emissions to 1990 levels. This voluntary approach proved unsuccessful in terms of GHG emission reductions.
The UNFCCC has served as a framework for the negotiation of subsequent international treaties (called “protocols” or “agreements”) with respect to climate change mitigation. Under the UNFCCC, participating countries–called ‘Parties to the Convention’– have met yearly at ‘Conferences of the Parties’, to communicate and assess progress in mitigating climate change, establish rules and modalities, and to consider further action.
There are have been two important agreements made under the UNFCCC:
- The Kyoto Protocol of 1997 (developed at the third Conference of Parties or COP3) was an attempt to move from voluntary emission reductions to an agreement with binding reduction targets. This climate change agreement was the focus of the international community through 2015.
- A successor agreement, called the Paris Agreement, was approved in Paris in December of 2015. We will learn more about this agreement in the next module.
| Year | Agreement | Notes |
|---|---|---|
| 1987 | Montreal Protocol on Substances the Deplete the Ozone Layer | Hailed as one of the most successful international environmental agreements. Led to a significant reduction in the production of ozone-depleting substances. |
| 1988 | Intergovernmental Panel on Climate Change (IPCC) established | An intergovernmental body created under the United Nations to provide governments with scientific information to develop climate policies. Released its first assessment report in 1990 which formed the basis for the UNFCCC. |
| 1994 | United Nation's Framework Convention on Climate Change (UNFCCC) | International environmental treaty adopted at the Earth Summit in Rio de Janeiro in 1992; came into force in 1994. ‘Parties’ (154 countries) that ratified the convention voluntarily committed to reducing GHG emissions to 1990 emission levels by 2000, but treaty did not include enforcement mechanisms (commitments were ‘non-binding’). Compliance was low. |
| 1995 | First Conference of the Parties (COP1) | Parties (participating countries) to the UNFCCC meet annually to assess progress in mitigating climate change. These meeting are called conference of parties (COP). The purpose of the COPs is for countries to communicate and assess progress in mitigating climate change, establish rules and modalities, and to consider further action. |
| 1997-2005 | Kyoto Protocol adopted in 1997; comes into force in 2005. | KP adopted at the UNFCCC’s COP3. Protocol based on ‘common but differentiated responsibilities.’ During first period (2008-2012) of legally binding commitments, ratifying industrial countries had to reduce their aggregate national GHG emissions to 5-8% below their 1990 emissions levels by 2012. Non-industrial countries were exempted from reduction requirements. |
Measurement of the warming effect of different greenhouse gases
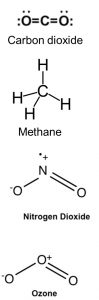 Any agreement addressing climate change must account for the warming effect of different GHG emissions. While carbon dioxide is the most prevalent greenhouse gas, other gases also absorb heat including methane, water vapor, ozone, and nitrous oxides. The molecules of these gases have different capacities to absorb heat. In addition, they remain in the atmosphere for different time periods. To estimate the relative global warming potential of a given gas emission, one must account for both its different heat absorbing capacities and how long on average the gas molecules remain in the atmosphere after being released. For GHG accounting, the releases of other greenhouse gases are translated into CO2equiv which typically accounts for the gas’s absorptive capacity and removal from the atmosphere generally estimated over 100 years. It is important to recognize that when we refer to CO2equiv in this and other chapters, the greenhouse warming effect of the release of all GHG gases is captured. The warming potential of gases are thus most often expressed relative to carbon dioxide.
Determining responsibilities for reducing greenhouse gas emissions first requires an accounting of emissions by countries. This is not a straightforward task, and raises important questions. Should the assignment of responsibility vary depending on the type of emissions? Or the capacity to reduce emissions? How do historical emissions factor in? Keep in mind what we learned in the previous module about climate justice and let us consider the ethics surrounding the the assignment of responsibility for GHG reductions by considering some of the debates leading up to the Kyoto Protocol -- debates that continue today.
Challenge 1: Ethics of assigning responsibility
Measuring the different warming potential of greenhouse gases is complicated, 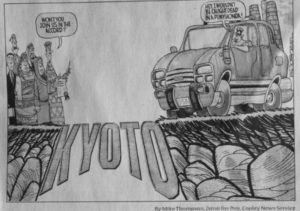 but not as complicated as the ethics behind GHG accounting. From the previous chapter, we recognize that GHG emissions are highly unequal but multidimensional and thus there are different ways in which responsibility to reduce are divided among the world's nations. A simple approach may be to state that all parties to an agreement must reduce their emissions by a certain percentage. But would this be fair? Many would say not. During the negotiations leading to Kyoto, developing countries in the Global South pointed out that the nations of the industrialized North developed by using cheap fossil fuels, and this raised two concerns: 1. most all those emissions (e.g. since 1850) tied to the industrialization and economic development of the Global North are still in the atmosphere affecting the climate; and, 2. residents in the Global South have the right to also develop.
An influential article published during this time (Agarwal and Narain, 1991) presents a common argument:
“Can we really equate the carbon dioxide contributions of gas guzzling automobiles in Europe and North America with the methane emissions of water buffalo and rice fields of subsistence farmers in West Bengal or Thailand? Do these people not have the right to live? No effort has been made to separate the ‘survival emissions’ of the poor, from the “luxury emissions” of the rich.” From: Agarwal, A. & S. Narain (1991) Global warming in an unequal world: A case of environmental colonialism. Earth Island Journal, Spring, 39-40.
Should the gases produced by the subsistence activities of the world’s poor be treated the same as the “luxury” emissions of the less numerous, but richer, populations of the world? In other words, to what extent should we distinguish between:
Emissions associated with the high levels of consumption of relatively few people, such as those by the United States
FROM
Emissions associated with the subsistence activities of the world's poor, such as herders raising livestock, those dependent on landfills, farmers growing rice, and those clearing forest for small fields?
 Finally, should a country's ability or capacity to reduce emissions be factored into international agreements? Reducing greenhouse gas emissions requires a combination of economic resources, technical sophistication, and institutional capacity. In many ways, industrial (developed) countries, which contributed a significant fraction of the world’s greenhouse gas emissions, should have the greatest capacity to reduce emissions. Their capacity stems in large part from their economic development, which was driven by cheap fossil fuels. Therefore, it could be argued that they should be expected to reduce more than developing countries. This was another one of the arguments made by developing countries during Kyoto negotiations.
Challenge 2: Metrics for distributing responsibilities
To develop binding targets, an agreement needs to develop a common metric to assign responsibilities to different countries since “you can’t manage what you don’t measure.” Deciding on an appropriate metric to assign responsibility to reduce GHG emissions is very much shaped by ethical arguments described above. If you accept that all people have equal rights to economic development, one might not accept a metric of national emissions, which increases the reduction responsibilities of populous poor countries relative to the less populous rich countries. Instead, you may argue for weighting reduction responsibilities based on average per capita GHG emissions (national emissions divided by population size).
Finally, given the long residence time of most GHG gasses in the atmosphere, there is a valid argument for distributing responsibilities to reduce based on the cumulative emissions since the beginning of the industrial revolution (1850). The residence time of emitted carbon dioxide in the atmosphere matters because it impacts how responsibility for GHG reductions would shift if we were to consider cumulative emissions since the onset of the industrial revolution.
These are the three metrics of assigning responsibilities: 1. current national emissions, 2. current average per capita emissions, and 3. cumulative historic emissions. The choice of which metric to use has major implications for measuring responsibility to reduce.
Current national emissions:
Current average per capita emissions:
Cumulative historic emissions:
Any agreement, whether binding or voluntary, requires reduction targets. Should an international agreement simply state that all countries should reduce their GHG emissions by the same absolute amount (X tons of CO2equiv per year) or should there be a percentage reduction? This has huge implications. An absolute reduction is not practical since it could lead to mandated annual reductions exceeding what some small countries actually emit during a year. Given the huge imbalance of emissions among countries, as we have seen above, a percentage reduction is the only method that has been considered in international negotiations.
Challenge 3: Assigning Responsibilities
During the Kyoto negotiations, developing countries raised concerns that binding targets with timetables (like those that existed in the Montreal Protocol) would hinder their economic development, penalizing them for current GHG emissions, and would not account for the Global North's current luxury emissions, nor for their significant historical emissions. Their arguments were met with resistance from countries in the Global North, which were concerned about the impacts of required GHG emission cuts on their economies. The United States took an especially hardline during Kyoto’s negotiations with broad domestic bipartisan support. Immediately prior to Kyoto, the U.S. Senate unanimously passed the Byrd-Hagel Resolution which stated that the United States should not be a signatory to any climate change agreement that: 1. does not include binding targets and timetables for developing as well as industrialized nations; or 2. causes economic harm to the United States.
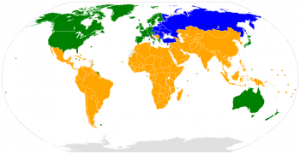 The compromise in Kyoto was to utilize an an existing categorization scheme within the UN, called Annex I (developed, shaded in green and blue) and non-Annex I (developing, shaded in orange) countries. Annex I countries were required to reduce their emissions to a level generally 5-8% less than their 1990 emissions by 2012 (except for Annex I countries in blue), whereas non-Annex I countries, including China, India, and Brazil, were excluded from responsibility to reduce.
In an attempt to provide greater flexibility to Annex 1 countries to meet their obligations and to coax the US into ratifying Kyoto, the UNFCCC passed “flexibility” mechanisms. These mechanisms allowed for emissions trading or project-based programs that gave industrialized countries credit toward their own emissions reduction targets for funding emissions reduction activities outside of their country either in: other developed countries (Annex 1) (joint implementation) or in developing countries (non-Annex 1) (clean development mechanism). These programs will be the focus of a future chapter.
To come into “force” — e.g. to become a legally binding agreement — the Kyoto Protocol needed to be ratified by at least 55 countries, and Annex 1 ratifying countries had to cumulatively contribute at least 55% of global greenhouse gas emissions. In 1997, the U.S., represented by then-Vice President Al Gore, signed the Kyoto Protocol. Each signing country to the Protocol then had to ratify the treaty through its own political process in order for the country to be legally bound to the treaty’s terms. In the U.S., this required approval by both Congress and the Executive Branch (the President). In 2001, President Bush formally announced the U.S.’s intention not to ratify the Kyoto Protocol.
Despite the US’ lack of participation, the Kyoto Protocol still came into force in February 2005 after Russia ratified it in November 2004.
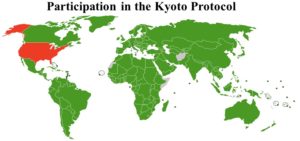
The United States (depicted in the map above in red) was alone among parties to the UNFCCC in refusing to ratify the Kyoto Protocol and therefore was not obligated to meet the Protocol’s GHG reduction targets.
Challenge 4: Overly simplistic categories and complex realities
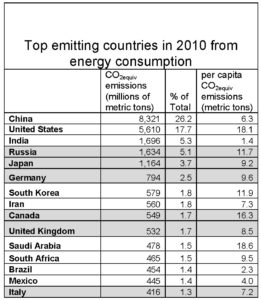
With the ratification of the Kyoto Protocol, the world entered a situation in which the three largest emitters of greenhouse gases in the world, representing close to 50% of global emissions, were not required to reduce their emissions: China and India as non-Annex I countries, and the United States as a non-ratifier. Countries in shaded rows in the table to the right are those that agreed to reduce their emissions (Annex 1 ratifiers).
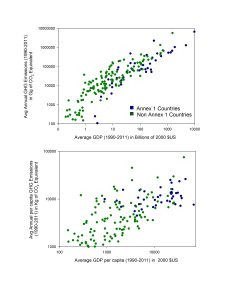
The failure of Kyoto to account for the world's three largest emitters is a result of avoiding of the ethical arguments surrounding alterative metrics to assign responsibilities (per capita, cumulative historic) to address the North-South standoff. Instead, negotiators chose to use the metric of aggregate national emissions but not require those who may have an ethical claim about luxury emissions (arguing for per capita metric) or historic emissions (arguing for cumulative metric) to reduce their emissions at all. These politically expedient categories of responsibility did not match the changing economic realities of world with many developing (non-Annex I) countries achieving high rates of economic growth and with that, significant increases in GHG emissions. The world remains highly unequal in terms of wealth and income, but placing countries into only two buckets ignores the blurring of the boundaries (at least at a national level) of the world's haves and have nots. The graphs below show the relationship between annual average GHG emissions and average GDP (top graph) and annual per capita (per person) GHG emissions with average per capita GDP (bottom graph). You may remember that we looked at this relationship in the previous module. Each country is represented by a dot with Annex 1 countries in blue and non-Annex 1 countries in green. Look at these graphs and answer the short answer questions that follow.
The other Annex I countries realized that they alone of the top emitters would be required to reduce GHG emissions, which did little to boost their resolve. The position of the United States, as both a high aggregate and per capita emitter did not help. Yet countries that ratified the protocol needed considerable resolve and commitment to ensure that they could meet Kyoto's targets, given that there was no enforcement mechanism. During the first legally binding commitment period (2008-2012), the Kyoto Protocol required that Annex 1 ratifying countries reduce their GHG emissions by 5-8% below 1990 levels by the year 2012. This figure shows the change in greenhouse gas emissions by countries from 1990-2011.
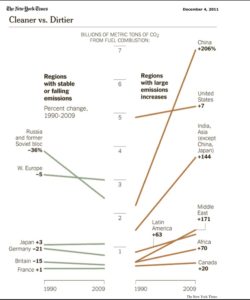
The Kyoto Protocol did have an effect, as we can see in the figure above. Countries required by Kyoto to reduce their emissions generally did so, while those that did not have reduction requirements increased their emissions during the period. Still, some Annex I countries failed to achieve 5-8% reductions. Global GHG emissions increased by 35% from 1990 to 2010 due largely to the growth of emissions among countries not required under Kyoto to reduce.
To extend the Kyoto Protocol beyond 2012, the agreement had to be either renewed or replaced (per the Protocol’s original stipulations). From November 28 to December 11, 2011, the 17th session of the Conference of the Parties (COP17) to the UNFCCC was held in Durban, South Africa to seek renewal. Given its limited effect on reducing global emissions and a standoff between largest emitters (e.g. China and U.S.), it was not renewed and was eventually replaced by a new agreement, the Paris Agreement, which we will discuss in the next module.
A term referring to a proposed new geologic epoch where human activities are fundamentally altering global physical systems (climate, landforms, nutrient cycles etc.). It is seen to replace the current geologic epoch of the Holocene which is the more conventionally recognized geologic epoch today.
Ozone (O3) is a molecule that can be found throughout the Earth’s atmosphere. The highest levels of ozone in the atmosphere are in the stratosphere (the outermost layer), in a region called the ozone layer. Ozone in the ozone layer absorbs most of the Sun’s ultraviolet light. This is important to life on Earth’s surface because high levels of UV exposure are dangerous to living tissues in plants, humans, and other animals (e.g. they can cause skin cancers, cataracts, DNA damage. etc.). Certain manufactured chemicals, particularly chlorofluorocarbons (CFCs) used as foaming agents, refrigerants, and aerosols, when released into the atmosphere form breakdown products which in turn react with ozone molecules depleting the amount of ozone in the ozone layer. Ozone depletion reduces the absorption of ultraviolet radiation and allows dangerous UV rays to reach the Earth’s surface at a higher intensity. Scientists first described this chemical reaction in the 1970s.
The IPCC published its first report in 1990 with reports issued every 5-7 years.
Though the objective of the treaty is to reduce GHG emissions in the atmosphere, the treaty itself does not include binding GHG emission limits nor enforcement mechanisms to make countries reach their stated emission reduction goals (‘legally non-binding’).
Since 1995, ‘Conferences of the Parties’ or COPS have met yearly and numbered in consecutive order.
The choice of 100 years is somewhat arbitrary and we must be aware that a given quantity of a greenhouse gas will represent a larger number of CO2equiv if evaluated over a shorter time period if that gas tends to leave the atmosphere more quickly than CO2.
In the digestive tracts of ruminants, anaerobic conditions (no oxygen) predominate and therefore a portion of organic matter consumed by ruminants in the form of methane, an important greenhouse gas.
Millions of people throughout the world rely on garbage dumps, either working or living within one.
Rice cultivation requires the flooding of land which causes the organic material in and on soils to decompose under anaerobic conditions resulting in releases in methane, an important greenhouse gas.
Some Annex I countries, largely of the former Soviet Union, were sub-classified as “Economies in Transition” (shaded blue in map) and as such had fewer emission reduction obligations under the protocol.
At the COP 6-2 meeting in Bonn, Germany 2001, several years later.