
Geography/Environmental Studies 339
Renewable Energy Transition
Learning Objectives
After completing this chapter, you will:
- Understand our existing fossil fuel energy economy (sources/sinks, subsidies, strengths/limitations)
- Understand the potential for energy conservation and efficiency as a “source” to address our energy needs
- Understand basic vocabulary of energy use and flow/power
- Understand the continued controversy surrounding nuclear power and its future prospects in a carbon-free future
- Be able to explain how alternative energy systems differ in terms of the form of supply, form of delivery and power/spatial densities
- Understand the difficulties in transitioning to a renewable energy economy,
- Be able to assess (qualitatively) how energy storage and transmission infrastructure will need to change in a transition away from fossil fuels
- Understand the role of natural gas in the shifting U.S. energy mix
- Understand the key concerns about and advantages of renewable energy
Fossil Fuel Dependence in the U.S.
Fossil fuels - coal, oil, and natural gas - are fossilized organic material derived from plants and animals. They are very dense sources of energy stored in hydrocarbon bonds which when burned, release a high levels of heat compared to other stores of chemical energy such as wood or charcoal. Coal, for example, has about three times and gasoline three to four times the energy density by volume as wood. As a result, less space and energy is needed to carry and store fossil fuels compared to biomass sources of energy. Our adoption of fossil fuels has allowed more concentrated sources of combustion derived heat and thus power. Looking at the graph below, you can see how these energy sources paved the way for our industrial revolution and the shaping of the modern world as we know it. Today, fossil fuels are the lifeblood of our modern economy: they account for more than 80% of the U.S.’s total energy consumption.
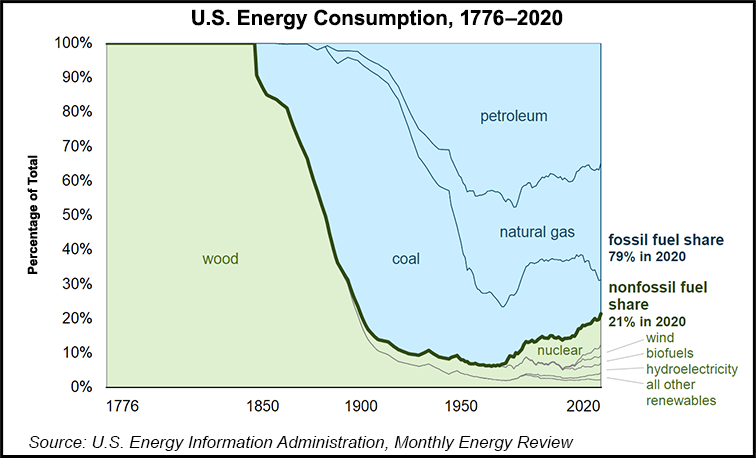
Wood was the largest source of energy in 1776, when the Declaration of Independence was signed. In 1885, coal took its place. Coal was surpassed by petroleum as the largest source in 1950.
Despite national efforts to move away from fossil fuel consumption, the U.S. still relies heavily on coal, oil, and natural gas. The figure below shows the relationship between our sources of energy (where our energy comes from) and our end-uses of energy. Take a look at how different sectors of our economy rely on different energy sources in the chart below:

It is important to recognize that our fossil fuel dependence stems in part from a history of fossil fuel subsidies. A fossil fuel subsidy is any policy or action that artificially lowers the production costs of energy from fossil fuels (like tax breaks to fossil fuel industries) or lowers the end prices that consumers pay. These subsidies can be direct or indirect, such as allocating government funding to fossil fuel research and development. Some analysts argue that the hidden costs of fossil fuels, like impacts of fossil fuel burning on air and water pollution, represent a third kind of subsidy as well. According to Oil Change International, the U.S. federal government currently subsidizes the production of fossil fuels by at least $34.8 billion per year, with around $4 billion of that added by the Trump Administration’s One Big Beautiful Bill Act in 2025. Oil/gas accounts for 84% and coal for 16% of these subsidies. Similarly, fossil fuel subsidies in the European Union totaled around $111 billion euros ($128 billion USD) in 2023.
Arguments for fossil fuel subsidies are seen by proponents as way to spur economic development and to insure adequate domestic energy supply, but they also create political and economic barriers to phasing out fossil fuel dependence. Fossil fuel companies spend billions on lobbying governments, electing sympathetic officials (local, state, national levels) and advertising to influence public opinion (including sowing doubt about climate science). Fossil fuel lobbying outspends lobbying for renewable energy by 13:1. The industry spent more than $150 million to lobby the federal government in 2024 alone. There are global political costs associated with our fossil fuel economy as well.
- Fossil fuel industries operate on large economies of scale (i.e., the greater the scale of the operation, the cheaper it becomes to produce the fossil fuel). Increasing the economy of scale often leads to concentrations of power in the hands of a few.
- U.S. dependence on imported oil has historically motivated foreign policy and military intervention in major oil-producing countries. Many of the U.S.’s military interventions in the Middle East in the past century, for example, have been motivated by continued access to cheap oil imports.
- The 2022 Russian invasion of Ukraine highlighted the contemporary role of fossil fuels in war. Russia’s wealth largely comes from its production of oil and natural gas. Many countries, including the U.S., placed bans on Russian fossil fuel imports to decrease Russia’s financial assets and funding for the war in Ukraine. However, global dependence on Russian energy products remains high, especially in Europe, and the domestic cost of these political interventions were reflected in extremely high energy prices.
“The energy crisis exacerbated by the war in Ukraine has seen a perilous doubling down on fossil fuels by the major economies. The war has reinforced an abject lesson: our energy mix is broken. Had we invested massively in renewable energy in the past, we should not be so dramatically at the mercy of the instability of fossil fuel markets now.”
- Antonio Guterres, U.N. Secretary General (June 2022)
Low-Carbon Alternatives
Moving away from our fossil fuel dependence at all scales means investing in low-carbon alternatives. Low carbon alternatives include switching from fossil fuel to renewable energy sources and nuclear power, as well as reduction of energy use overall, through conservation and efficiency measures.
Energy Conservation
We know from the graph above (“U.S. energy consumption by source and sector, 2023”) that the total U.S. energy consumption in 2023 reached 97.3 quadrillion Btu, representing about 15% of the total global energy consumption for a nation with only about 4% of the global population. Energy intensity is a measure of the consumption of energy per unit of gross domestic product (GDP). In other words, a measure of the energy consumed tied to a level of economic activity. This measure is affected by many factors. The ambient temperatures of countries and the need for air conditioning or heating, the size of the country and population density of the country affecting the viability of public forms of transportation, the degree to which a country's economy relies on the manufacturing versus service sector, which is less energy demanding.
Moreover, how we use these services will increase overall energy efficiency often with little burden on us (lowering thermostats in winter, biking to work, turning off lights when leaving a room etc.). Investments in energy efficiency have been shown to increase significantly as energy prices rise. For example, the oil embargo of 1973 led to price spikes and serious investment in energy efficiency measures in the U.S. Since then, energy intensity has declined at a rate of about 2% per year. Explore the chart below to see how the energy intensity varies from country from country and or a single country, and hit play to see change over time.
Nuclear Energy
However, there remain a number of concerns about nuclear power’s risks including:
- Persistent operating risks often tied to human error
- Risks of radioactive release stemming from natural hazards (earthquakes, hurricanes, tsunamis, tornados)
- Risks of radioactive release from nuclear facilities due to terrorism
- Unresolved technical and political issues related to long-term fuel disposal and storage
Despite these risks, many experts and politicians have argued that the zero-emission benefits of nuclear energy make it a necessary component of a clean energy future:
- “Nuclear energy is clean energy and it's vital to creating good-paying jobs, supporting our energy transition, and saving our planet.” - U.S. Secretary of Energy Jennifer Granholm via Twitter, Jan 25, 2022
- “Nuclear and renewables need to join together in the climate fight, not compete. That’s been the conclusion of nearly every study of this subject — from the UN’s panel on climate change, to the best work of our national laboratories. The case for nuclear energy is strengthened by an emerging generation of nuclear plants that are likely to be much less expensive and safe, with lower waste.” - Dr. Kerry Emanuel, Professor of Atmospheric Science at MIT
Renewable Energy
After energy conservation and nuclear, renewable energy is a third low-carbon alternative, and includes solar, wind, hydropower, geothermal and biofuels. They are referred to as 'renewable' because they are not exhaustible, in contrast to fossil fuels and nuclear, on human time scales (hundreds of years). They are also referred to as "green" not only because they are low carbon but because they also are seen as causing less environmental impacts than fossil fuels (and to some extent nuclear power). In the following section, we’ll discuss the potential and challenges of a transition to a renewable energy economy, focusing mostly on wind and solar.
Potential for a Renewable Energy Transition
Understanding the potential of renewable energy to meet our energy needs is complicated. Unfortunately, listening to politicians from both the right and left in the US does not clarify the issues. An example comes from Donald Trump in a speech comparing wind power with coal. This quote displays significant ignorance of the economics of current energy technology options.
A quite different example comes from a speech some ten years earlier by Al Gore — one of the most informed politicians on energy issues. This is a famous speech on energy policy and for those of you who would like to watch the speech in full, click here.
| Don’t worry about wind, when the wind doesn’t blow, I said, “What happens when the wind doesn’t blow?” Well, then we have a problem. Okay good. They were putting them in areas where they didn’t have much wind, too. And it’s a subsidary [sic] — you need subsidy for windmills. You need subsidy. Who wants to have energy where you need subsidy? So, uh, the coal is doing great.”
- Donald Trump, Speech in Utica, New York, August 13, 2018 |
“Scientists have confirmed that enough solar energy falls on the surface of the earth every 40 minutes to meet 100 percent of the entire world’s energy needs for a full year. Tapping just a small portion of this solar energy could provide all of the electricity America uses...And enough wind power blows through the Midwest corridor every day to also meet 100 percent of US electricity demand.”
- Al Gore, Speech in Utica, New York, August 13, 2018 |
-
- Spatial density of the power produced and associated land-use and infrastructure requirements
- The timing and reliability issues with wind and solar being variable, "flow" resources
- Community opposition
- The high (yet dropping) up-front project cost of renewable energy
Remember that fossil fuels are remarkable stores of chemical energy, with a large amount of energy stored in chemical bonds by unit weight or volume. Not only are these fuels energy dense, but the energy bonds in fossil fuels are relatively stable over time. One can store and transport coal, oil, and natural gas over long distances without losing the quality of this energy. As a result, energy-dense fossil fuels (particularly petroleum) are ideal portable fuel supplies. The internal combustion engine was developed from this characteristic, on which entire transportation systems are based. Therefore, on economic and technical grounds, society has benefited from the characteristics of fossil fuels.
The forms in which renewable energy types are supplied are quite different. Most cannot be seen as energy stores but flows. Another way to think about this, is that they are variable, or intermittent. For the electric grid, variable sources cannot immediately replace the base-load, constant power that has traditionally come from nuclear, coal and gas power plants, but that is changing with the introduction of grid-batteries.
- In their flow state, solar and wind energy must be captured and converted to different forms to be useful, in real time. Solar is only available during the day and wind is even less predictable, so both must be stored for use when they are absent.
- Biomass (e.g., biofuels) are chemical stores of energy but with a much shorter shelf life compared to fossil fuels. They decompose relatively quickly, but are generally portable like gasoline.
- Hydroelectric is a flow energy, generated from converted solar energy that drives the water cycle, but it also has storage abilities, since water can be held behind a dam rather than being released.
- Tidal is a flow energy that comes from the combined gravitational pull of the moon and the sun.
- Wave energy is also a flow, and comes from the wind which is generated by the sun.
- Geothermal is a constant source of flow energy, coming from the slow decay of radioactive particles in the earth's core.
| Type | Storage | End-use form | Source | Availability |
| Photovoltaic Solar | Flow (if no battery) | Electricity | Sun | Variable, predictable |
| Thermal Solar | Flow | Heat | Sun | Variable, predictable |
| Wind | Flow | Electricity | Sun | Variable, unpredictable |
| Biomass | Store (couple of months) | Liquid fuel | Sun | Constant |
| Hydroelectric | Reservoir (Flow and Store) | Electricity | Sun | Constant (except for droughts) |
| Tidal | Flow | Electricity | Moon and Sun | 4 times a day |
| Wave | Flow | Electricity | Sun | Variable, predictable |
| Geothermal | Flow | Electricity and Heat | Earth | Constant |
The table above shows the varied storage forms of different types of renewable energy. You can also see that there are two different types of solar energy available. Photovoltaic solar energy relies on light photons to generate electric currents and thus produce electricity. Solar thermal systems generate energy through the direct heating of water or other fluids through sunlight. Systems that use thermal energy include residential hot water heating systems and passive architectural design features to produce heat in buildings.
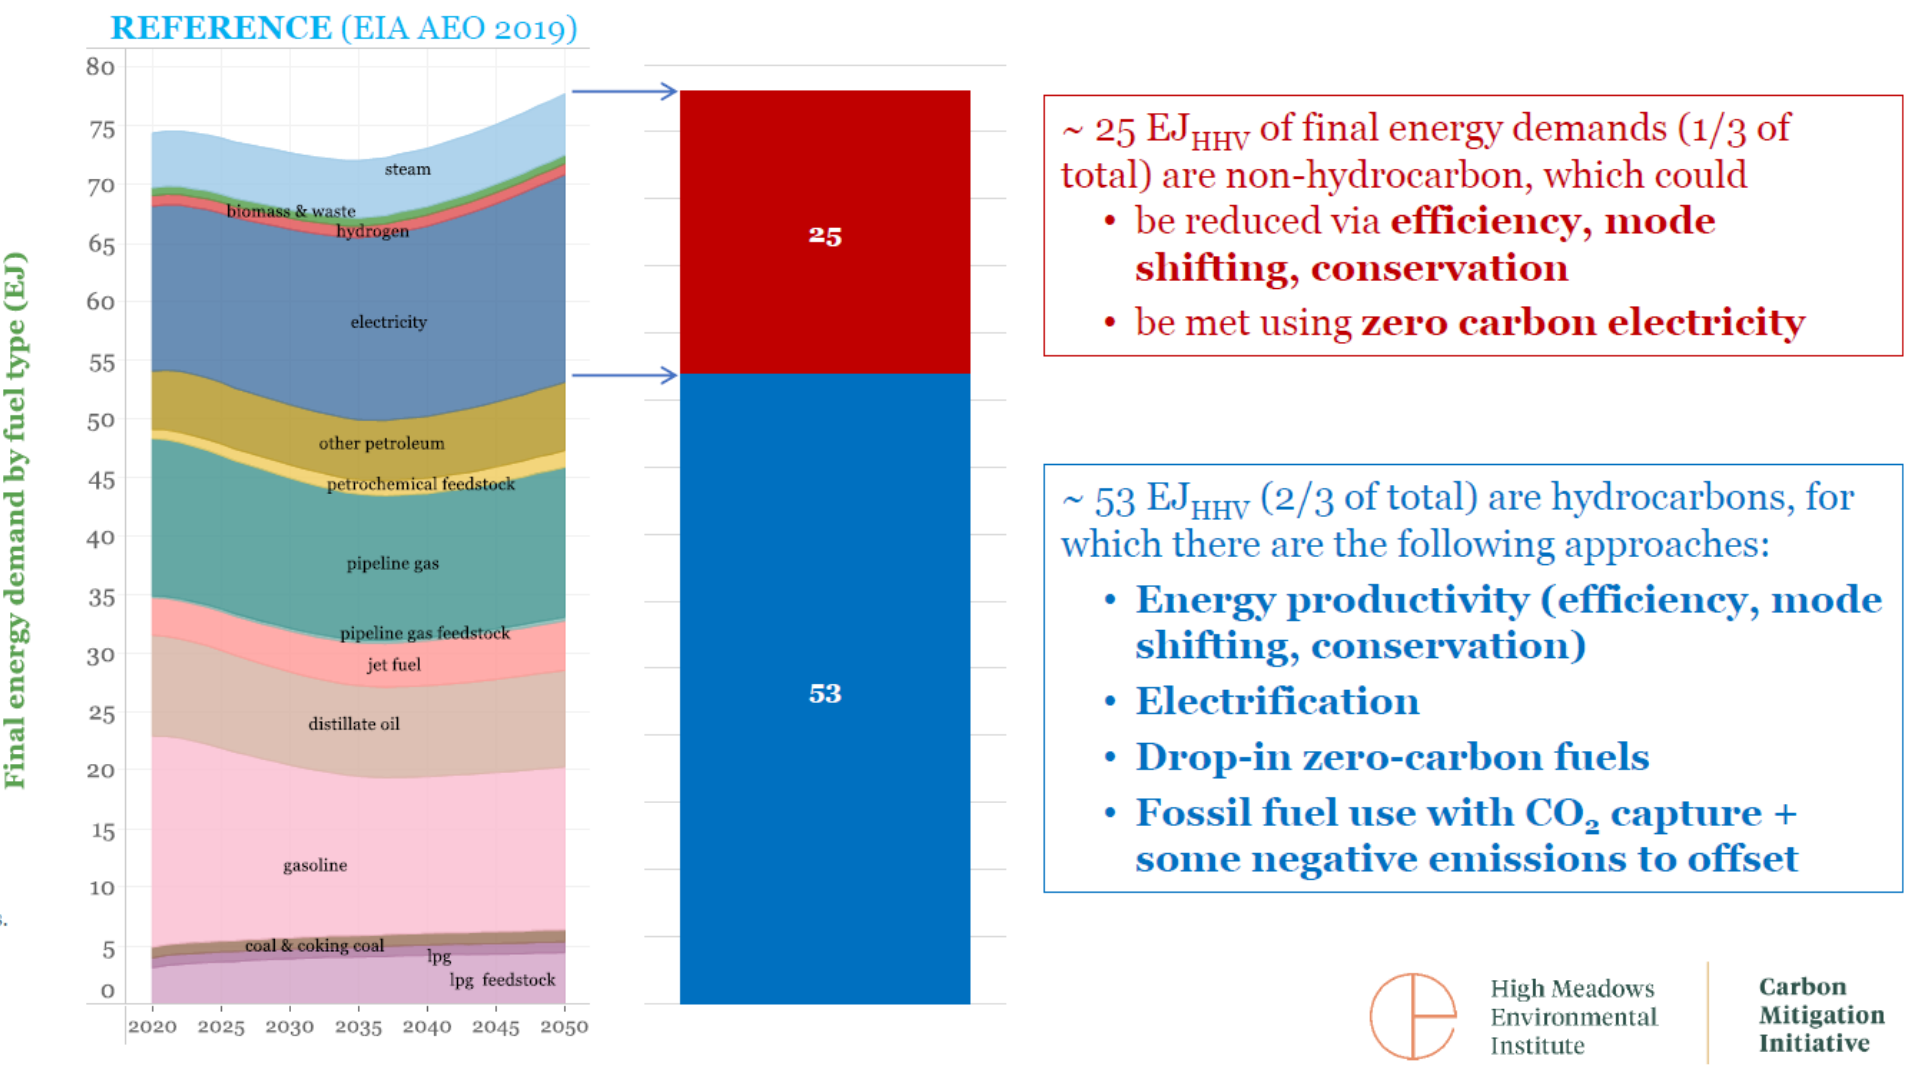
Now lets consider the magnitude of the transition. As the figure below shows, about 1/3 of current energy supplied to us as end users not as fossil fuels but as electricity or other chemical forms of energy (biofuels, waste heat, hydrogen). The major issue for addressing the needs of these end uses in a renewable energy transition is a combination of increasing energy efficiencies and increasing the renewable energy portion of our current electricity supply. The remaining 2/3 end uses are currently supplied by fossil fuels. To shift these end uses to renewables will require a combination of increased energy efficiencies, biofuels, and a shift to electricity as the final energy used (electrification) produced by renewable energy sources. The electrification of the transportation sector, which consumes approximately a third of our our energy supply, is a particular challenge given that it currently depends on fossil fuels for approximately 94% of its supply. There will be a need for a drastic increase in electric vehicles and those run on biofuels and hydrogen.
This lays out the scope of the needed transition to the renewable energy economy. A renewable energy transition faces significant but not insurmountable challenges. The U.S. is only developing nuclear very slowly and is not building large new hydropower plants, (in fact possibly losing large dams soon). Putting those two and biofuels to the side for now, lets look closely at wind and solar, the two renewable technologies thought to be most capable of decarbonizing our electricity supply. Our progress in developing solar and wind energy depends on us addressing four major challenges.
Challenge 1: Spatial density and land use requirements
Spatial density, also called "power density" refers to the rate of energy flow per unit land area. This concept is different, though related, to energy density from the beginning of the module. It specifically refers to the energy flow (measured in watts) that can be captured or produced per unit land area. Recall that fossil fuels have a high energy density, meaning that they store a high amount of energy in a given volume, mass, or area.
We can also think about energy consumption in this way — the amount of energy consumed per unit land area. For instance, a skyscraper will have a higher power consumptive density than a single-story house. Spatial density is a characteristic of energy supply that shapes our infrastructure and settlement patterns. In urban areas with high energy needs, a high density has been crucial to their very existence. In many ways, we can say that our cities are in part the outcome of the HIGH spatial densities provided by fossil fuels. Watts (W) are units of the rate of energy flow (power) and therefore spatial (power) density is the energy flow per unit land area (m2).
Reflect on the following questions as you look through the charts below:
- Can our cities be powered with only rooftop photovoltaics and wind turbines?
- If not, how can our cities be powered through renewable-produced electricity?
- What kinds of energy supply, storage and transport infrastructure would be required?
The first graph presents spatial densities of renewable and non-renewable energy production. Renewable energy spatial densities are much lower than fossil fuel facilities — renewable energy supply is more diffuse and requires much more land.
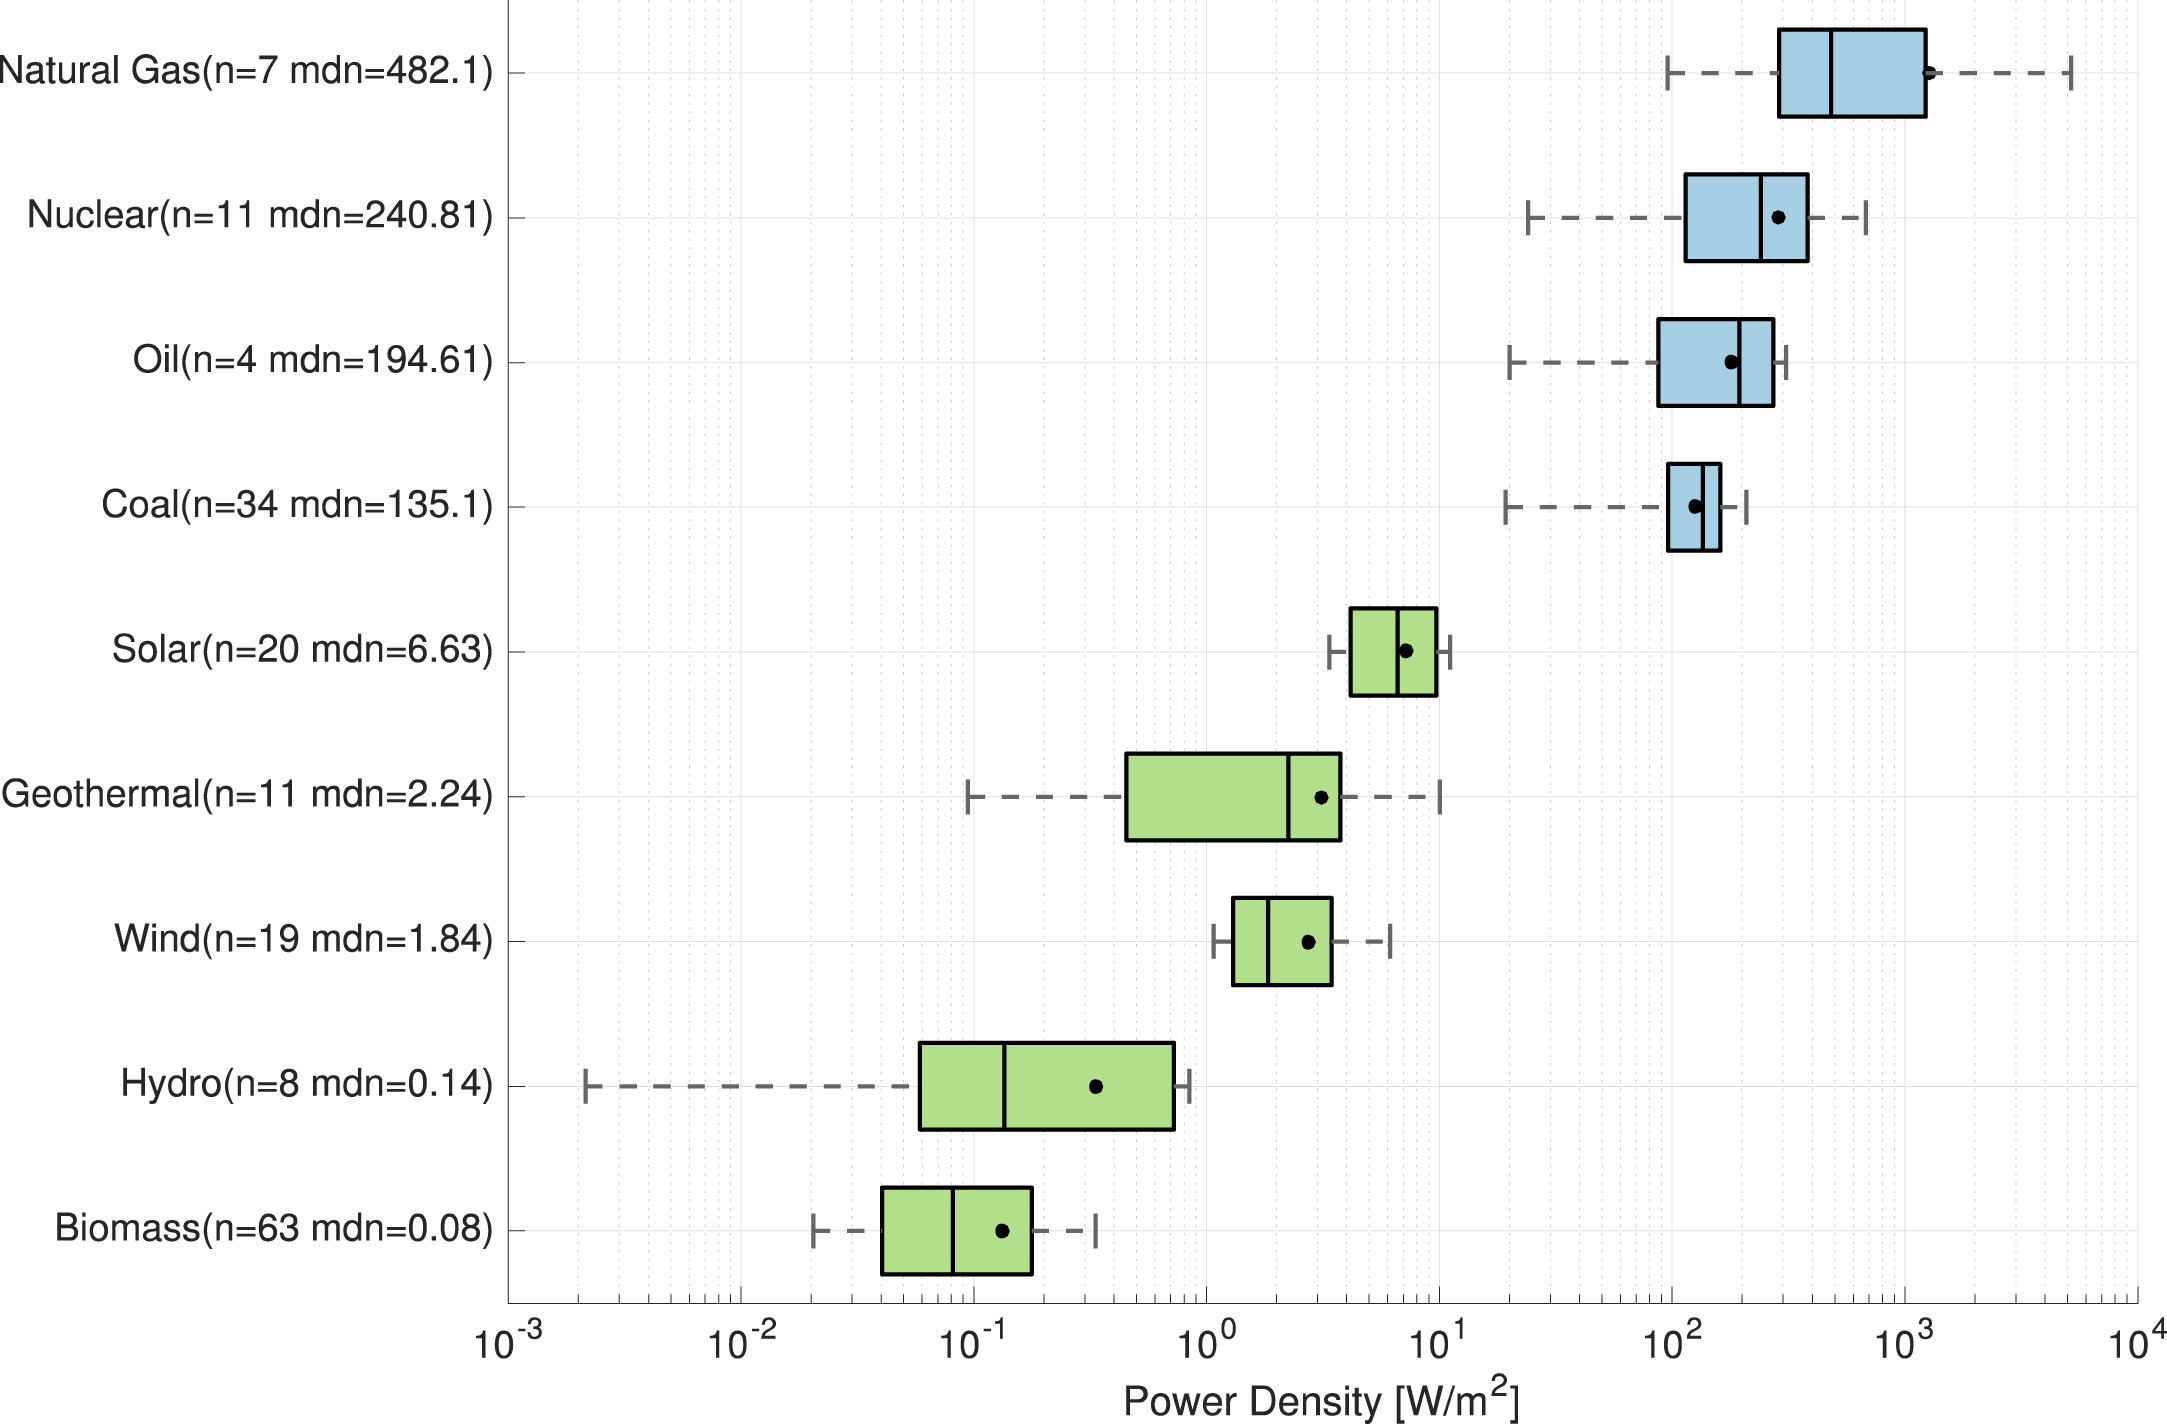
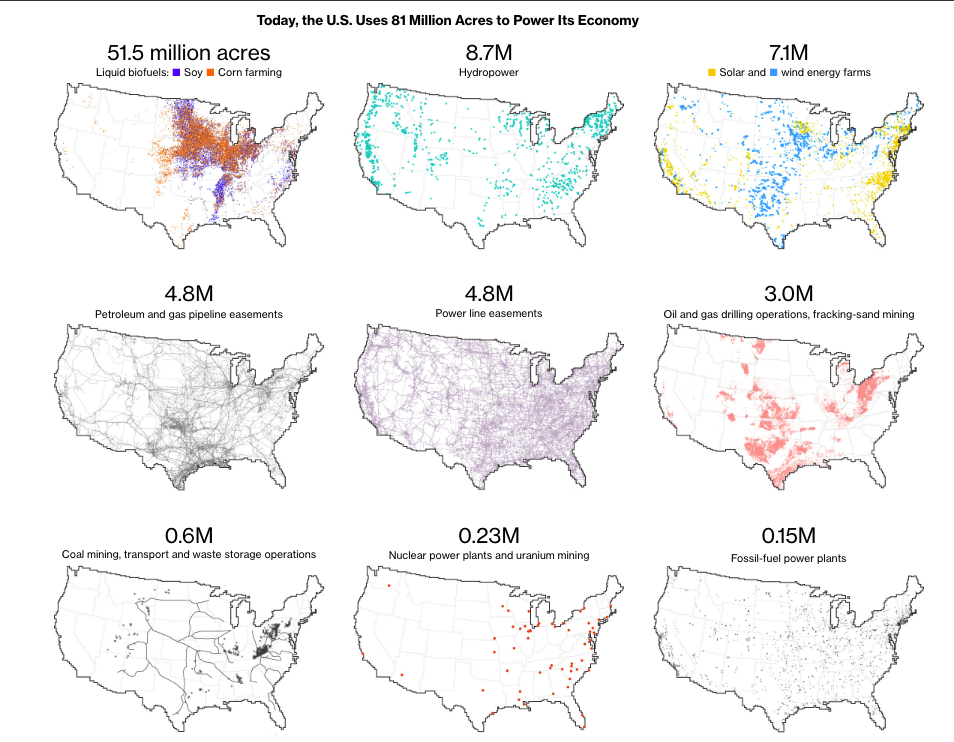
When combined, total land use for our energy production in the United States takes up approximately the size of Iowa and Missouri representing around 4% of surface area.
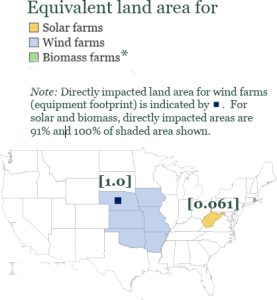
If fossil fuels are eliminated and our energy production transitions fully to renewable energy, there will need to be a major conversion of land uses in certain places due to the lower spatial density of renewable energy production. One of the most detailed studies to date is Princeton University's Net Zero America report. Based on this study's estimates, full electrification (no biofuels) and the elimination of fossil fuel use through the adoption of wind and solar will require an impacted area (view shed) of 1 million square kilometers for wind and 60,000 square kilometers of solar. This represents approximately 3.5 times the surface area currently used today for energy production, representing 14% of U.S. land surface. The map to the right depicts how this land need relates to the size of states. Please note that these are not actual locations of solar and wind -- just a representation of the land cover implications one scenario with a particular contribution of wind and solar. In another scenario, if solar were to supply a greater percentage of electricity supply, then the land requirements are likely less due to the high spatial (power) densities of solar compared to wind (see figure above). Still, it is important to consider these estimates because they provide a good sense of the land requirements associated with any renewable energy transition.
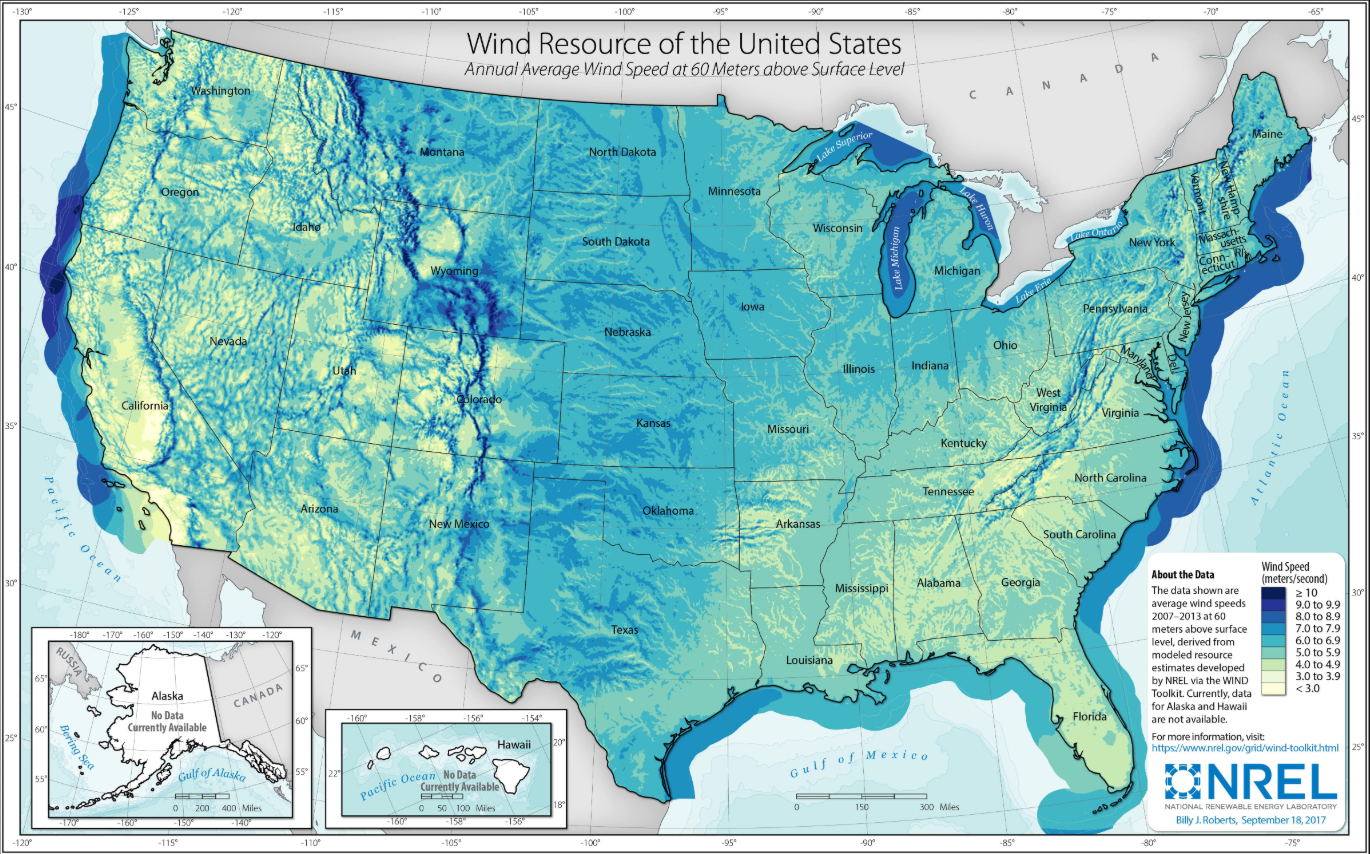
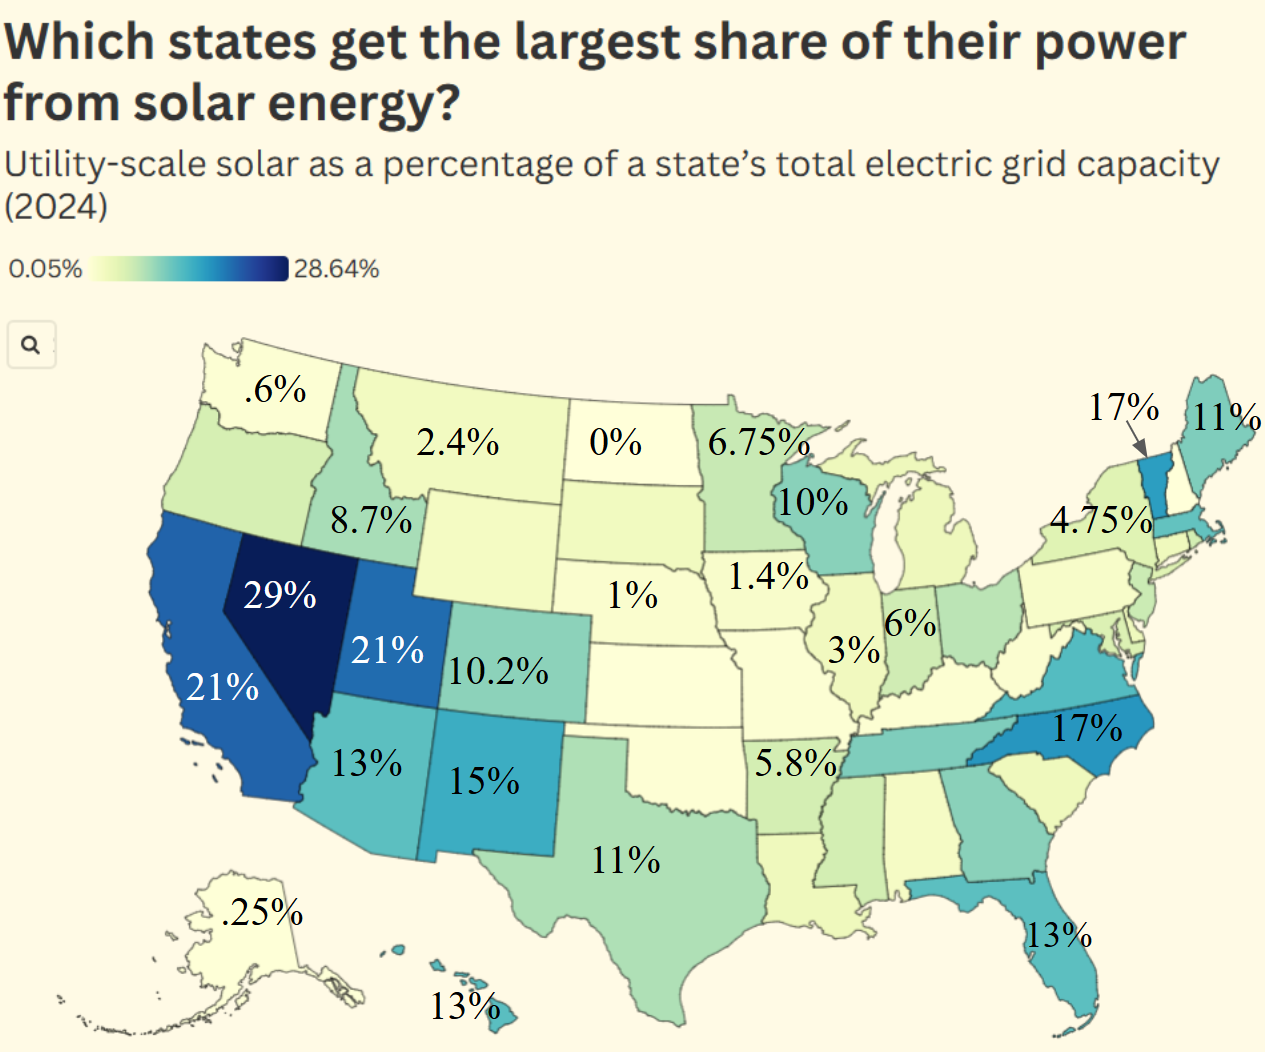
An additional factor affecting future areas of energy production and consumption is how climate affects the energy production potential of wind and solar. The map below shows a map of levels of solar irradiance in the U.S. The productive potential and the economic potential is much higher in the American Southwest. Therefore, if our electric grid system was sufficient, one would expect the southwest to be a net supplier of solar-produced electricity.

Electrons and the Grid

Simply put, electricity is a flow of electrons within a conducting material. While electrons have unique characteristics, the flow of water is a commonly used analogy of electricity. Various measures of electricity such as amps (water flow), volts (water pressure) and resistance or ohms (water moving through a constrictions) or capacitance as a measure of energy storage (water in a tank or reservoir) can be expressed through water analogies. Transmission lines are made of conductors that allow electron flow. Transmission lines are interconnected across regions. These interconnected networks are referred to as the “grid”. Electricity produced within the grid creates a pressure differential (voltage) that results in current flows through the path with the least resistance with some current flowing through every path within the network. Electrons flowing through the grid are interchangeable and untraceable, similar to how one drop of water is the same as any other drop. The analogy with water is complicated by the fact that the grid operates on alternating current (AC) and requires a stable frequency of 60Hz (hertz, or cycles per second). This frequency and inertia is directly tied to the spinning turbines in power plants. Any deviation can lead to shutdowns or blackouts. For all these reasons, and because society relies on it in numerous ways, the grid is monitored and operated in real time, 24/7, with workers in control rooms constantly ensuring that supply and demand are perfectly matched and that safety controls remain stable.
With a renewable energy transition, there will be many more sites of electricity production requiring an expansion of and greater interconnectedness (denser web) of the grid. This will increase challenges of regional coordination and governance across the grid. Our current “grid” is actually composed of a number of “regional” grids. Greater inter-regional connections across these grids will help match variable renewable production of electricity with variable demand -- a challenge that will be described in the section below.
Challenge 2: Timing and reliability
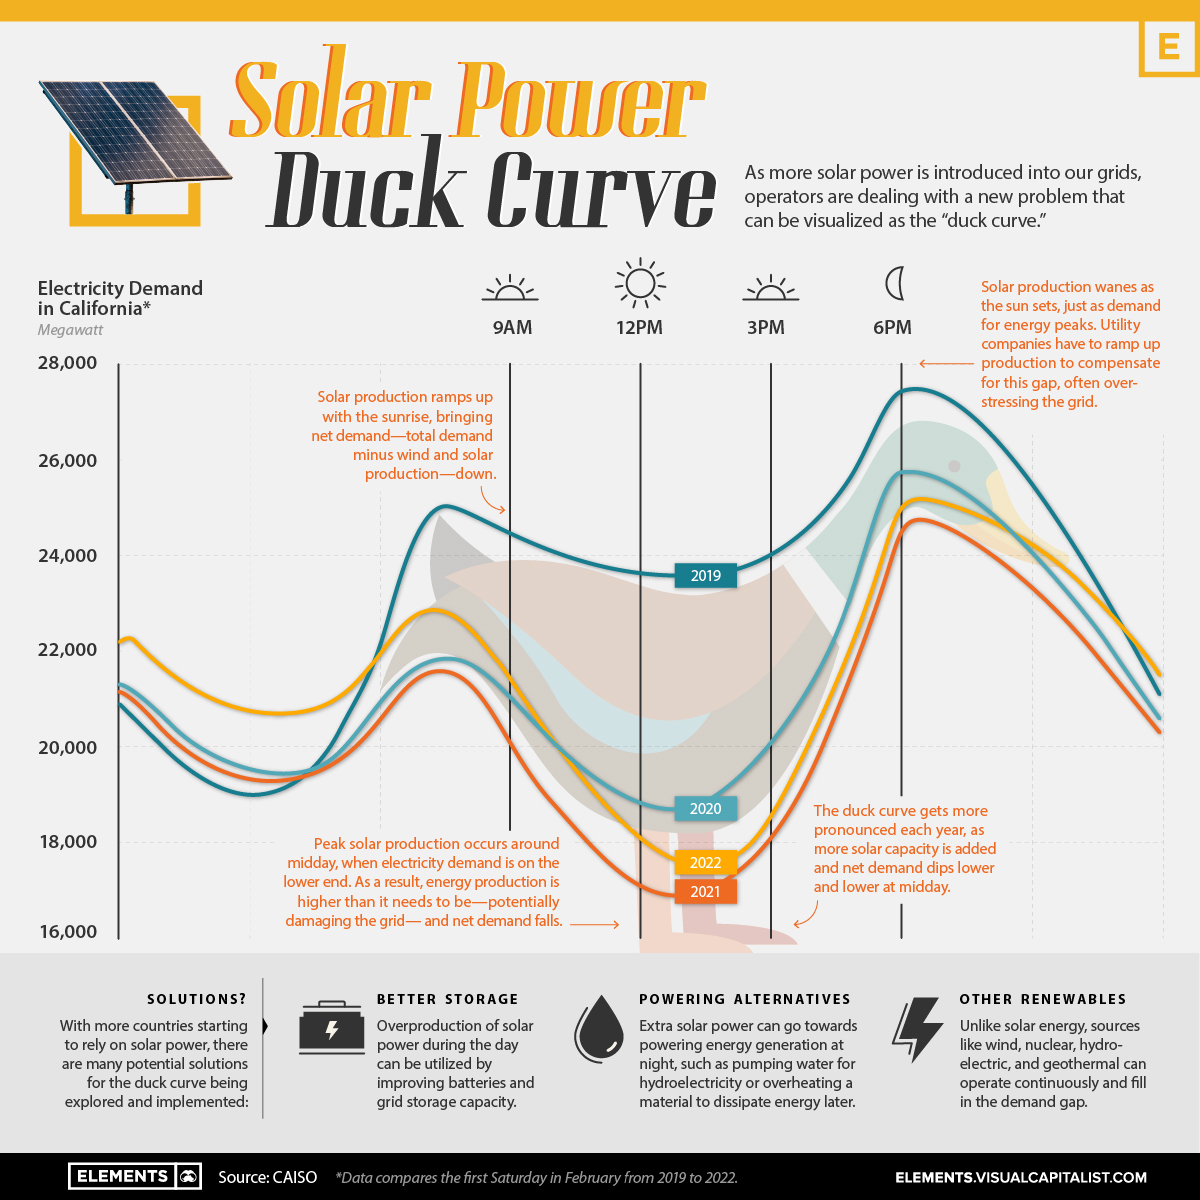
Another challenge facing a renewable energy transition is timing -- matching the availability of electricity supply to when we need it (demand). As variable, flow resources, wind and solar generated electricity varies by the level of sunshine and wind. Solar panels are most productive in the middle of the day and drop off rapidly and predictably as the sun goes down. Wind turbines are only productive when it’s windy, which is more likely in the day but far less predictable than the solar panel output. Solar stops producing energy right when people are coming home from work and turning on the stove, the lights and the TV. That time of day is when “peak demand” occurs. Another, smaller peak occurs reliably in the morning as people are preparing for the day.
The “duck curve” refers the shape of electricity demand not met by solar and wind supply across the day. It illustrates the challenge of balancing electricity supply and demand when renewable energy sources, especially solar, are a significant part of the energy mix. The duck curve varies by location and season. Despite this variation, as solar-produced electricity becomes a larger share in many parts of the grid, grid operators will have to address the more pronounced peaks in the morning and early evening.


California produced all of its electricity demand with renewables for the first time at 3:00 pm on April 30th, 2022. It was only for a few minutes but it made history, as California is the 5th largest economy in the world. Notice how this was achieved by significant amounts of solar and wind energy.
The duck curve is a challenge but a well-designed transition can overcome it. One of the main ways is through grid-scale batteries that will store energy during mid-day that can be drawn on during the early morning and evening hours. California is showing how they can lead the way to a solar-centric economy.
Today, California has over 10,000 megawatts of battery capacity, making it the largest supply outside of China. Over the weekend of July 28 2024, California marked the 100th nonconsecutive day within a 144-day stretch in which 100% of electricity came from renewable sources for periods ranging from five minutes to more than 10 hours. This chart compares April 2021 and 2024. Look at the dark orange sections in 2024 that are the part of the morning and evening peak demand met by batteries.
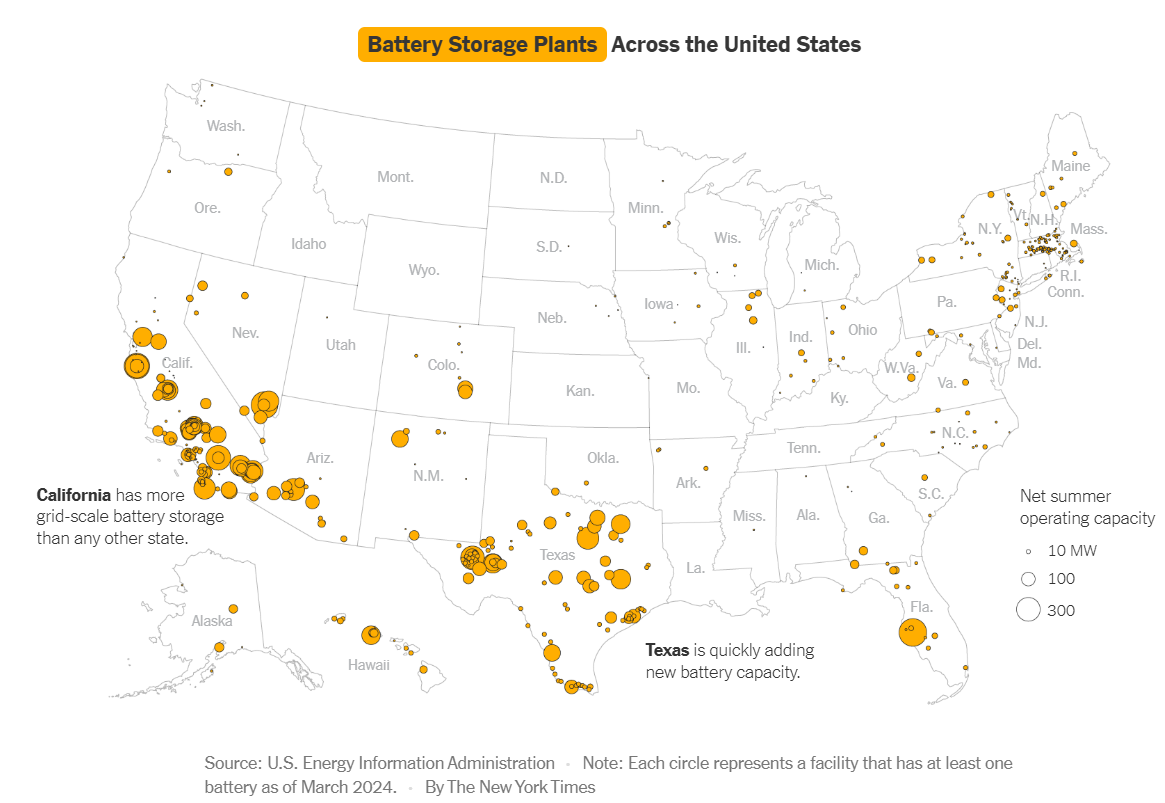
This map shows that Texas and California are by far leading the way in grid-battery installations. There’s a long way to go for other states to catch up. In California, these changes were spurred by strong political mandates and in Texas, it was mostly driven by market forces. Battery operators are paid for the valuable "ancillary services" they offer to the grid, which include evening out the duck curve and preventing harmful impacts from heatwaves, wildfires and blackouts.
Challenge 3: Community resistance
A key factor that has slowed down and sometimes canceled renewable energy projects in the U.S. has been community opposition. People often mischaracterize this resistance, by calling it NIMBYism (Not In My BackYard) because it does seem absurd that anyone would be against clean energy when we need it to address climate change. It’s important to take a step back and look closely at the details of each case, before making assumptions. There are a number of different reasons why opposition may have formed, and it takes shape in different ways.
The concerns voiced by opposition to renewables are varied. Fossil-fuel funded groups support ordinances banning renewables, and other times, broad-based grassroots movements pass bans or advocate new siting standards. Some concerns are about cost while others are about the renewable infrastructure and impacts on landscapes, grids and local economies. A few of the most common reasons for opposition include:
- Costs from projects increasing electricity prices
- Potential environmental impacts during project construction and operation, including harm to animals, plants, ecosystems, streams, aquifers etc.
- Personal or community land (property) value reductions and economic and tourism reductions associated with wind/solar farms and transmission lines
- Large scale land-use incompatibility, primarily with farming activities and environmental conservation efforts
- Health and safety, emotional and quality-of-life concerns, including about lights, sounds and physical impacts like runoff, catastrophic breakdowns, impacts from weather or attacks. Emotional impacts include aesthetic, sense-of-place disturbance
- Process concerns about approval, decision-making, democratic participation and governance of projects once operating
- Preferences for different kinds of energy systems, e.g. decentralized, small-scale, community-owned, government-owned etc.
- Existing indigenous sovereignty claims, and claims from other cultural groups
- Concerns about unfair distribution of project benefits, and investor profits
There are many creative innovations to address these concerns (see text box on agrivoltaics below), but some remain only at an experimental stage and will require government support to expand their economic and technological viability.
 Agrivoltaics
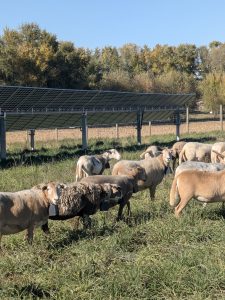
One approach that is providing solutions to the land-use conflict between agriculture, native ecosystem restoration and renewable energy is agrivoltaics. Agrivoltaics combines agriculture and/or native pollinator and mixed habitats with solar farms. UW-Madison partnered with the utility company Alliant to build an experimental facility, the Kegonsa Research Campus Solar and Agricultural Research Pilot Project in Stoughton. A number of different kinds of researchers are engaging with the project to measure its impacts and the wider potential for commercial, mixed-use agrivoltaics. The project is split into sections to test different arrangements. This picture shows sheep grazing at Madison Gas & Electric’s Tyto Solar Facility in Fitchburg.
Challenge 4: Cost
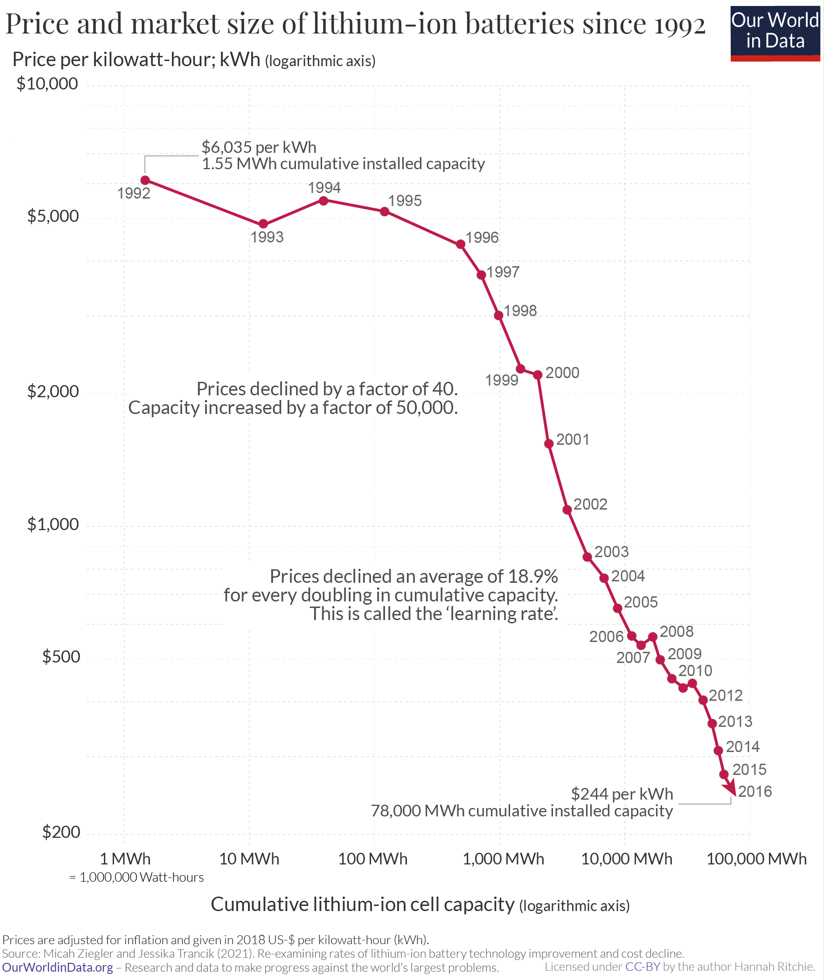
Another challenge facing the transition from fossil fuels to renewables has been price. However, the economics have changed rapidly over the past 10 years. Expert predictions about the evolution of the cost of wind, solar and batteries have almost all been proven wrong by a large measure. According to Fatih Birol, the Executive Director of the International Energy Agency, “renewables today offer the cheapest option to add new power plants in almost all countries around the world.” This makes sense when we see that renewables made up 91% of all new generation capacity on the U.S. grid in the first 5 months of 2025. The graph below shows the changes in the average levelized cost of electricity ($ per megawatt-hour) produced by different sources from 2010-2019. During this period the solar and wind power capacity (on X axis) increased significantly.
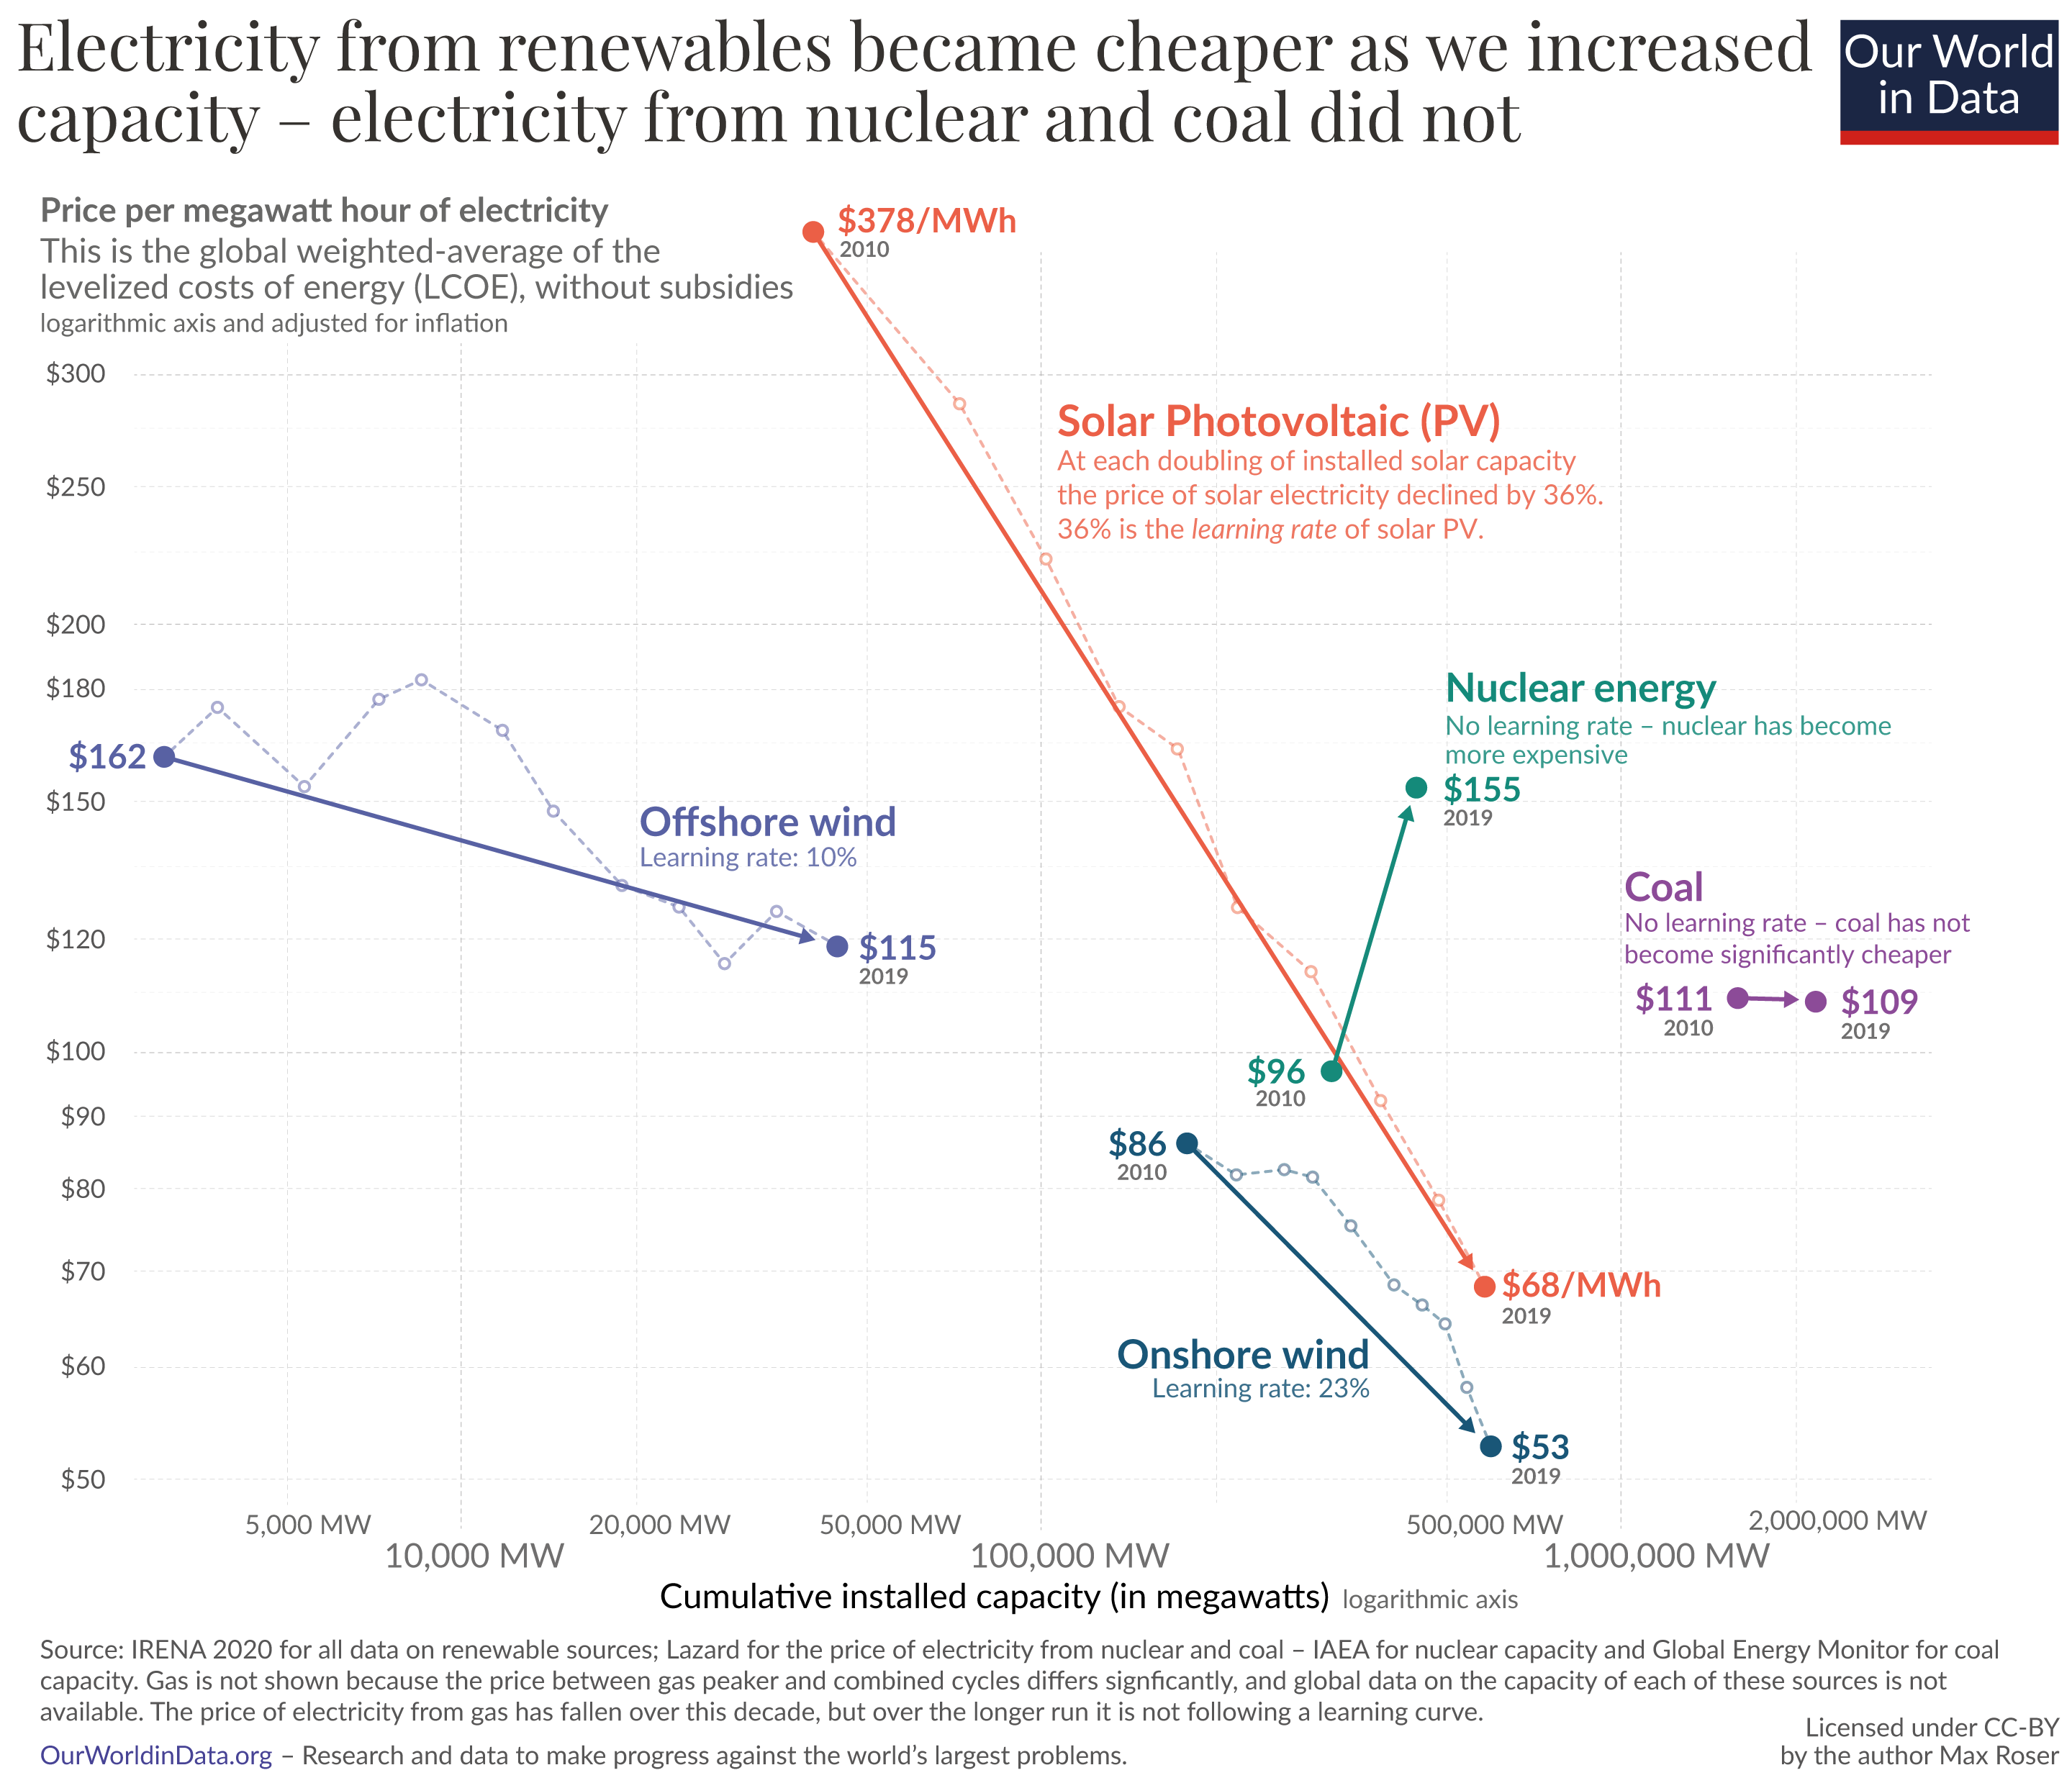 As the graph above shows, the global price of electricity from new coal declined by merely 2%, while solar got 89% cheaper and wind 70%. This reflects the fact that solar and wind are on a steep learning curve spurred by technological innovation, experimentation, and growing economies of scale. For both technologies, government-funded research and development was a critical initiator of the phase of innovation and rapidly declining prices. You might notice on that nuclear prices have increased. This is because of rising costs of labor and regulatory compliance and small, uncompetitive supply chains for nuclear reactor equipment.
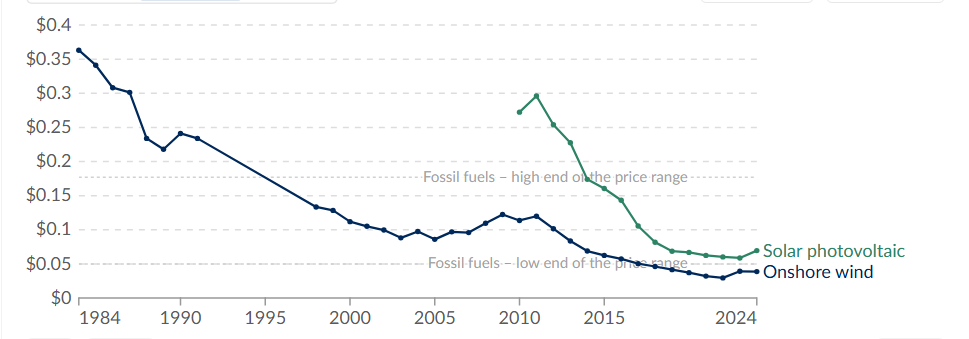
These global price trends are also seen in the U.S. The graph below shows the levelized cost of wind and solar from 1984-2024 (expressed as $ per Kilowatt-hour). Please note the steeper price drop for solar photovoltaic since 2010. Both solar and wind are now estimated to produce electricity for prices comparable to the cheapest power plants fueled by fossil fuels. Today, natural gas is the only major competitor with solar and wind for investments into new electricity generation investments. Gas now constitutes 43% of the country’s total generating capacity, and it could grow to a higher share, unless it is outcompeted by renewables. Surging global demand for gas-fired turbines has led to a congested supply chain, higher prices and a wait list of up to 8 years in the U.S. There is a huge amount of planned natural gas plants, but uncertainty about how soon they will actually get built.
Falling unit-prices for renewable energy and storage capacity are positive signs for a renewable energy transition. Government support for renewables has ebbed and flowed but the basic economics remain favorable for renewables compared to fossil fuels at least for electricity generation. Still, a fuller electrification of our economy which a renewable energy future would require faces considerable infrastructure and economic challenges -- most particularly the electrification of our transportation sector which currently is heavily fossil-fueled. Compared to fossil-fueled power generation, solar and wind generation, whether controlled by homeowners or utilities have high up-front capital costs but lower operating costs compared to fossil fueled electricity generation. These upfront costs, interest rates, delays in gaining government approval for construction (due in part to opposition), and uncertainty about government support for necessary transmission lines still make cost an important challenge to a renewable transition.
This means that action on the part of governments and corporations is absolutely critical. Investments in renewables need to be de-risked, by large entities making large, long-term commitments and by governments providing direct financial incentives to homeowners. Leaving decarbonization in the hands of individual consumers and profit-oriented investors risks the country falling far short on the installations needed to keep within the net-zero deadlines recommended by climate scientists. Many creative policy changes and finance strategies have been suggested for de-risking investment in and direct funding for renewables. According to Bloomberg NEF, global investment in new renewable energy projects hit a record $386 billion in the first half of 2025, up 10% from the previous year. However, asset finance for utility-scale solar and onshore wind shrank by 13% compared to the first half of 2024. Many political leaders have called for strong government intervention to ensure that financing continues steadily instead of slowing down, giving confidence to powerful private investors that renewable energy as opposed to natural gas, will power the economy of the future.
Progress continues
Renewable energy is appealing for more reasons than were included in this chapter. Not only does renewable energy not contribute to GHG emissions, the focus here, but also its environmental costs are less than the other environmental costs of fossil fuel combustion (air and water pollution). Difficult tradeoffs were a part of setting up the fossil fuel economy, but most people alive today don't remember dealing with them. We have just normalized them and live with their significant health, political and environmental costs. The complicated choices we make now, about what types of infrastructure to invest in, will shape the direction of communities, the economy and the environment for decades to come. We need to make these choices by not following dogma but with a clear understanding of the positives and negatives of a transition in our energy economy.
COMPLETION.
YOU ARE FINISHED!
- The Tennessee Valley Authority opened the Watts Bar 2 Reactor in 2016. Since then, only two new reactors have opened, Georgia Power's Vogtle Reactor 3 (2023) and Reactor 4 (2024). A new reactor is under construction in Wyoming, and a first-of-its-kind re-starting of a nuclear reactor is being planned for Michigan's Palisades plant, which had been shuttered in 2022. ↵
A Btu (British thermal unit) is a unit of heat energy, defined as how much heat it takes to raise one pound of water by one degree F. A quadrillion Btus is commonly referred to as a “quad.”
greenhouse gas
An estimate of the average cost to build and operate an electricity supply infrastructure over its lifetime, divided by the total energy it produces