
Geography/Environmental Studies 339
Voluntary Emission Reductions: Paris and Beyond
Learning Objectives
By the end of this chapter, you should be able to explain:
- The basic goals and architecture of the Paris Agreement
- Challenges facing a voluntary international agreement like the Paris Agreement
- The effectiveness of the Paris Agreement to date
- The nature of voluntary “Net Zero” commitments to reduce greenhouse gas (GHG) emissions made by cities, companies, and utilities
- The effectiveness of these voluntary commitments
- Some of the concerns about their targets, accuracy and accounting mechanisms
The Kyoto Protocol, premised on relatively uniform GHG emission reduction responsibilities among Annex 1 (wealthy) countries, was eventually replaced with the Paris Agreement — a different kind of international agreement. It is important to note that there was never a clear mechanism in the Kyoto Protocol to enforce compliance on sovereign nations. Compliance could only be ensured through peer-pressure from other nations. The Paris Agreement, further increased the voluntary nature of emission reduction efforts by allowing signatory countries to set their own reduction targets. This is why the agreement is often described as a voluntary reduction agreement. The voluntary nature of the Paris Agreement is mirrored in the pledges of nonstate actors such as cities, companies, and utilities. We will review those reduction pledges following our learning about the Paris Agreement.
The Paris Agreement
After the COP17 (Conference of Parties) in Durban, three additional COPs (18-20) were held between 2012-2014, each focusing on developing a new agreement to replace the Kyoto Protocol. The focus was to get all countries to assume some responsibility to reduce at least their projected GHG emissions. Two political changes that were important leading up to the Paris Agreement included:
- Growing strains in the Developing World Alliance between rapidly-growing middle-income countries emitting relatively large amounts of greenhouse gases (e.g., China, India, South Korea, Brazil, Mexico) and the poorest countries experiencing many of the impacts of climate change (Island Nations, African countries, Bangladesh, etc.).
- Tentative bilateral agreements between the world’s largest emitters to move forward with commitments to reduce – particularly between China and the United States
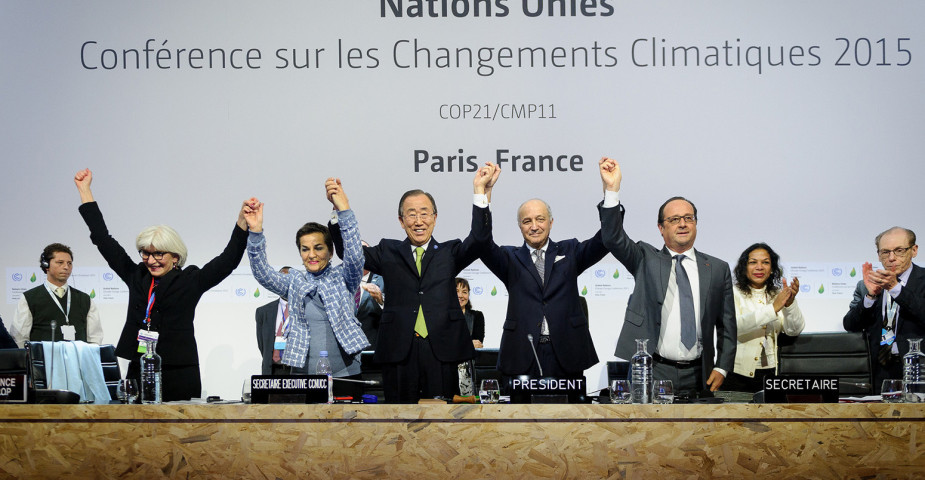
The Paris Agreement was designed and agreed upon at COP21 in Paris in 2015 by nearly every nation. It is a climate change mitigation treaty designed to be the successor to the Kyoto Protocol. In order for the Agreement to formally come into force, at least 55 countries accounting in total for at least 55% of global greenhouse gas emissions had to ratify the treaty. This occurred in Oct of 2016 when 74 countries–including the US, the EU, India, and China–ratified the deal. The Agreement then formally came into force on November 4, 2016.
The broad goals of the Agreement are:
- to keep global average temperature rise well below 2 degrees Celsius above pre-Industrial levels while pursuing efforts to limit the temperature rise to 1.5 degrees Celsius;
- to provide a transparent framework for countries to set, monitor, verify, and publicly report on their emissions-reduction targets; and
- to strengthen developing countries’ ability to mitigate and adapt to climate change impacts by setting up a fund through which developed countries can channel money to developing countries for climate change mitigation and adaptation purposes.
As of late 2024, 195 countries have signed the Agreement and 195 Parties (of 198 the Parties to the UNFCCC have ratified it. This represents more than 97% of global emissions. Compared to Kyoto, this is a remarkable achievement given that countries who together emit 97% of GHG emissions have obligated themselves take steps to reduce these emissions.
Climate Finance for Developing Countries in the Paris Agreement
The third major goal of the Paris Agreement stems from the recognition justice implications of climate change in which th![]() e costs of climate change are unevenly distributed with most of the costs borne by those who have not benefited from historic GHG emissions (explored in the Climate Justice chapter). In Article 9, the Paris Agreement stipulates that developed country Parties must provide financial resources to the Green Climate Fund (GCF), a fund established in 2011 by Parties to the UNFCCC, to help developing countries, especially the least developed countries and island nations, to both mitigate and adapt to climate change. Specifically, the Agreement requires developed countries to biennially provide transparent information on what kind and how much funding they are pledging to developing countries at the present time and in the future. The Paris Agreement urges developed countries to increase their level of financial support to achieve the goal of jointly providing $100 billion annually to developing countries by 2020 for mitigation and adaptation. Pledges and actual funding have fallen well short of this goal (less than 3%). For those of you interested, you can see the status of countries’ pledges to the Green Climate Fund by following this link to the Natural Resources Defense Council.
e costs of climate change are unevenly distributed with most of the costs borne by those who have not benefited from historic GHG emissions (explored in the Climate Justice chapter). In Article 9, the Paris Agreement stipulates that developed country Parties must provide financial resources to the Green Climate Fund (GCF), a fund established in 2011 by Parties to the UNFCCC, to help developing countries, especially the least developed countries and island nations, to both mitigate and adapt to climate change. Specifically, the Agreement requires developed countries to biennially provide transparent information on what kind and how much funding they are pledging to developing countries at the present time and in the future. The Paris Agreement urges developed countries to increase their level of financial support to achieve the goal of jointly providing $100 billion annually to developing countries by 2020 for mitigation and adaptation. Pledges and actual funding have fallen well short of this goal (less than 3%). For those of you interested, you can see the status of countries’ pledges to the Green Climate Fund by following this link to the Natural Resources Defense Council.
How Does the Agreement Aim to Achieve These Goals?
Ratifying countries are legally required to set, monitor, verify, and publicly report on their on their target reduction commitments, called nationally determined contributions (NDCs) every five years. Given that initial commitments were insufficient to reach the goal of limiting GHG emissions so that average global temperature rise are kept at or below 1.5 degrees Celsius, it was determined that ratifiers of the agreement should revisit their commitments every five years with the expectations that NDCs will be made more ambitious over time. There are no legal requirements regarding how or by how much countries must reduce their emissions, and there are no financial penalties for not meeting their NDCs. Rather, the Agreement relies more on the enhanced transparency of the framework to foster a sense of global peer pressure and to make it easier to track which countries are setting and meeting ambitious goals, and which are not. One result of this voluntary approach, however, is that countries’ NDCs vary greatly both in scope and ambition.
With respect to mitigation, these commitments are highly varied and are normally stated as a reduction target:
- Commitments to reduce aggregate greenhouse gas emissions.
- Commitments to reduce the emissions intensity (emissions emissions intensity of its economy (GHG emissions per unit of GDP)
These commitments are seen to be met by achieving a certain percentage relative to a specified baseline, such as:
- The value of the target (aggregate emissions or emissions intensity) in year X.
- The projected value of the target by achievement year based on a “business as usual” (BAU) scenario.
to be achieved by a certain year or range of years… with certain conditionalities (normally funding from industrialized countries)
This variation reflects the GHG accounting politics leading up to the Kyoto Protocol. Developing countries, ranging from poor countries (e.g. Bangladesh and Niger) to rapidly growing middle income countries (e.g. India and China) were hesitant to make commitments to cut aggregate emissions worried that such commitments may limit their economic growth as their populations increased. They thus tended to instead commit to a reduced rate of GHGs emitted per unit of economic growth (increase in GDP), often referred to as “emissions intensity” or “carbon intensity.” These countries still argue that their much lower historic and per capita emissions means that there is strong ethical grounds for them to adopt such emissions intensity targets.
To give a more grounded understanding of the variation in NDCs and progress towards achieving them, follow these links to obtain country-specific information from the ClimateWatch website: China, India, United States, and the European Union. Consult each of these pages by first scrolling down and to look at the historic emissions graph for each of two metrics (Total, per GDP). Then scroll down two panels to read the summary of the country’s NDC. After you read about each country, answer the question related to its NDC.
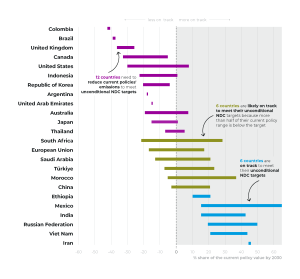
The progress of these three countries and the European Union toward their NDC targets is mixed. They reflect an overall global pattern of NDCs of variable ambition and mixed progress in reaching them among ratifying countries. This chart compares emissions projections under current national policies with NDC targets in 2030 for countries. The width of the bars represents the range of future projects under different assumptions. The policies undertaken by countries with purple bars have policies that are insufficient to reach targets while those with blue bars have policies that are likely to result in reaching NDC targets (countries with green bars are intermediate). Please look for China, India, United States, and the European Union in the chart to confirm your assessments of their progress above matches the projections in the chart.
The progress of the United States toward its NDC has been hampered by the mixed support of its government to abide by the Paris Agreement. Soon after it coming into force in October 2016, the presidential election in November led to a new administration hostile to it, announcing its attention to withdraw within its first year.
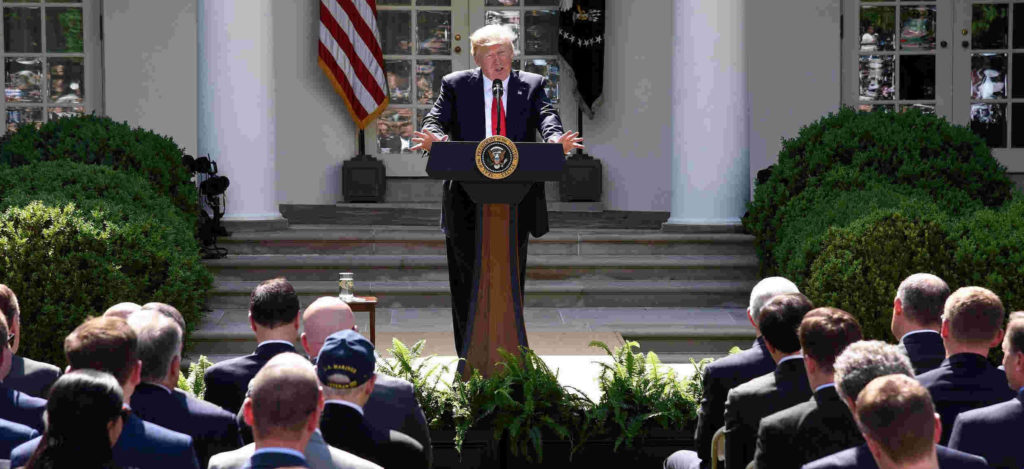
On June 1, 2017, U.S. President Trump announced his intention to withdraw from the Paris Climate Accord:
“As president, I can put no other consideration before the well being of American citizens. The Paris climate accord is simply the latest example of Washington entering into an agreement that disadvantages the United State to the exclusive benefit of other countries, leaving American workers – who I love – and taxpayers to absorb the cost in terms of lost jobs, lower wages, shuttered factories, and vastly diminished economic production
For example, under the agreement, China will be able to increase these emissions by a staggering number of years – 13. They can do whatever they want for 13 years. Not us. India makes its participation contingent on receiving billions and billions and billions of dollars in foreign aid from developed countries. There are many other examples. But the bottom line is that the Paris accord is very unfair, at the highest level, to the United States.”
— Statement by President Trump on the Paris Climate Accord. The White House. Office of the Press Secretary. Rose Garden. June 01, 2017.
The withdrawal request followed by a mandatory waiting period of three years resulting in the U.S.’s exit from the Paris Agreement taking effect on Nov. 4, 2020, one day after President Trump lost his re-election bid. Only hours after taking the oath of office, President Joe Biden announced the U.S. would rejoin the Paris Agreement, and this took effect 30 days later (on 2/19/21). Since returning to the Whitehouse in 2025, Donald Trump announced his attention to withdraw once again. The back-and-forth posture of the United States along with shifts in federal support for climate mitigation has created real challenges for the second largest producer of GHG emissions to significantly reduce its emissions. The lack of seriousness of the United States has created a broader challenge to the Paris Agreement which, as a voluntary program, can only be effective through demonstrable actions taken by the largest producers.
Overall Effectiveness of Paris Agreement
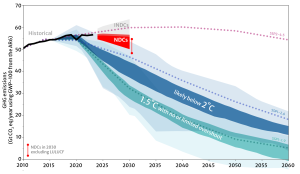
The stated overall goal of the Paris Agreement is to keep global temperature increases well below 2 degrees Celsius and closer to 1.5 degrees Celsius. A number of commentators have made the point that even if these voluntary emission reductions were met within the stated time frames, global temperature increases would likely exceed 2 degrees Celsius. Modeling studies, such as that done for IPCC’s Sixth Assessment Report, show that GHG emissions that would result in a 1.5 degrees Celsius (darker green area) and 2 degrees Celsius (darker blue area) fall well below the NDC reductions (red wedge) in 2030. These NDCs, while resulting in greater reductions than initial commitments (INDCs), are insufficient to address overall goal #1 (see above) of the Paris Agreement.
In sum, the Paris Agreement has led to progress in reducing GHG emissions and improving the adaptive capacities of the most vulnerable countries. This progress has been grossly insufficient to meet its first and third goals of keeping global warming “well below 2 degrees Celsius above pre-Industrial levels while pursuing efforts to limit the temperature rise to 1.5 degrees Celsius; and providing adequate financial support to the most climate vulnerable countries in the world.
Voluntary Commitments Made by Non-State Actors
Up to now we have studied international climate agreements tied to a common set of GHG reductions for ratifiers (Kyoto Protocol) or varied voluntary commitments by ratifiers (Paris Agreement). While the Paris Agreement remains active, commitments and progress toward meeting these commitments have fallen short. The United States, the second largest emitter of GHG has exited the Paris Agreement twice, which has not only slowed emission reductions in the U.S. but has shaken the resolve of parties to the Agreement. In the first few months of Donald Trump’s second term (2025), federal support for climate change mitigation was largely rolled back. The U.S. officially served notice of its intention to withdraw from the Paris Agreement, for a second time, on January 20th, 2025.
Federally supported wind farms were halted at the proposal and construction stages; much of Biden’s Inflation Reduction Act (IRA), which provided significant funding for renewable energy development was dissolved and any un-allocated funds frozen; and a new leasing plan for oil/gas wells and federal support for coal energy were announced.
Are voluntary commitments to reduce GHG emissions the only option? To meet their NDCs, national governments can create policies and make investments but they have always been dependent on reductions by local governments (e.g. cities, counties, states), individuals, and private companies. If the federal government is not actively pursuing GHG reductions, could these other actors make their own voluntary commitments and move to achieve them? The short answer is yes. Cities, companies and utilities around the world have pledged to reduce GHG emissions. Similar to Paris Agreement NDCs, these pledges take different forms with significant variation among pledging institutions to achieve or move toward their stated goals. Given the lack of federal commitment, and emissions responsibility, no where else in the world are such pledges as important than in the United States. This section describes:
- Voluntary commitments to reduce GHG emissions made by the largest cities, corporations and utilities in the U.S.
- What their commitments represent in terms of overall potential national GHG emissions reductions
- The progress made to reach these commitments so far
- Some of the concerns around the specific targets being set and accounting mechanisms
What does “Net Zero” mean?
Net Zero means a balance between the amount of GHG gases emitted into the atmosphere and the amount removed. This can be achieved in many different ways. The most straightforward but difficult way is to switch all consumed energy to that produced through non-fossil fuel sources (solar, wind, hydroelectric, geothermal, nuclear etc.) It can also involve continued reliance on fossil fuels along with purchase of carbon offsets/credits to remove GHG emissions elsewhere. References to net zero are often made and should be scrutinized since some may, after reading the fine print, only be for a single part of an institution’s purview or is only achieved by purchasing credits. Please note that the terms “net zero,” “decarbonization,” “zero emissions,” “clean energy,” “carbon neutral,” “climate neutral” and “climate friendly,” are defined differently depending on the context, and are sometimes used interchangeably. They all might include fossil fuels or carbon offsets/credits. Terms which generally do not include fossil fuels or offsets/credits include “fossil-fuel free,” “zero-carbon,” “carbon-free,” and “direct reductions.” See the “Net Zero Timeline” and more info here.
Cities
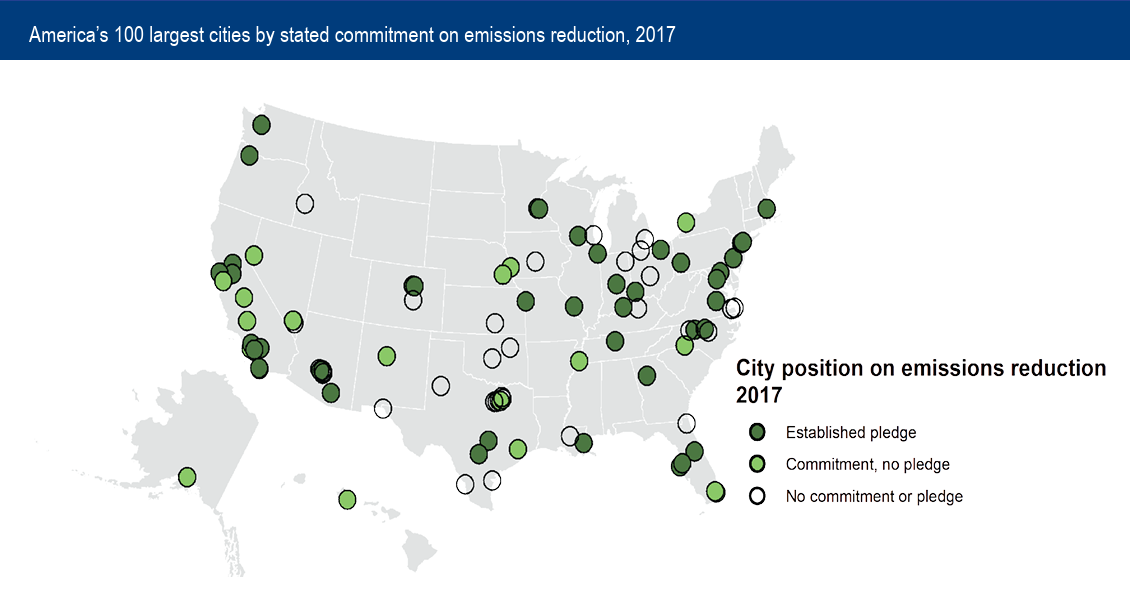
In the U.S., urban regions account for around 70% of GHG emissions, but facilities/operations owned by cities themselves only account for roughly 1-5% of those emissions. Between 2018-2023, 157 U.S. cities published Climate Action Plans (CAPs) that include GHG accounting inventories, which form a necessary baseline to track reductions, and specific reduction targets. Similar to Paris NDCs, there is a large variation in reduction targets, and their timelines. Some of these plans are limited to municipal operations, which represent a very small fraction of a city’s emissions, but a growing number of them are being updated with reduction goals for the commercial and residential sectors. Goals that address high-polluting industries have been slower to develop.
According to Brookings Institute, of the 100 most populous cities in the U.S., about half (45, “Established pledge” on map below) have established GHG reduction targets and corresponding inventories. 22 have committed to reducing emissions but have not established targets or completed a baseline inventory upon which to base a reduction plan (“Commitment, no pledge” on map). The 45 established pledges, if met, would reduce U.S. GHG emissions by roughly 6% of what total emissions were in 2017.
Similar to Paris Agreement national targets, each city plan differs in detail, timeline, specific emissions reduction targets, accounting/reporting mechanisms, and enforcement strategies. Some plans end at 20% or 50% reductions by 2020, 2030 or 2035. The Figure below shows the final targeted percent reduction in emissions and the final year by which the reduction should be fully achieved. The values in parentheses next to the city names correspond to the baseline year of their CAP. Values in blue represent cities with the same reduction target and year.
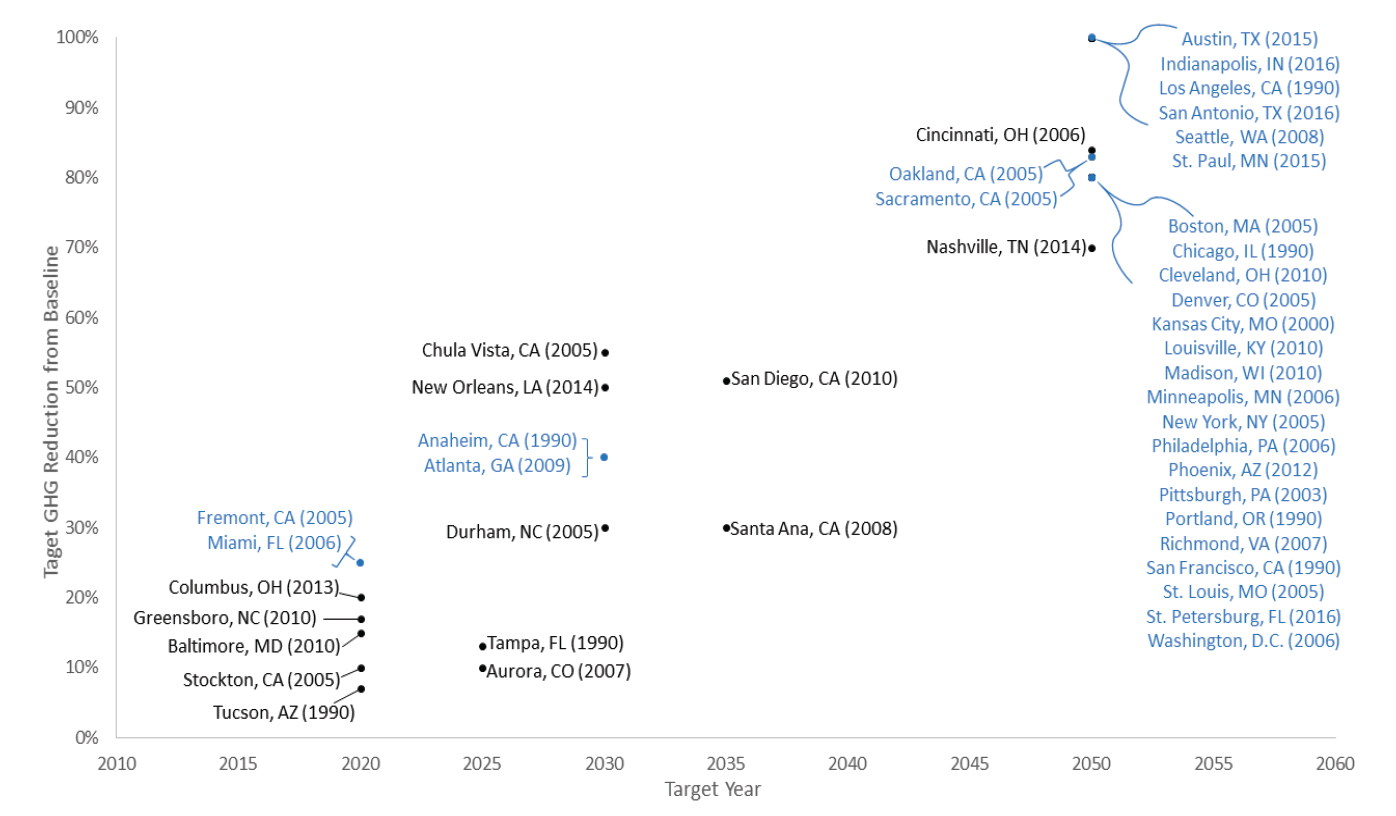
If you would like to investigate a particular city more in depth, this page shows the level of specificity of the plans of the largest U.S. cities, and includes links to the plans themselves.
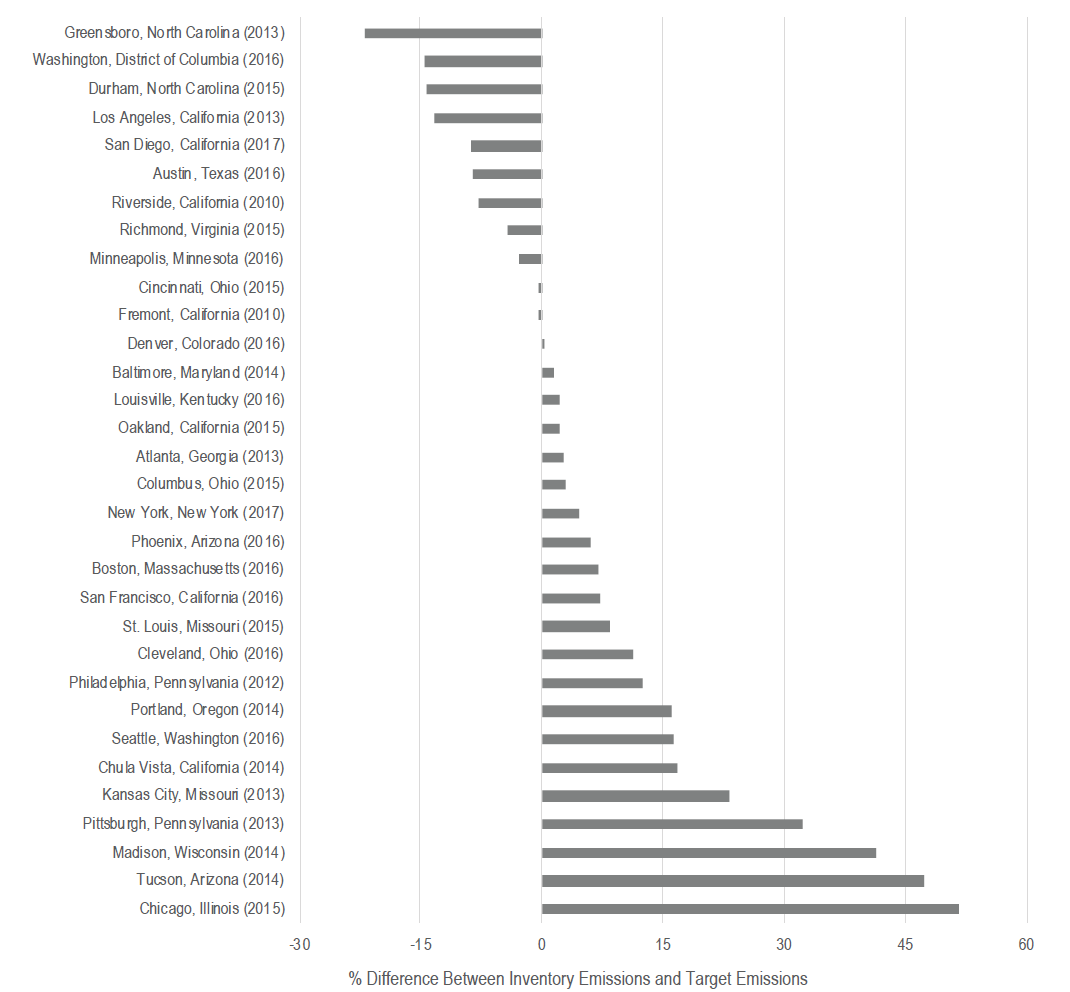
About two-thirds of cities are currently behind their targeted emission levels. On average, cities will still need to reduce their annual emissions by 64% by 2050 in order to reach their ultimate reduction targets. A number of factors may impact a city’s progress towards its stated goals. Some targets are easier to achieve than others. As mentioned above, the targets of some cities, like Greensboro N.C., only seek to reduce GHG emissions of city operations while others like Chicago and Madison seek to reduce city-wide GHG emissions. Moreover, as shown in the previous figure, city commitments vary widely in terms of the timeline and the level of reduction commitments. A city may lay out a vision in a CAP but face political hurdles in implementing the plan. A city government can create policies and plans to spur GHG emission reductions but major reductions only occur through actions by electric utilities, companies, and residents of the city. A city’s economic growth will often increase its energy demand (particularly AI data centers) and complicate the shift from a fossil fuel energy supply. Federal and state policies and programs will also help or hinder a city reaching its reduction target.
The next figure displays the progress of cities towards their goals as the percent difference between the most recent inventory and the targeted emission level in the year of the inventory. Notes: The numbers in parentheses next to the city name represent the year of the most recent GHG inventory. Positive values mean that the emissions from the city were higher than the targeted emissions for that year.
Despite its seemingly slower progress towards its reduction goal, Chicago shows promise in reducing its GHG emissions. Please read this short article describing its efforts to obtain renewable energy, then answer the following question.
Companies
Companies emit greenhouse gases through fossil fuel consumption in their operations to provide goods and services. In the U.S., businesses consume around 40% of all energy used in the form of fossil fuels for transportation, heating and industrial processes. Thus, the business sector represents an important source of emissions.
Among the world’s largest 2,000 companies, it has been estimated that more than half have set reduction targets. These commitments are mostly voluntary, though European countries and the U.S. state of California are introducing mandatory reporting standards, for companies over a certain size. Besides these regulations, companies have a number of incentives for disclosing emissions and announcing targets publicly including: public relations, responding to stockholders, being ahead of government regulations and staying competitive. Commitments have increased significantly since 2019 and are more common among large companies who hold influence over markets and policies, and have enough assets to make bold targets with confidence. They are also likely to have operations within jurisdictions with either required or encouraged reduction goals. This figure shows the cumulative number of firms having made a net zero commitment by firm size. Note that firm size is measured by assets: “Large” ($10 billion or more), “Medium” ($2 billion to $10 billion), “Small” ($250 million to $2 billion), and “Micro-small” ($250 million or less).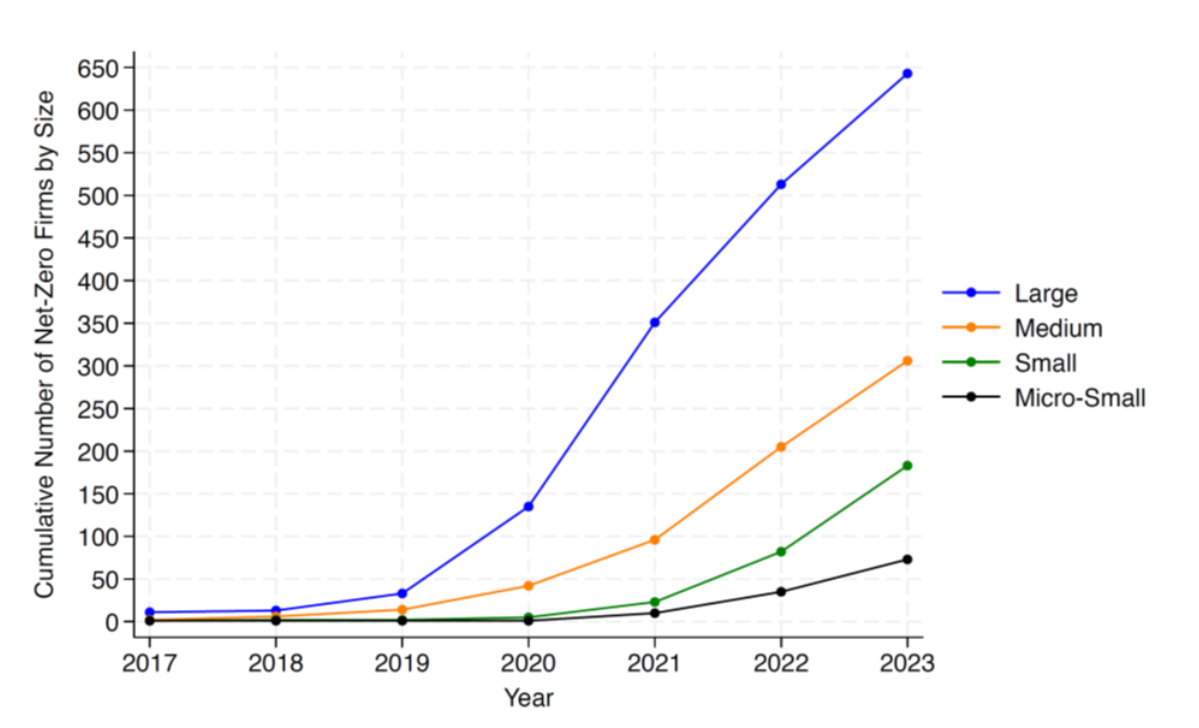
Commitments are typically expressed as net zero obligations although their transparency and clarity vary widely, with many companies announcing plans without the specificity needed for implementation. A major uncertainty is the degree to which obligations are met through the purchase of carbon offsets/credits from emission reductions elsewhere. As will be discussed in a subsequent chapter, the carbon credit/offset market is plagued with poor monitoring leading to some skepticism about whether they represent real reductions.
Most corporate pledges have a short horizon, with close to 50% specifying a target date less than five years away. This reflects the risk adverse nature of companies as the political and economic benefits of GHG reductions can change rapidly with time. Actual commitments to reduce emissions (not through offsets) vary widely, with 70% of pledges committing to a total reduction that is less than 40% of base year emissions. Only 7% of companies in one sample pledged to completely decarbonize, and 72% of those with pledges are behind on their committed trajectories.
Electric Utilities
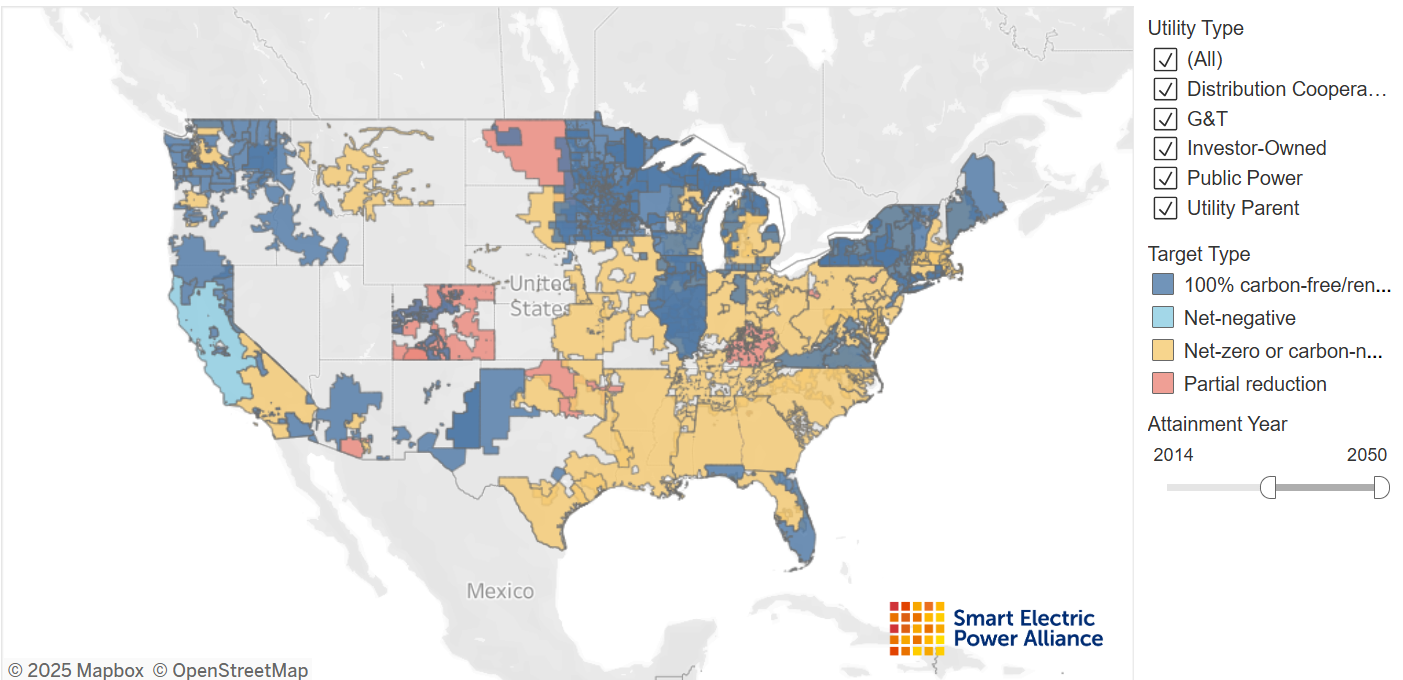
Electric utilities consume 34% of U.S. energy supply to produce electricity consumed by government, individuals, and companies. Utilities have a unique and pivotal role to play in the transition to renewable energy. As key energy providers, they have an inherent leadership position with connections to industries and politicians. Targeting those emissions associated with electricity production helps cities and companies work toward their reduction goals. As opposed to the entities outlined above, utilities have generally committed to the more ambitious Paris Agreement GHG emission reduction pathway, with 81% of US customer accounts now being served by a utility with a reduction target of 100% by 2050. Many of these plans are mandated by the states they operate in.
This map from Smart Electric Power Alliance shows utility reduction targets. Dark blue = “100% carbon-free/renewable energy” (no use of carbon credits/offsets), light orange = “net-zero or carbon-neutral” and light red = a commitment to “partial reductions.” While many of these goals are new, there are both reasons for optimism, with some utilities on track to meet their targets, and reasons for concern with examples of utilities backsliding on theirs.
Large privately owned utility example: Xcel Energy
Xcel is an investor owned utility (IOU) serving parts of Colorado, Minnesota and 6 other states. In 2018, it was the first in the U.S. to announce it would deliver 100% clean, carbon-free electricity by 2050, with an interim target of 80% by 2030. According to Xcel, progress has been steady and they are on track to meet the first target: “Through 2024, we reduced emissions from electricity by 57%, a further 3% decrease from 2023. Our energy mix is also more than 50% carbon-free.” Xcel has closed down 25 coal units since 2007 with no worker layoffs.
Large public utility example: Public Renewable Power in New York
As a result of years of grassroots organizing, the Build Public Renewables Act was passed in New York State in 2023. It enables the New York Power Authority (NYPA), one of the nation’s largest publicly owned electricity providers to, every year, perform a review on whether NY electricity supply is on track to reach 70% renewables by 2030 and 100% by 2040, per state mandates. If it’s not, NYPA will step in to build enough renewable energy infrastructure to make up the gap. The law also introduced a program for low and moderate income residents to receive credits for clean energy produced by the utility and allocated $25 million each year for renewable energy job training, among other measures. Read more here.
Conclusion
“America’s climate-leading states, cities, Tribal nations, businesses, and institutions will not waver in our commitment to confronting the climate crisis, protecting our progress, and relentlessly pressing forward. No matter what, we’ll fight for the future Americans demand and deserve, where our communities, our health, our environment, and our economy all thrive. We will not turn back.“ – The Climate Mayors, a coalition of 350 city mayors from 46 U.S. states
Since 2019, there has been a large upswing of commitments made by cities, corporations, and companies to reduce GHG emissions. These commitments have synergistic effects. The fulfilling of commitments by utilities will allow cities and companies who consume the electricity produced by utilities to more easily reach their commitments. Likewise, city and corporate demand for renewable electricity reduces the uncertainty surrounding renewable investments for utilities and private investors. As contributors to GHG emissions in cities, the fulfilling of corporate commitments contribute to the carbon balance sheets of cities where they or their suppliers operate.
These commitments are significant and if fulfilled will help the U.S. mitigate climate change within its borders despite the lack of federal support. Still, the posture of the federal government does reduce the general pressure on these entities to fulfill their obligations. Thus there may be backsliding. Changes in federal regulatory and investment support of renewables and fossil fuels can also create barriers to green energy transitions. It is important to recognize though that pressure from voters and consumers at the local level (city hearings, public utility commission meetings, local elections) may prove effective.
3.6 degrees Fahrenheit
2.7 degrees Fahrenheit
The United Nations Framework Convention on Climate Change (UNFCCC) is an international treaty to address climate change that came into force in 1994. Most all international actions to address climate change (Kyoto Protocol, Paris Agreement, REDD+) are managed under this international framework.
nationally determined contributions
GDP stands for Gross Domestic Product which is the monetary value of all the goods and services purchased within national borders by persons, businesses, governments. It is a measure of the circulation of money and is commonly used as a measure of a country's wealth.
greenhouse gas