
Debating Greenhouse Gas Emission Responsibilities
Fossil Fuels and GHG Emissions
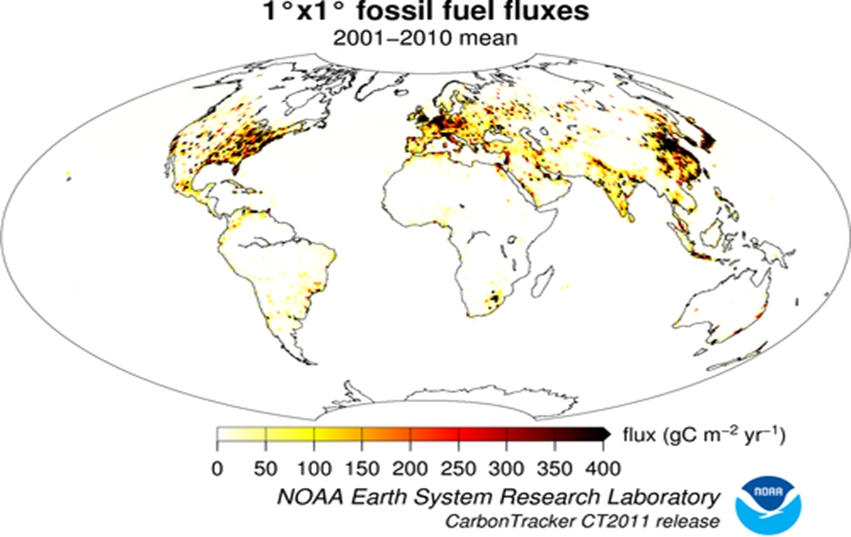
The above map represents the surface density of carbon releases (from 1 degree x 1 degree squares of earth surface) into the atmosphere resulting from fossil fuel burning.
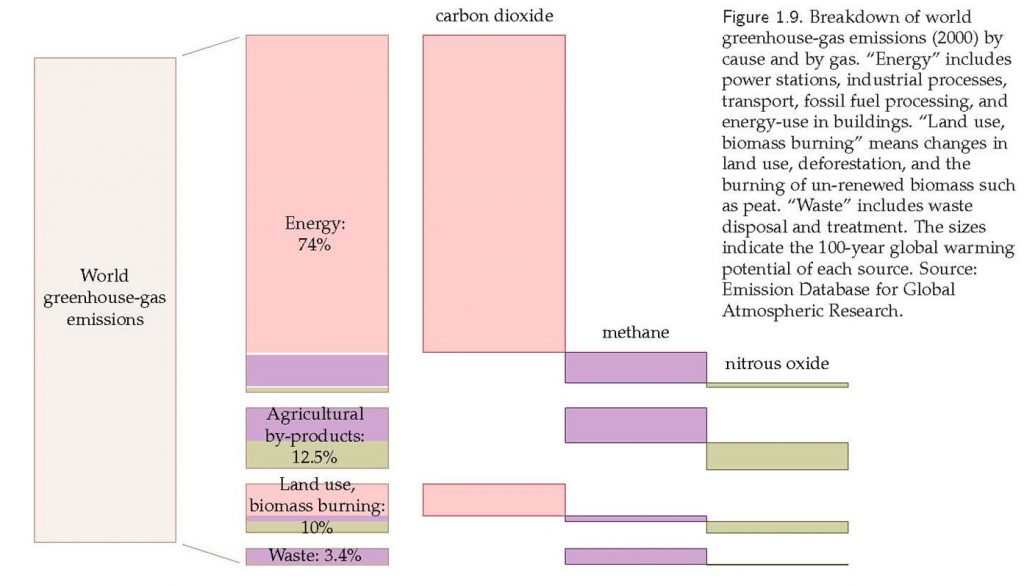
The above diagram describes the breakdown of global GHG emissions by human activities in 2000. Total emissions are expressed in the percentage of 100-yr warming equivalents as produced through different activities (left column) through the release of carbon dioxide (pink) methane (purple) and nitrous oxide (grey).
Before you begin, please answer the following question to demonstrate your basic knowledge of of global sources of greenhouse gas emissions.