
Geography/Environmental Studies 339
Assessing Alternatives to Fossil Fuels (Updated 2022)
Learning Objectives
After completing this chapter, you will:
- Understand our existing fossil fuel energy economy (sources/sinks, subsidies, strengths/limitations)
- Understand the potential for energy conservation as a “source” to address our energy needs
- Understand basic vocabulary of energy use and flow/power
- Be able to explain how alternative energy systems differ in terms of the form of supply, form of delivery and power densities
- Understand the difficulties in transitioning to a renewable energy economy, particularly for the transport/manufacturing sectors
- Be able to assess (qualitatively) how energy storage and transmission infrastructure will need to change in a transition away from fossil fuels
- Understand the continued controversy surrounding nuclear power and its future prospects in a carbon-free future
- Be prepared to perform “back-of-the-envelope” calculations to assess different energy transition scenarios
Fossil Fuel Dependence in the U.S.
Fossil fuels – coal, oil, and natural gas – are very dense sources of energy when burned, especially when compared to other energy sources, like burning wood or charcoal. Coal, for example, has three times the energy density by weight as wood, meaning that less space needs to be dedicated to carrying and storing fuel. Using fossil fuels for energy allows for more power, more conveniently. Looking at the graph below, you can see how these energy sources paved the way for our industrial revolution and the shaping of the modern world as we know it. Today, fossil fuels are the lifeblood of our modern economy: they account for more than 80% of the U.S.’s total energy consumption.
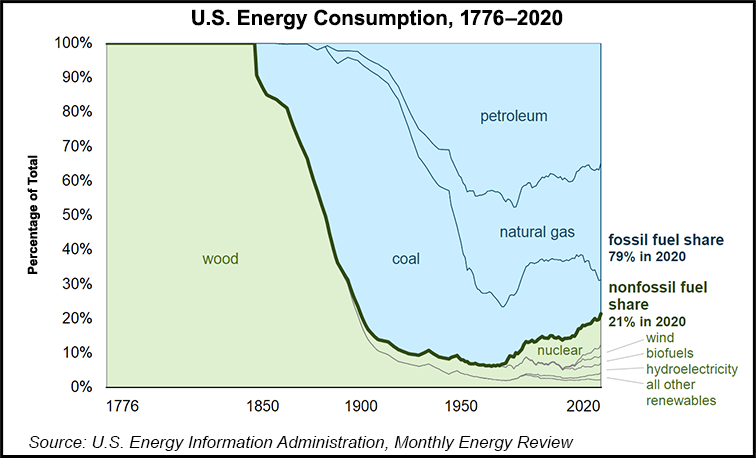
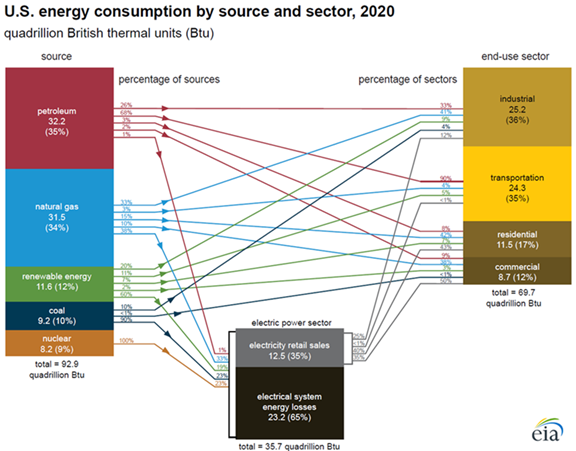
Despite national efforts to move away from fossil fuel consumption, the U.S. still relies heavily on coal, oil, and natural gas. The graph below shows the relationship between our sources of energy (where our energy comes from) and our end-uses of energy. Take a look at how different sectors of our society rely on different energy sources in the chart below:
Subsidies
Our fossil fuel dependence also stems from our political landscape of fossil fuel subsidies. A fossil fuel subsidy is any policy or action that artificially lowers the production costs of energy from fossil fuels (like tax breaks to fossil fuel industries) or lowers the end prices that consumers pay (such as fixing the price of gas). These subsidies can be direct (like the examples listed previously) or indirect, such as allocating government funding to fossil fuel research and development. Some analysts argue that the hidden costs of fossil fuels, like impacts on air pollution, represent a third kind of subsidy as well.
According to the Environmental and Energy Study Institute, “conservative estimates put U.S. direct subsidies to the fossil fuel industry at roughly $20 billion per year; with 20 percent currently allocated to coal and 80 percent to natural gas and crude oil.” For reference, European Union subsidies are estimated to total 55 billion euros annually, or 55.35 billion USD. Though fossil fuel subsidies at one point in our nation’s history may have incentivized development of domestic energy sources, today these subsidies represent political and economic barriers to phasing out fossil fuel dependence.
Political Costs
Where U.S. direct subsidies represent an economic cost, there are global political costs associated with our fossil fuel economy as well.
- Fossil fuel industries operate on large economies of scale (i.e., the greater the scale of the operation, the cheaper it becomes to produce the fossil fuel). Increasing the economy of scale often leads to concentrations of power in the hands of a few.
- U.S. dependence on imported oil has historically motivated foreign policy and military intervention in major oil-producing countries. Many of the U.S.’s military interventions in the Middle East in the past century, for example, have been motivated by continued access to cheap oil imports.
- The 2022 Russian invasion of Ukraine highlighted the contemporary role of fossil fuels in war. Russia’s wealth largely comes from its production of oil and natural gas. Many countries, including the U.S., placed bans on Russian fossil fuel imports to decrease Russia’s financial assets and funding for the war in Ukraine. However, global dependence on Russian energy products remains high, and the domestic cost of these political interventions were reflected in extremely high prices of gas prices at the pump.
“The energy crisis exacerbated by the war in Ukraine has seen a perilous doubling down on fossil fuels by the major economies. The war has reinforced an abject lesson: our energy mix is broken. Had we invested massively in renewable energy in the past, we should not be so dramatically at the mercy of the instability of fossil fuel markets now.”
– Antonio Guterres, U.N. Secretary General (June 2022)
Low-Carbon Alternatives
Moving away from our fossil fuel dependence at all scales means investing in low-carbon alternatives, or energy sources that release lower carbon emissions than traditional fossil fuels. Low carbon alternatives include renewable energy sources, nuclear energy, as well as reduction of energy use overall.
In this section, jump to:
Energy Conservation
Nuclear Energy
However, there remain a number of concerns about nuclear power’s risks including:
- Persistent operating risks often tied to human error
- Risks of radioactive release stemming from natural hazards (earthquakes, hurricanes, tsunamis, tornados)
- Risks of radioactive release from nuclear facilities due to terrorism
- Unresolved technical and political issues related to long-term fuel disposal and storage
- In 2011, an earthquake and tsunami in Japan resulted in serious damage to the Fukushima nuclear power complex, including the failure of cooling systems, three nuclear meltdowns, and release of radioactive contamination within the plant. Water contaminated with radioactive isotopes was ultimately released into the Pacific Ocean.
- In 2022, Russian forces captured the Zaporizhzhia Nuclear Power Plant in Ukraine as a military strategy to control Ukraine energy sources. Ukraine relies heavily on nuclear energy, with 20% of the total energy supply coming from the Zaporizhzhia power plant.
- The political and environmental threats associated with nuclear power, combined with the rising costs of nuclear energy production, has led to interest in decommissioning operational plants around the world.
- However, increased production capacity at existing nuclear plants have enabled the industry to maintain a consistent output of electricity generation in recent years.
Despite these risks, many experts and politicians have argued that the zero-emission benefits of nuclear energy make it a necessary component of a clean energy future:
- “Nuclear power needs to be a core component of electricity generation if we are to meet our emission reduction targets” John Kerry (Op-Ed, October 2009).
- “Nuclear energy is clean energy and it’s vital to creating good-paying jobs, supporting our energy transition, and saving our planet.” – U.S. Secretary of Energy Jennifer Granholm via Twitter, Jan 25, 2022
- “Nuclear and renewables need to join together in the climate fight, not compete. That’s been the conclusion of nearly every study of this subject — from the UN’s panel on climate change, to the best work of our national laboratories. The case for nuclear energy is strengthened by an emerging generation of nuclear plants that are likely to be much less expensive and safe, with lower waste.” – Dr. Kerry Emanuel, Professor of Atmospheric Science at MIT
Renewable Energy
Renewable energy is a third low-carbon energy alternative, and includes solar, wind, hydropower, and biofuels. This energy source comes directly from the current energy from the sun that is absorbed in Earth’s systems. In the rest of this module, we’ll discuss the potential and challenges of renewable energy in efforts to reach a low-carbon future.
Potential for Renewable Energy
In this section, jump to:
Form, Delivery, and Power Density of Energy Supplies
Understanding the potential of renewable energy to meet our energy needs is complicated. Unfortunately, listening to politicians from both the right and left in the US does not clarify the issues. An example comes from Donald Trump in a speech comparing wind power with coal. This quote displays significant ignorance of current energy technology and economics.
A quite different example comes from a speech some ten years earlier by Al Gore — one of the most informed politicians on energy issues. This is a famous speech on energy policy and for those of you who would like to watch the speech in full, click here.
| Don’t worry about wind, when the wind doesn’t blow, I said, “What happens when the wind doesn’t blow?” Well, then we have a problem. Okay good. They were putting them in areas where they didn’t have much wind, too. And it’s a subsidary [sic] — you need subsidy for windmills. You need subsidy. Who wants to have energy where you need subsidy? So, uh, the coal is doing great.”
– Donald Trump, Speech in Utica, New York, August 13, 2018 |
“Scientists have confirmed that enough solar energy falls on the surface of the earth every 40 minutes to meet 100 percent of the entire world’s energy needs for a full year. Tapping just a small portion of this solar energy could provide all of the electricity America uses…And enough wind power blows through the Midwest corridor every day to also meet 100 percent of US electricity demand.”
– Al Gore, Speech in Utica, New York, August 13, 2018 |
Form, Delivery, and Power Density of Energy Supplies
- Remember from the introduction that fossil fuels are remarkable stores of chemical energy, with a large amount of energy stored in chemical bonds by unit weight or volume. Not only are these fuels highly energy dense, but the energy bonds in fossil fuels are relatively stable over time. One can store and transport coal, oil, and natural gas over long distances without losing the quality of this energy.
- As a result, fossil fuels (particularly petroleum) are ideal portable fuel supplies. The internal combustion engine was developed from this characteristic, on which entire transportation systems are based. Therefore, on economic and technical grounds, society has benefited from the characteristics of fossil fuels.
- The forms in which renewable energy types are supplied are quite different. Most cannot be seen as energy stores but flows.
- As flows, solar and wind energy must be captured and converted to different forms to be useful. Both are most abundant at certain times of day, and so must be stored for use when they are absent.
- Biomass (e.g., biofuels) are chemical stores of energy but with a much shorter shelf life compared to fossil fuels. They decompose relatively quickly.
- Hydroelectric is generated from converted solar energy that drives the water cycle and does have storage abilities, since water can be held behind a dam rather than being released.
| Type | Storage |
End-use Form |
| Photovoltaic Solar | Flow | Electricity |
| Thermal Solar | Flow | Heat |
| Wind | Flow | Electricity |
| Biomass | Store (couple of months) | Liquid Fuel |
| Hydroelectric | Reservoir | Electricity |
The table above shows the varied storage forms of different types of renewable energy. You can also see that there are two different types of solar energy available. Photovoltaic solar energy relies on light photos to generate electric currents and thus produce electricity. Solar thermal systems generate energy through the direct heating of water or other fluids through sunlight. Systems that use thermal energy include residential hot water heating systems and passive architectural design features to produce heat in buildings.
- When captured, renewable energy supplies are converted into a particular energy form for delivery. Many of our renewable options (including tidal and geothermal not listed in table) supply energy to end uses in the form of electricity. Considering that electricity now supplies less than 40% of our energy end uses (the rest being largely fossil fuels), a renewable future would require not only significant changes in energy generation and storage, but in the infrastructure systems that supply this electricity.
- Our transportation sector, which consumes more than a quarter of US energy supply, currently depends on petroleum-based liquid fuels (90%). Think about our dependence on the internal combustion engine. Movement away from fossil fuels will require a combination of drastically-increased electricity use (for example, via electric vehicles) and biofuel use in the transportation sector. The infrastructure changes associated with such a transformation would be significant.
Power Density
Power density refers to the rate of energy flow per unit land area. This concept is different, though related, to energy density from the beginning of the module. Recall that fossil fuels have a high energy density, meaning that they store a high amount of energy in a given volume, mass, or area.
- Power density can be understood as the energy flow (measured in watts) that can be captured or produced per unit land area through a particular energy supply. We can also think about energy consumption in this way — the amount of energy consumed per unit land area. For instance, a skyscraper will have a higher power consumptive density than a single-story house.
- Power density is a characteristic of energy supply that shapes our infrastructure and settlement patterns. In urban areas with high energy needs, having a high power density is crucial. In many ways, we can say that our cities are in part the outcome of the HIGH power densities provided by fossil fuels.
- Watts (W) are units of the rate of energy flow (power) and therefore power density is the energy flow per unit land area (m2).
Reflect on the following questions as you look through the charts below:
– Can our cities be powered with rooftop photovoltaics?
– How can our cities be powered through renewables?
– What kinds of energy supply and transport infrastructure would be required?
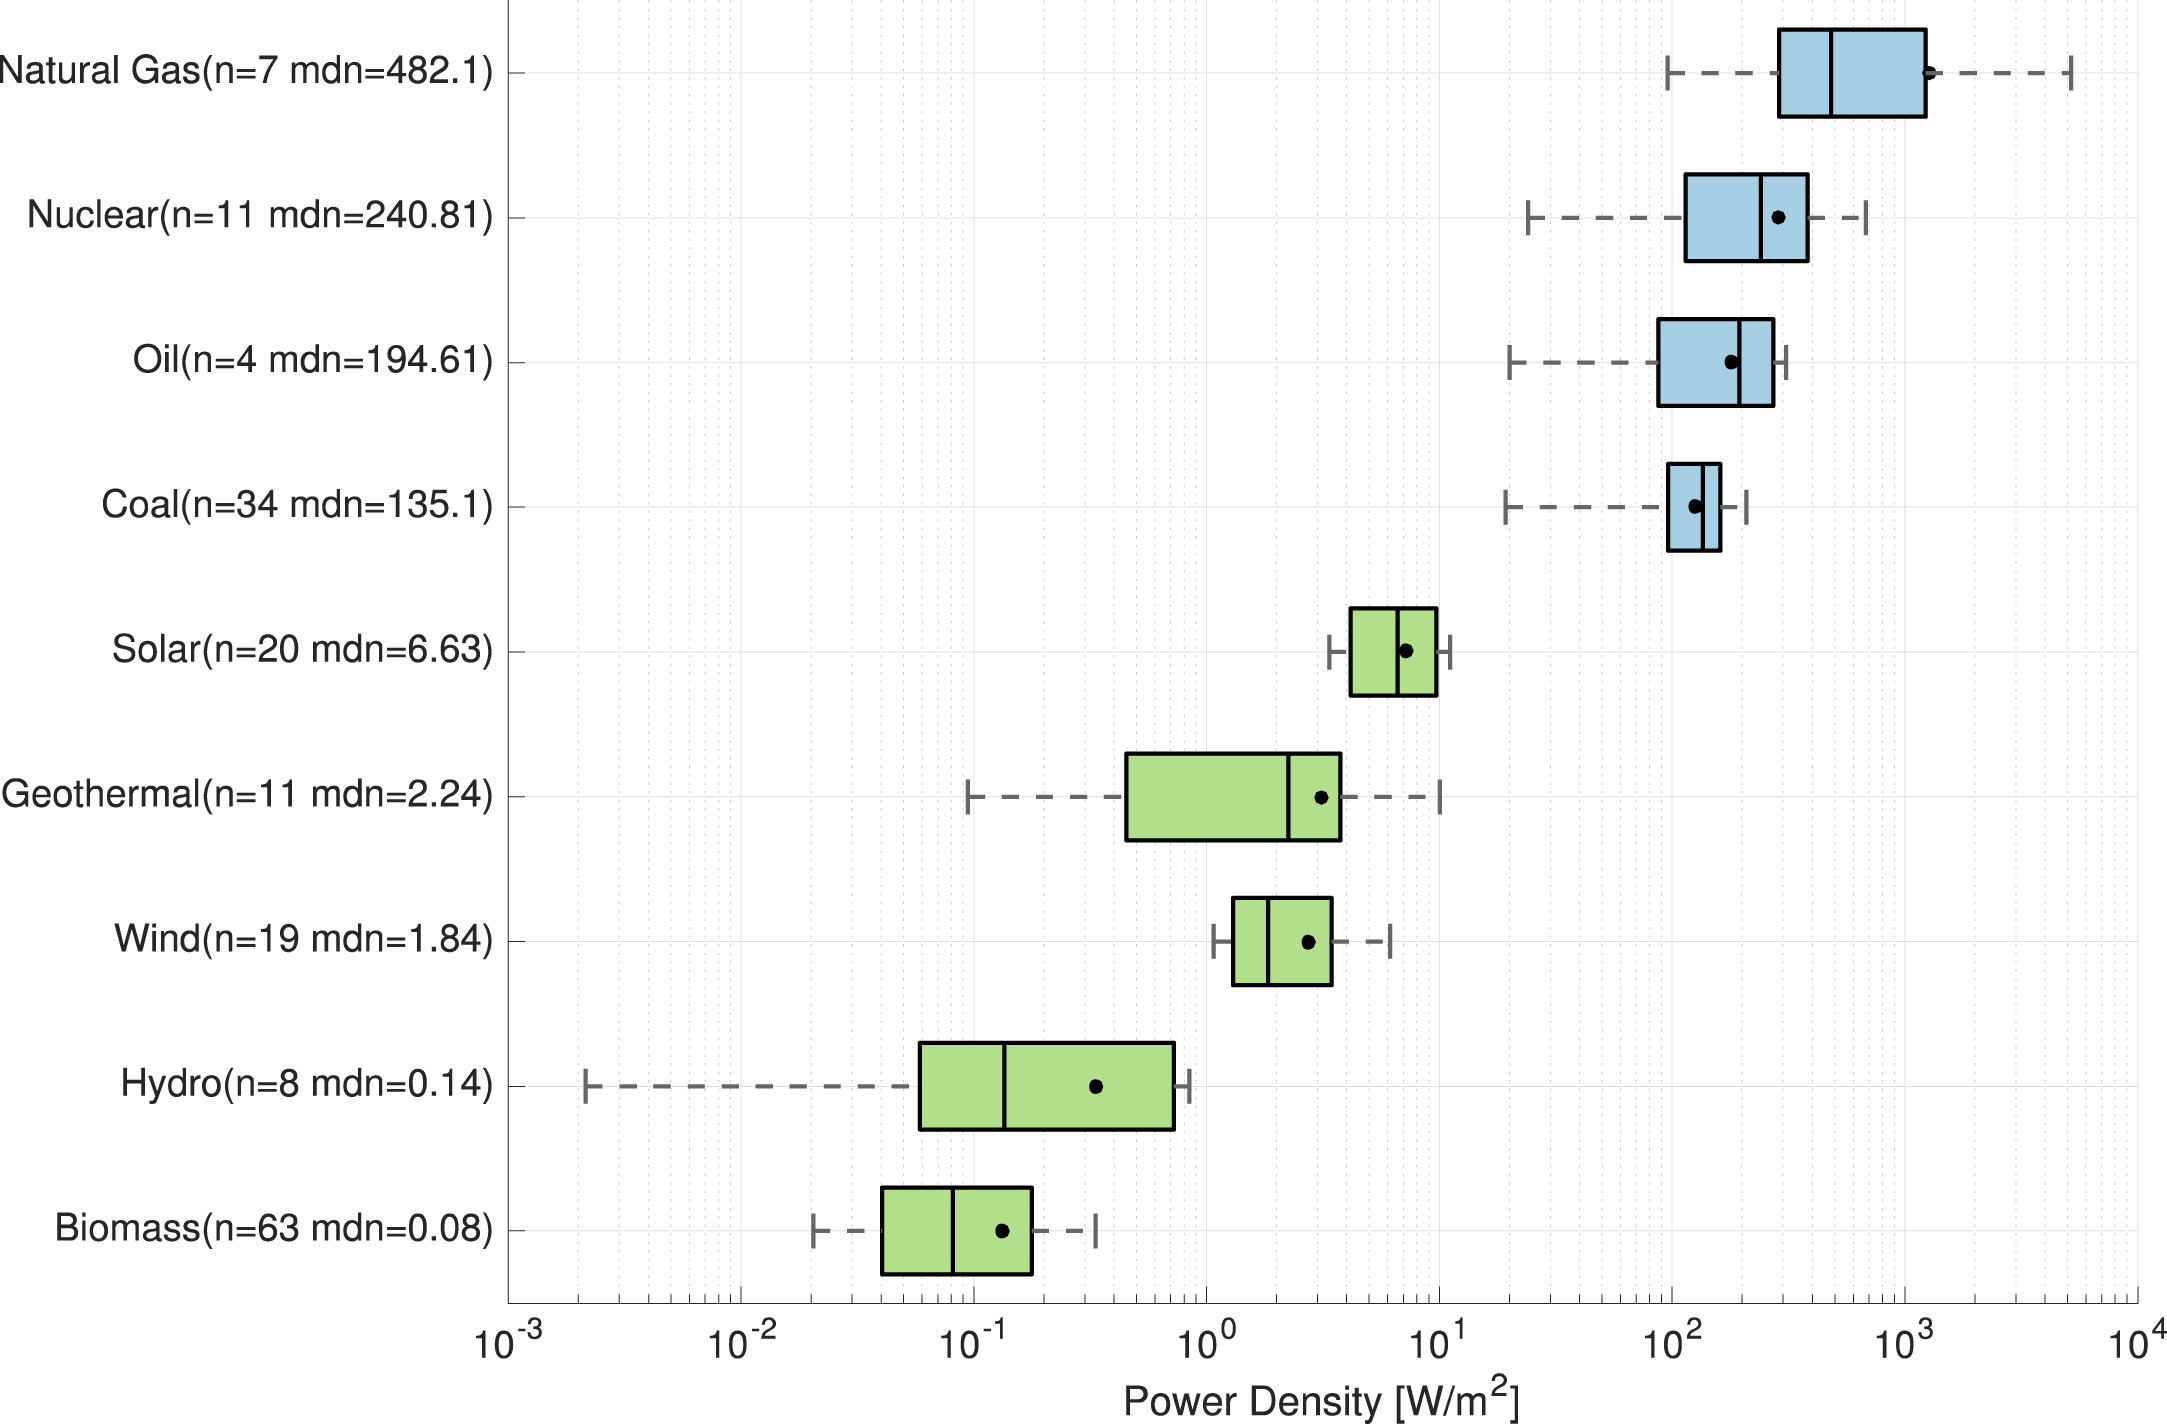
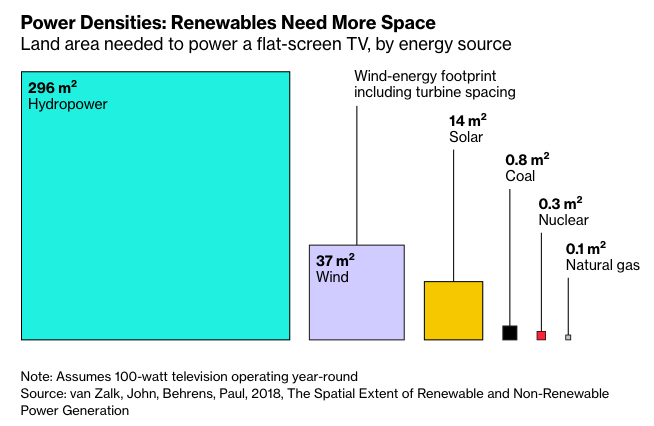
The first graph presents differences in power densities of renewable and non-renewable energy sources. Please note that renewable energy power densities are much lower than fossil fuel facilities — renewable energy supply is diffuse.
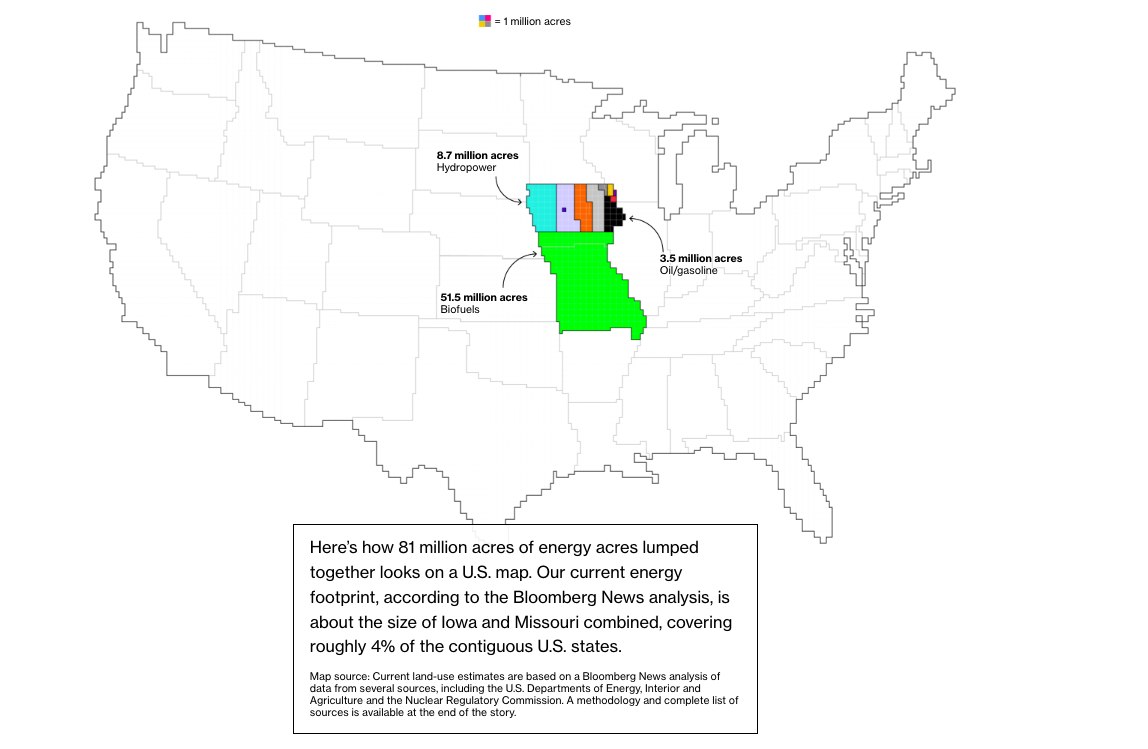
Right now, the current U.S. energy sector requires about 81 million acres (33 million hectares) of land. The figures below show distribution of land by energy source:
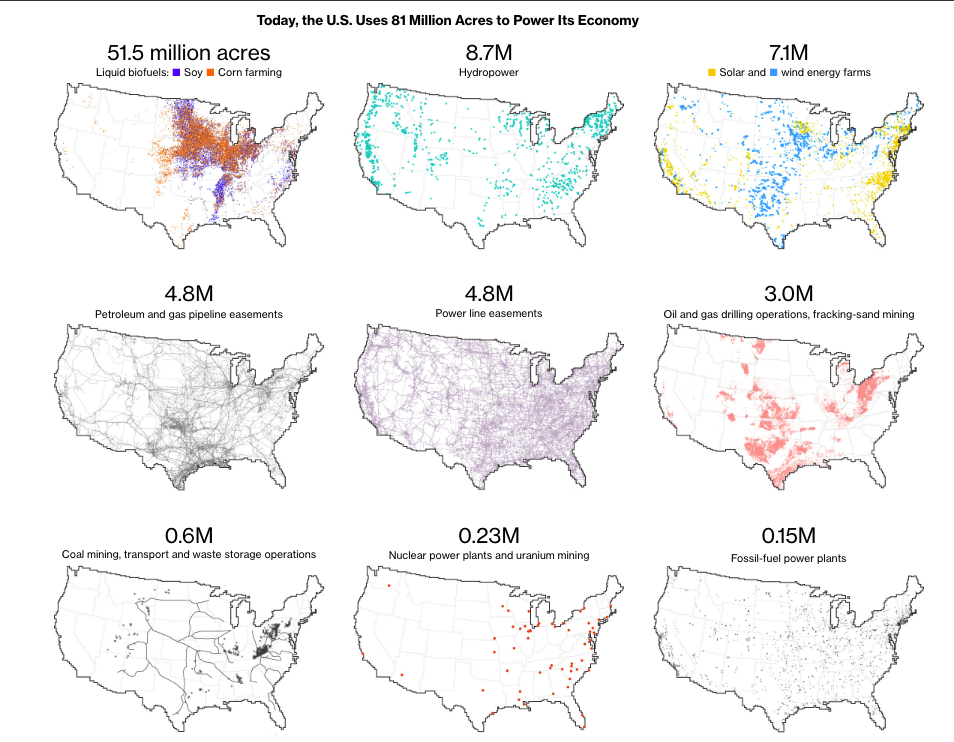
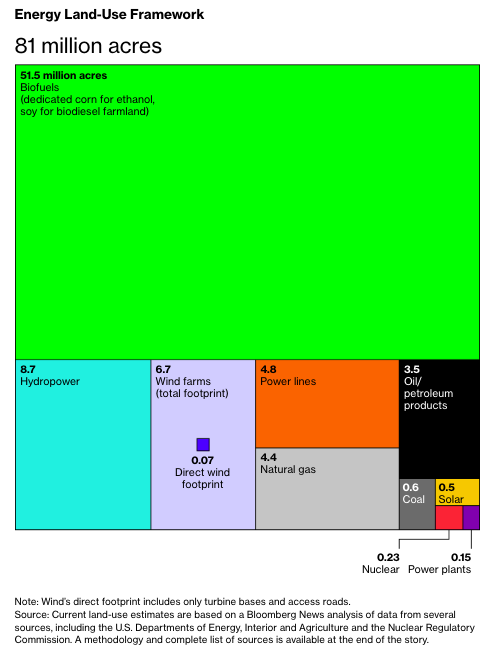
When combined, total land use for our energy production takes up approximately the size of Iowa and Missouri:
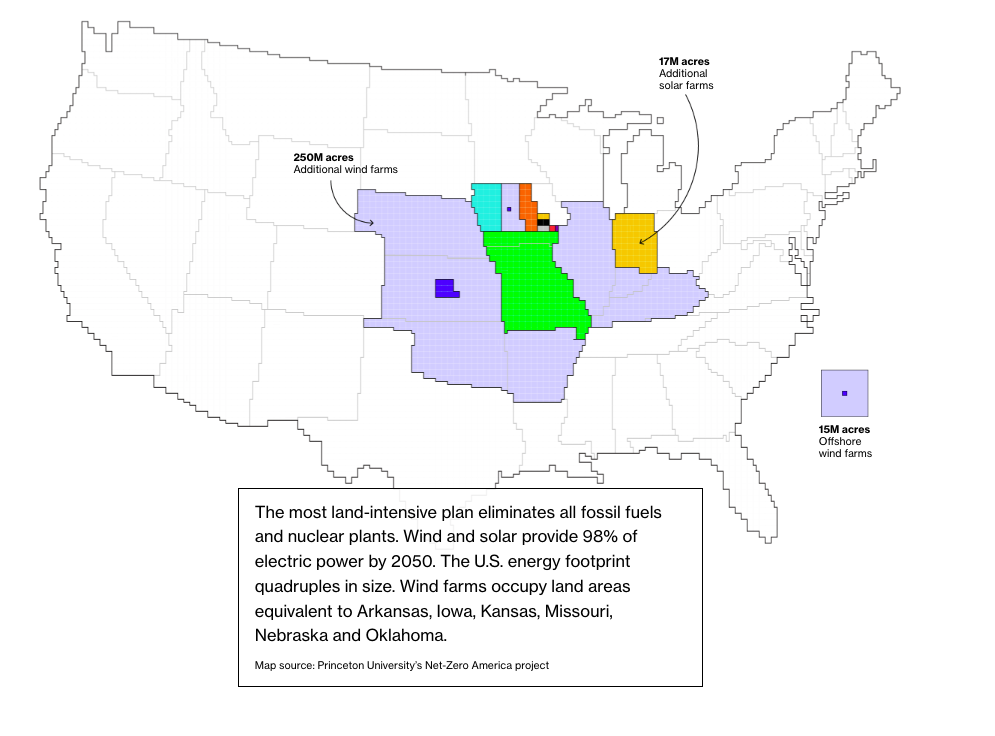
If fossil fuels are fully eliminated and our energy production transitions fully to renewable energy, the total land area needed will have to expand by nearly quadruple in size:
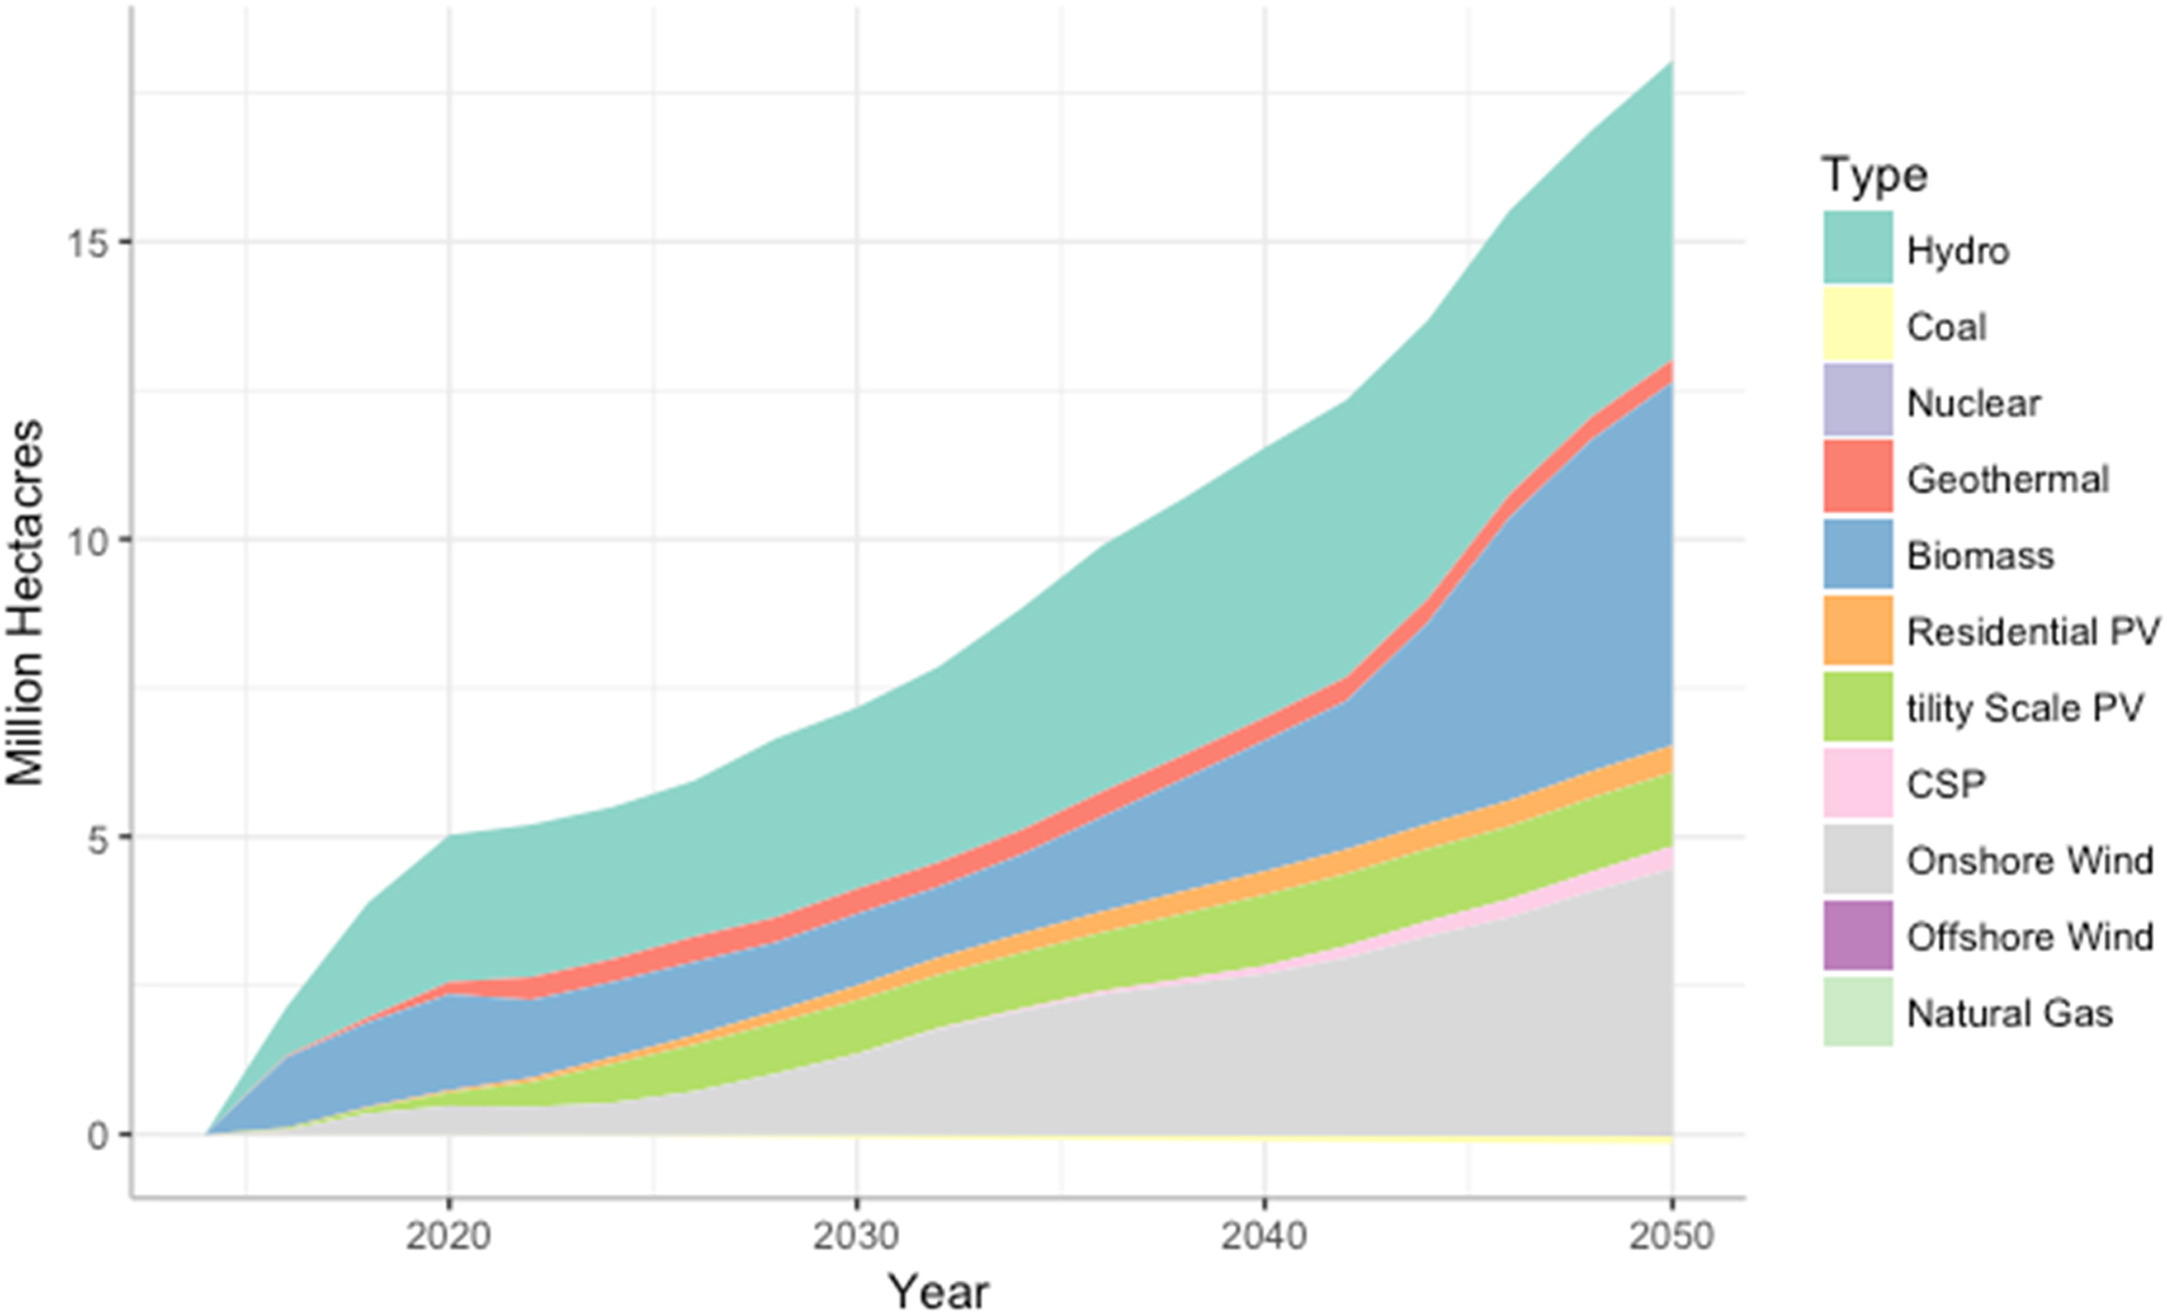
However, many renewable energy transition plans do not fully eliminate fossil fuels. The following chart shows the changes in land use needed to convert our electricity system to 80% renewable energy by 2050. The three main drivers for growth in land-use includes the increase in hydropower, biomass, and onshore wind energy systems, which have the three lowest power densities among systems.
Introducing McKay
Examining McKay
In class, we will follow the approach that MacKay uses for Great Britain to assess the potential for transforming the U.S. energy system away from fossil fuels. For Great Britain, MacKay expresses current energy use in terms of KW-hrs/person-day. He uses this notation to make numbers more meaningful to the individual. If one wishes to know Great Britain’s total average daily energy use, one simply multiplies MacKay’s per-person value by the population of Great Britain. If one wants to know the total annual energy consumption of an individual, one would multiply the total daily consumption by 365.
It is important that you understand that KW-hrs/person-day is a rate of use. KW refers to Kilowatts or 1000 Watts. As mentioned earlier, a watt is the rate of energy flow and thus KW-hrs (equal to rate (energy/time) x time) is a measure of energy use or production. For instance, the electrical energy used to illuminate a 60 W light bulb all day is equal to 60W x 24 hours = 1440 W-hrs or 1.44 kWh. MacKay expresses Great Britain’s current energy use by the average total amount of energy used per person per day for different uses (electricity, heating, and transport). This is equal to 125 kWh per day per person.
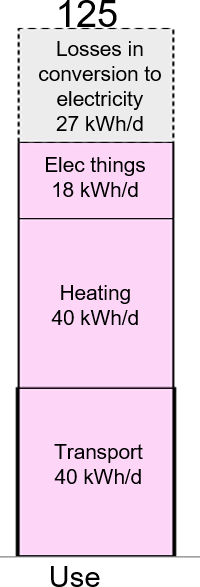
- The stacked-bar figure to the right is MacKay’s summary of Great Britain’s current energy consumption for transportation, heating, and electricity sectors. This total amount of energy amounts to 125 kWh/person-day.
- Virtually all electricity produced is generated through the burning of fossil fuels. A major difference between renewables and fossil fuels is that the former directly produces electricity, while fossil fuels need to be burned in power plants to produce electricity.
- Only 40% of the energy contained in fossil fuels is converted into electricity in typical power plants, while the rest is lost in conversion – this is represented by the gray portion of the stacked bar. So while total fossil fuel consumption for electricity amounts to 45 kWh/person-day, only 18 kWh/d (40%) returns to the consumer.
- Therefore, shifting to renewable energy supply could supply Great Britain’s electricity needs with less energy consumed (60% less). Instead of requiring 125 kWh/person-day to supply Great Britain’s needs, now only 98 kWh/person-day of renewable energy would be required (125 kWh/person-day – (0.6 x 45 kWh/person-day). Make sure that you understand this.
1. the technical potential of renewable energy systems to supply current energy needs;
2. the potential of energy conservation in reducing our need for energy;
3. the gap between energy needs with conservation and what renewable energy systems can supply; and
4. a mix of other carbon-neutral alternatives to cover the gap such as nuclear, clean coal, or the importation of energy produced from renewable supplies elsewhere
In class, we will work through examples of McKay’s estimates together, using the same approach he used for Great Britain to consider the potential for renewable energy systems in the U.S. Our calculations and conclusions will be different than MacKay — not only because of the significant differences in renewable energy potential in the United States compared to Great Britain, but because we will be using numbers that better reflect current technology.
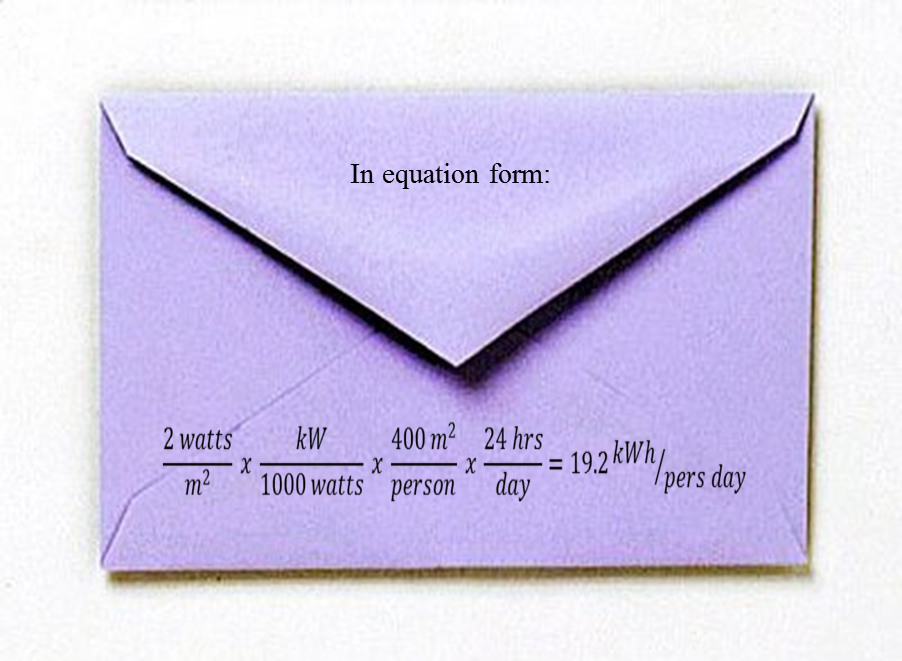
In preparation for class, consider how McKay estimates the wind power potential for Great Britain. He expresses wind power potential as the average amount of energy (kWh) that could be supplied per person each day. His back-of-the-envelope calculation assumes that the windiest 10% of the country, equal to 400 m2 of land per person, is covered in windmills that can produce 2 watts/m2 of electricity on average. Electricity production per unit land x amount of land available/person-day is the basis for his estimate (along with necessary conversion factors watts to kW; hrs to days) for Great Britain’s wind power potential of 19.2 kWh/per-day. See the equation below:
Pathways Forward: Transitions to Renewable Energy
At this point we’ve spent time considering somewhat theoretically the potential for renewable energy as an alternative to our fossil fuel consumption and some of the challenges involved with power density and land use. But what does a renewable energy transition actually look like in practice? In this last section, we’ll investigate a case study of California’s renewable energy transition, including specific challenges and opportunities they have faced.
- In February 2022, California approved a plan to achieve 80% clean electricity by 2030. The state is committed to reaching 100% carbon-free energy by 2045.
- Much of this plan depends on large investments in solar power and off-shore wind infrastructure, as well as the scaling up of electric car use. The state has already installed thousands of miles of solar panels along Interstate 10 and solar energy systems in 1.3 million homes.
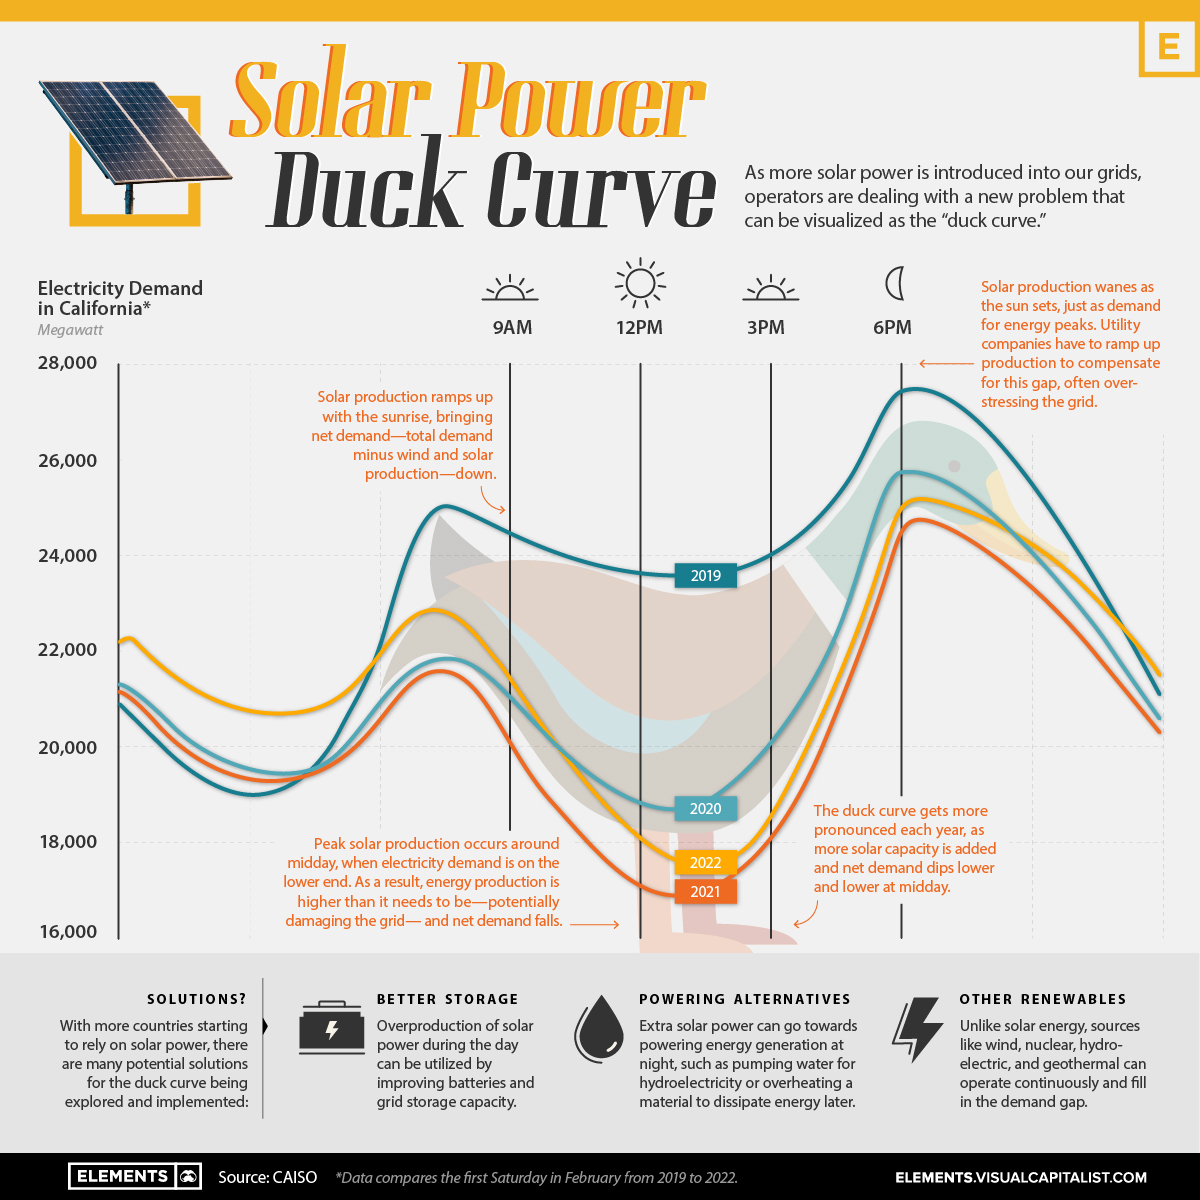
- In May 2022, California recorded meeting 100% of its electricity demand from renewable sources for the first time, with solar providing the largest share among energy sources at 66%. However, this output lasted for only about an hour.
- The reliance on solar energy introduces challenges related to the diurnal energy flow, or the Earth’s 24-hour cycle of sunlight. Because of variation in solar energy through the diurnal energy cycle, certain types of renewable energy are more available at certain times of the day.
- For example, solar energy availability rapidly diminishes in the evening and is not available at night. Yet it is in the morning and evening hours when energy consumption needs are highest.
- The graph below shows this discrepancy between solar power supply and demand, commonly referred to as the “duck curve.” Ultimately the duck curve is a good problem to have, because it means that our solar production capabilities are generating high amounts of renewable energy.
- Looking at the graph below which plots electricity needed in California (electricity demand) beyond that supplied by renewables across a typical day, what do you think caused the change in the curve from 2019 – 2021?
- There are a few options for flattening the duck curve so that energy demand more closely aligns with the energy supply. Options include: 1. The development of energy storage infrastructure; 2. The development of a more integrated electrical grid system that moves electricity from areas of access to areas of deficit; and 3. The need to shift electricity demand to night-time hours (EV charging, some industrial processes…etc.).
- Increasing energy storage capacity of the grid would allow overproduction of solar power during the day to be utilized later at night. However, technology for large-scale renewable energy storage is still limited and relatively expensive. The main storage technology used today is hydro-pump storage, which uses renewable energy to pump water to higher-elevation reservoirs, and then generates power as water moves to a lower-elevation reservoir. However, this form of storage has geographic limitations. Lithium-ion batteries have also received attention in recent years, though capacity, battery life, and cost are still major challenges.
- Other challenges with matching supply and demand were highlighted in the summer of 2020, when extreme heatwaves led to dramatically-increased demand for electricity. Sweeping power outages were triggered when supply could not keep up with demand.
- Despite these challenges, the potential for California to achieve its clean energy goal is still hopeful. The cost of solar energy production continues to decrease, and California continues to pledge funding for continued renewable energy investment. In many ways, this case shows how state and local governments can work with renewable energy industries to more quickly achieve milestones in reaching clean energy goals.
COMPLETION.
YOU ARE FINISHED!