Debating Greenhouse Gas Emission Responsibilities
Implications of Cumulative Emissions Restrictions
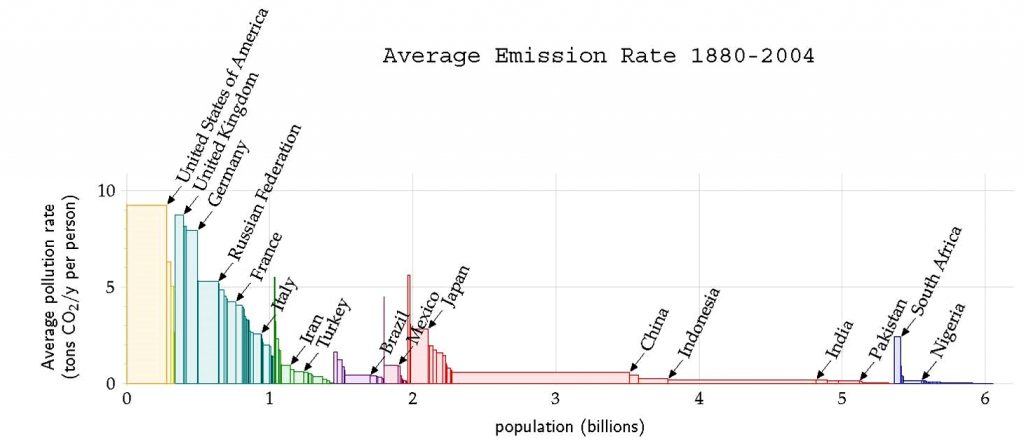
The residence time of emitted carbon dioxide is around 100 years, now let’s consider how responsibility for GHG reductions would shift if we were to consider cumulative emissions since the onset of the industrial revolution.
The graph to the right is the same as presented in the previous page but the area of each rectangle represents the cumulative greenhouse gas emissions for each country from 1880-2004. The width of each rectangle is population of the country in 2000 while the height is the “average” per capita emissions per year over the period calculated by dividing the cumulative emissions from 1880-2004 by population in 2000 and by 124 years.

From MacKay, D. J. C.. 2008. Motivations. Pgs 2-21 In Sustainable Energy – Without the Hot Air. Cambridge, UK: UIT Cambridge
