
25 Chemistry of the Atmosphere (M5Q6)
Introduction
Learning Objectives for Chemistry of the Atmosphere
- Describe the basic science of greenhouse gases and evidence for climate change.
| Chemistry of the Atmosphere | Greenhouse Gases and Climate Change |
Approximately 300 miles thick, the earth’s atmosphere is the only atmosphere known in the solar system to sustain life. It is composed primarily of nitrogen (78% by volume), followed by oxygen (21% by volume), and 1% of other gases. This means there are more than 20 million tons of nitrogen over every square mile of the earth’s surface. Oxygen is a colorless, odorless, and tasteless gas at ordinary temperatures. It is slightly denser than air, and although it is only slightly soluble in water (just 0.0003 moles/L of O2 dissolves in water when it is exposed to air), oxygen’s solubility is very important to aquatic life. The remaining 1% consists of other gases, including noble gases, water vapor, sulfur-containing compounds, and carbon dioxide. Collectively, this mixture of gases gives us the air we breathe and protects earth from the sun’s radiation and debris from the solar system.
When discussing the composition of air, using percentages make sense for the abundant molecules such as nitrogen gas (78%). When discussing less abundant molecules, percentages can become cumbersome, such as for carbon dioxide (0.0400%). Very low concentrations are often expressed using appropriately small units such as parts per million (ppm). Like percentage (“parts per hundred”) units, ppm may be defined in terms of masses, volumes, mixed mass-volume units, or numbers of molecules.
For example, the number of CO2 molecules in air can be expressed as:
ppm = [latex]\frac{400\;\text{CO}_{2}\;\text{molecules}}{\text{1 million total air molecules}}[/latex] = 400 ppm
Since carbon dioxide is not very abundant, persistent changes in the amount of carbon dioxide can have huge impacts on the atmosphere and life on earth. Follow this to see the current carbon dioxide level as measured at the Mauna Loa Observatory.
Example 1
Calculation of Parts per Million and Parts per Billion Concentrations
According to the EPA, when the concentration of lead in tap water reaches 15 ppb, certain remedial actions must be taken. What is this concentration in ppm? At this concentration, what mass of lead (μg) would be contained in a typical glass of water (300 mL)?
Solution
The definitions of the ppm and ppb units may be used to convert the given concentration from ppb to ppm. Comparing these two unit definitions shows that ppm is 1000 times greater than ppb (1 ppm = 103 ppb). Thus:
The definition of the ppb unit may be used to calculate the requested mass if the mass of the solution is provided. However, only the volume of solution (300 mL) is given, so we must use the density to derive the corresponding mass. We can assume the density of tap water to be roughly the same as that of pure water (~1.00 g/mL), since the concentrations of any dissolved substances should not be very large. Rearranging the equation defining the ppb unit and substituting the given quantities yields:
ppb = [latex]\frac{\text{mass solute}}{\text{mass solution}}[/latex] × 109 ppb
mass solute = [latex]\frac{\text{ppb}\;\times \;\text{mass solution}}{10^9 \;\text{ppb}}[/latex]
mass solute = [latex]\frac{15\;\text{ppb}\;\times\; 300\;\text{mL}\;\times\;\frac{1.00\;\text{g}}{\text{mL}}}{10^9\;\text{ppb}}[/latex] = 4.5 × 10⁻⁶ g
Finally, convert this mass to the requested unit of micrograms:
Check Your Learning
A 50.0-g sample of industrial wastewater was determined to contain 0.48 mg of mercury. Express the mercury concentration of the wastewater in ppm and ppb units.
Answer:
9.6 ppm, 9600 ppb
Go to the Mauna Loa website. Scroll down to the graph of CO2 concentration (ppm) vs time and immediately below the graph are orange links. Click the link for “Two Years” and determine the change in CO2 concentration over the last two years (about 5 ppm). Now click on the “Since 1958” link. Why do you think that the CO2 concentration oscillates every year? Hint: think about the difference between the northern and southern hemispheres.
Go to World’s Air Pollution monitoring website to determine the real-time air quality in Madison, WI and one other place in the world.
Greenhouse Gases and Climate Change
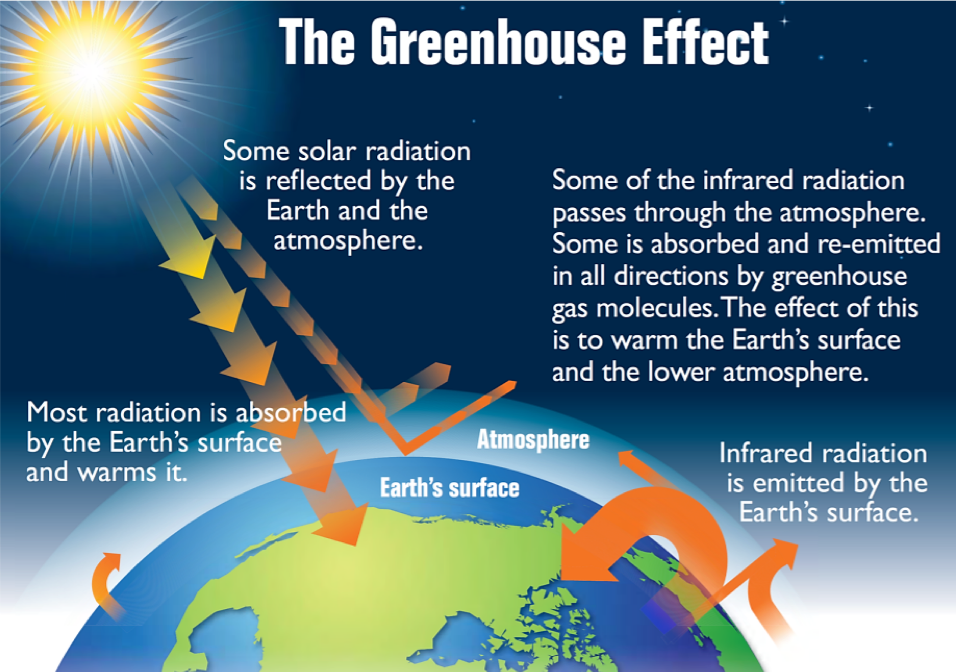
The thin skin of our atmosphere keeps the earth insulated and makes it habitable. Interestingly, this is due to less than 0.5% of the molecules that make up our atmosphere. Of the energy from the sun that reaches the earth, almost one-third is reflected back into space, with the rest absorbed by the atmosphere and the surface of the earth. Some of the energy that the earth absorbs is re-emitted as infrared (IR) radiation, a portion of which passes back out through the atmosphere into space. However, most of this IR radiation is absorbed by certain molecules in the atmosphere, known as greenhouse gases, which re-emit this energy in all directions, redirecting half of the energy back to the earth and warming the atmosphere. This trapping of heat maintains favorable living conditions—without atmosphere, the average global average temperature of 14 °C (57 °F) would be about –19 °C (–2 °F). The major greenhouse gases (GHGs) are water vapor, carbon dioxide, methane, nitrous oxide, and ozone. Since the Industrial Revolution, human activity has been increasing the concentrations of GHGs, which have changed the energy balance and are significantly altering the earth’s climate (Figure 1).
Demonstration: The greenhouse effect
Set up. In this demonstration, the container on the left is filled with CO2(g) and the container on the right is filled with plain air. These two containers are exposed to an infrared lamp (i.e., a heat lamp) and the temperature inside the container is recorded on a computer.
Prediction. Before watching the video, predict which container will have the largest increase in temperature.
Explanation. This demonstration shows that the temperature in the container with CO2(g) rises faster and more significantly than the container filled with air. The temperature increases more significantly in the left container because the CO2 absorbs and re-emits the infrared radiation from the lamp, leading to a greater temperature change.
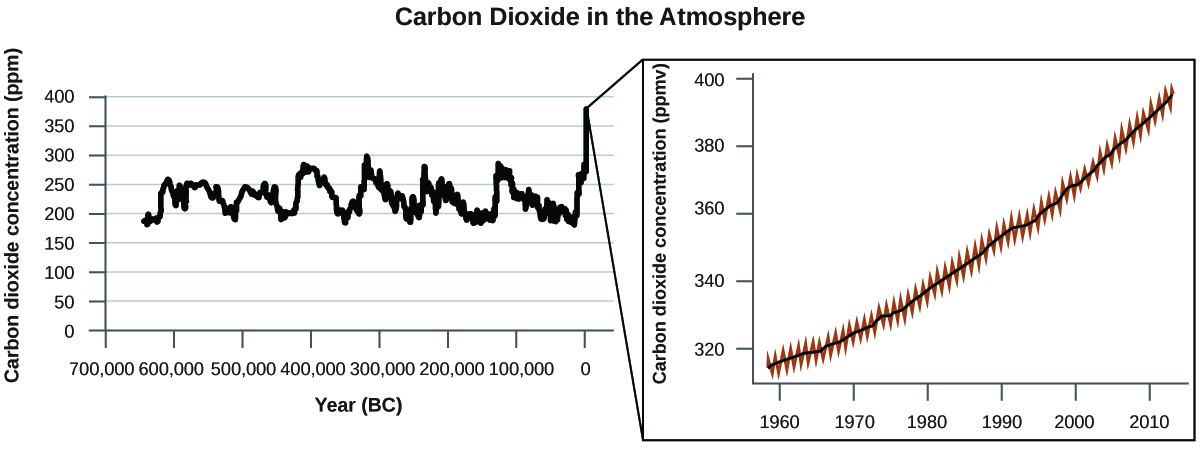
There is strong evidence from multiple sources that higher atmospheric levels of CO2 are caused by human activity, with fossil fuel burning accounting for about 75% of the recent increase in CO2. Reliable data from ice cores reveals that CO2 concentration in the atmosphere is at the highest level in the past 800,000 years; other evidence indicates that it may be at its highest level in 20 million years. In recent years, the CO2 concentration has increased from historical levels of below 300 ppm (parts per million) to almost 400 ppm (Figure 2).
Chemistry in Real Life: SAGE Program at the University of Wisconsin – Madison
The Center for Sustainability and the Global Environment (SAGE) examines the connections between natural resources, technology, policy, human health, security, and changes in the global environment. Our staff and students conduct cutting-edge research on these critical problems, and disseminate that knowledge through innovative teaching and outreach at the University of Wisconsin-Madison.
During the past half-century, human activities have changed our planet at an astonishing rate. Global population more than doubled, and food, water and fuel use increased three- to seven-fold. The results include changing climate patterns, diminishing land and freshwater resources, deteriorating air and water quality, emerging diseases, and increasing threats to human health and security. These problems will worsen unless we change global patterns and modes of resource use, and implement adaptive strategies.
To find effective solutions, we need to understand the changing relationships between human actions and Earth’s complex environmental systems. This requires interdisciplinary research that forges new links between traditional scientific fields. Positive change also requires integration of the latest science into real-world decision-making and public policy, with the ultimate goal of sustainably managing our planet’s natural resources – the air, water, land and biological diversity upon which all life depends into the future.
SAGE is a research center in the Nelson Institute for Environmental Studies at UW-Madison, with about fifty faculty, scientists, students, and staff examining cutting-edge environmental challenges and solutions. With strong collaborations and cross-fertilization both within and outside SAGE, we are able to contribute to the scientific and policy discourse on agriculture, air quality, climate, energy, public health, urban environment, and water. Our work is supported by government research grants, corporate gifts, and private funds, with results published in the academic literature and often reported in the popular press.
The research occurring at the Nelson Institute is interdisciplinary, and chemistry is central to many research questions. For example, one faculty member, Cathy Middlecamp (Figure 3) holds joint appointments in the Integrated Liberal Studies Program and is an affiliate of the Chemistry Department. Dr. Middlecamp’s scholarship lies at the intersection of science, people, and the planet.


Watch a 2-minute video explaining greenhouse gases and global warming.
Key Concepts and Summary
The earth’s atmosphere is composed mainly of nitrogen and oxygen. Other gases compose the remaining 1% of the atmosphere. To express the amounts of these scarce gases, we use the unit ppm. This unit indicates how many molecules of the gas are present per 1 million total air molecules.
The major greenhouse gases are water vapor, carbon dioxide, methane, nitrous oxide, and ozone. Human activity is leading to an increase in these greenhouse gases and causing climate change. Greenhouse gases absorb the IR radiation that is emitted from the earth and re-emit the energy in all directions, directing about half of it back toward the earth. This results in heat being trapped by the atmosphere. While this heat trapping maintains favorable living conditions—and thus some amount of greenhouse gases is necessary to sustain life—an excess concentration of greenhouse gases are causing an increase in the energy that is re-emitted toward earth, disrupting the energy balance and altering earth’s climate.
