
41 Core and Valence Electrons, Shielding, Zeff (M7Q8)
Introduction
This section continues to explore the relationship between an atom’s electron arrangement in orbitals and the chemical properties of that atom. As we move from hydrogen to multi-electron atoms there is an incredible increase in complexity due to the fact that electrons repel each other. Nonetheless, one can still understand much of the periodic table and the trends in properties of atoms and ions by using approximations that are based on using the quantum numbers of individual electrons in an atom. These properties vary periodically as the electronic structure of the elements changes. They are (1) size (radius) of atoms and ions, (2) ionization energies, and (3) electron affinities. This section will focus on the properties governing the size (radius) of atoms and ions.
Learning Objectives for Core and Valence Electrons, Shielding, Zeff
- Correlate the effective nuclear charge with selected trends in periodic properties.
| Effective Nuclear Charge (Zeff) | Shielding | Variation in Atomic Radius |
| Key Concepts and Summary | Key Equations | Glossary | End of Section Exercises |
Effective Nuclear Charge (Zeff)
For an atom or an ion with only a single electron, we can calculate the potential energy of an electron by considering only the electrostatic attraction between the positively charged nucleus and the negatively charged electron. When more than one electron is present, however, the total energy of the atom or the ion depends not only on attractive electron-nucleus interactions but also on repulsive electron-electron interactions. For example, in helium there are two electrons. From Coloumb’s law we know that there is a repulsive interaction that depends on the distance between them. In addition there are attractive interactions between each of the two electrons with the nucleus. There are no known solutions to the Schrodinger equation for this problem, so one must use approximate methods to find the orbitals and their energies.
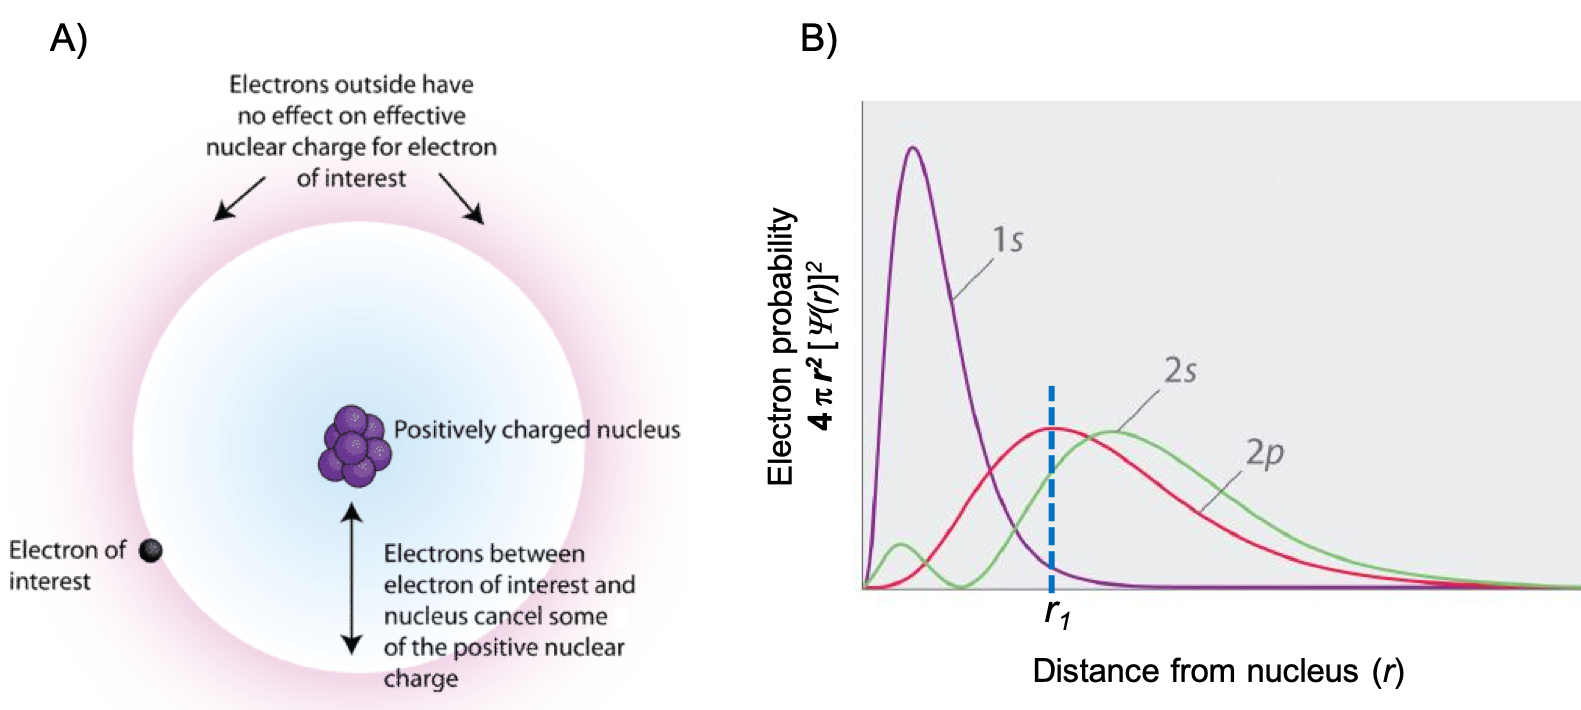
If an electron is far from the nucleus (i.e., if the distance r between the nucleus and the electron is large), then at any given moment, most of the other electrons will be between that electron and the nucleus. Hence these electrons will cancel a portion of the positive charge of the nucleus and thereby decrease the attractive interaction between the nucleus and the electron farther away. As a result, the electron farther away experiences an effective nuclear charge (Zeff). An effective nuclear charge is the nuclear charge an electron actually experiences because of shielding from other electrons closer to the nucleus (Figure 1). Consequently, the Zeff is always less than the actual nuclear charge, Z. The Zeff experienced by an electron in a given orbital depends not only on the spatial distribution of the electron in that orbital but also on the distribution of all the other electrons present.
Note that while we often refer to the Zeff of a valence electron, we can calculate the Zeff for any electron by taking into account only the number of core electrons that are shielding. For example, consider a 2s electron of Cl. For Cl, Z = 17 and the electron configuration is 1s22s22p63s23p5. The only electrons that will shield a 2s electron are the 1s electrons, and there are two of them. Therefore, Zeff = 17 – 2 = 15 for a 2s electron of Cl. The Zeff for a 3p electron, on the other hand, is Zeff = 17 – 10 = 7 because there are 10 electrons shielding the 3p electron (2 electrons in n = 1 and a total of 8 electrons in n = 2).
Variation in Atomic Radius
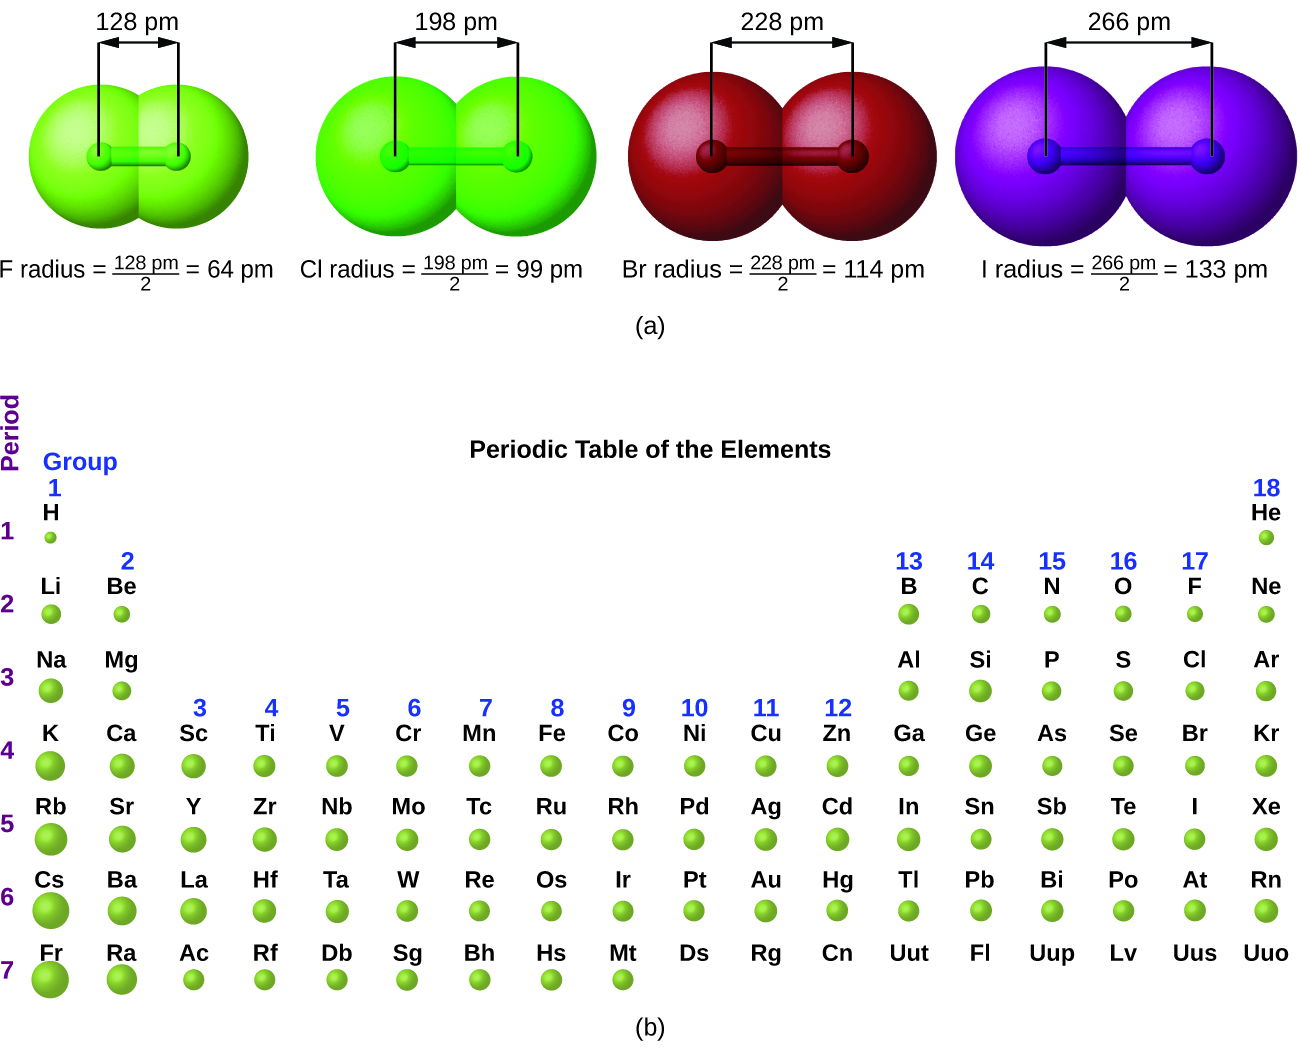
The quantum mechanical picture makes it difficult to establish a definite size of an atom. However, there are several practical ways to define the radius of atoms and, thus, to determine their relative sizes that give roughly similar values. We will use the atomic radii (Figure 2), which is defined as one-half the distance between the nuclei of two identical atoms when they are joined by a covalent bond (this measurement is possible because atoms within molecules still retain much of their atomic identity). We know that as we scan down a group, the principal quantum number, n, increases by one for each element. Thus, the electrons are being added to a region of space that is increasingly distant from the nucleus. Consequently, the size of the atom (and its atomic radius) must increase as we increase the distance of the outermost electrons from the nucleus. This trend is illustrated for the atomic radii of the halogens in Table 1 and Figure 2. The trends for the entire periodic table can be seen in Figure 2.
| Atom | Atomic radius (pm) | Nuclear charge |
|---|---|---|
| F | 64 | +9 |
| Cl | 99 | +17 |
| Br | 114 | +35 |
| I | 133 | +53 |
| At | 148 | +85 |
| Table 1. Covalent Radii of the Halogen Group Elements | ||
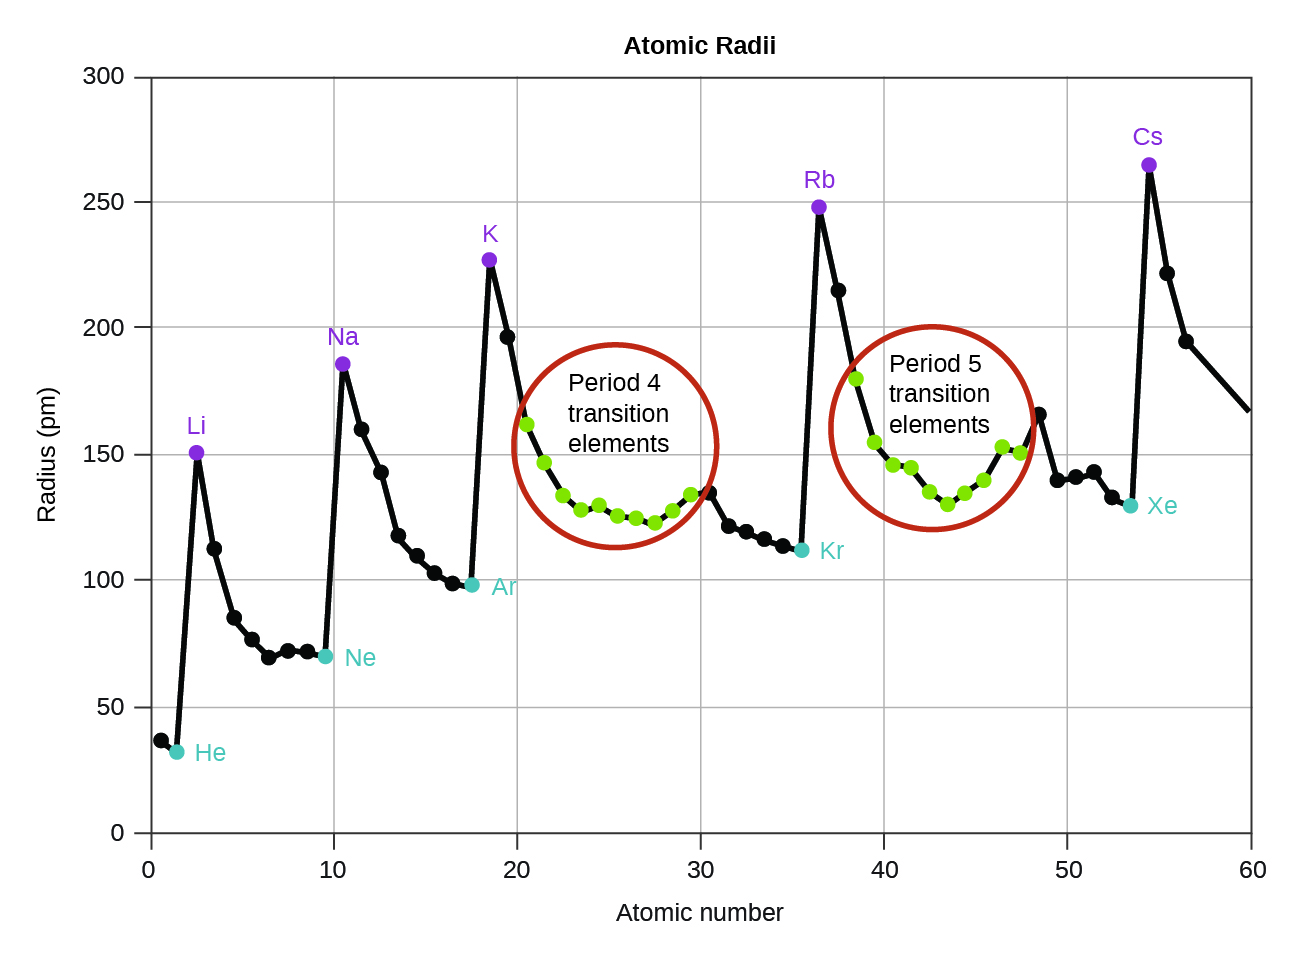
As shown in Figure 2, as we move across a period from left to right, we generally find that each element has a smaller atomic radius than the element preceding it. This is expected due to the Zeff for the valence electron increasing from left to right across a period, as we saw above. The stronger pull (higher effective nuclear charge) experienced by valence electrons on the right side of the periodic table draws them closer to the nucleus, making the atomic radii smaller.

Explore visualizations of the periodic trends discussed in this section (and many more trends). With just a few clicks, you can create three-dimensional versions of the periodic table showing atomic size or graphs of ionization energies from all measured elements.
Example 1
Sorting Atomic Radii
Predict the order of increasing atomic radius for Ge, Fl, Br, Kr.
Solution
Radius increases as we move down a group, so Ge < Fl (Note: Fl is the symbol for flerovium, element 114, NOT fluorine). Radius decreases as we move across a period, so Kr < Br < Ge. Putting the trends together, we obtain Kr < Br < Ge < Fl.
Check Your Learning
Give an example of an atom whose size is smaller than fluorine.
Answer:
Ne or He
Key Concepts and Summary
Effective nuclear charge for valence electrons increases from left to right across a period and decreases down a group. Because valence electrons are held more tightly on the right side of the Periodic Table, the atomic radius decreases. Atomic radius increases as we move down a group because the n level (orbital size) increases.
Key Equations
- Zeff = Z – S, where S is the number of core electrons
Glossary
- atomic radius
- one-half the distance between the nuclei of two identical atoms when they are joined by a covalent bond
- core electrons
- electrons occupying the inner shell orbitals
- effective nuclear charge
- charge that leads to the Coulomb force exerted by the nucleus on an electron, calculated as the nuclear charge minus shielding
- valence electrons
- electrons in the outermost or valence shell (highest value of n) of a ground-state atom; determine how an element reacts
Chemistry End of Section Exercises
- Based on their positions in the periodic table, predict which has the smallest atomic radius: Mg, Sr, Si, Cl, I.
- Based on their positions in the periodic table, predict which has the largest atomic radius: Li, Rb, N, F, I.
- Atoms of which group in the periodic table have a valence shell electron configuration of ns2np3?
- Atoms of which group in the periodic table have a valence shell electron configuration of ns2?
- Based on their positions in the periodic table, list the following atoms in order of increasing radius: Mg, Ca, Rb, Cs.
- Based on their positions in the periodic table, list the following atoms in order of increasing radius: Sr, Ca, Si, Cl.
Answers to Chemistry End of Section Exercises
- Cl
- Rb
- 15 (5A)
- 2 (2A)
- Mg < Ca < Rb < Cs
- Cl < Si < Ca < Sr
