
1 Measurements, Units, Conversions, Density (M1Q1)
Introduction
Learning Objectives for Thinking Like a Scientist:
- Differentiate between accuracy and precision; properly employ significant figures in measurements and calculations.
| Significant Figures in Measurements | Significant Figures in Calculations | Accuracy and Precision | - Identify and use the prefixes, units of measurement, and conversions in chemistry.
| Prefixes | SI Base Units | Dimensional Analysis | - Relate mass, volume, and density of a substance.
| Density | - Develop and test hypotheses.
| Data and the Scientific Method |
| Key Concepts and Summary | Key Equations | Glossary | End of Section Exercises |
Measurements
Measurements provide the macroscopic information that is the basis of most hypotheses, theories, and laws that describe the behavior of matter and energy in both the macroscopic and microscopic domains of chemistry. Every measurement provides three kinds of information: the size or magnitude of the measurement (a number); a standard of comparison for the measurement (a unit); and an indication of the uncertainty of the measurement. While the number and unit are explicitly represented when a quantity is written, the uncertainty is an aspect of the measurement result that is more implicitly represented and will be discussed later.
The number in the measurement can be represented in different ways, including decimal form and scientific notation. (Scientific notation is also known as exponential notation; a review of this topic can be found in Appendix B). For example, the maximum takeoff weight of a Boeing 777-200ER airliner is 298,000 kilograms, which can also be written as 2.98 × 10⁵ kg. The average mass of a mosquito is about 0.0000025 kilograms, which can be written as 2.5 × 10⁻⁶ kg.
Units, such as liters, pounds, and centimeters, are standards of comparison for measurements. When we buy a 2 liter bottle of a soft drink, we expect that the volume of the drink was measured, so it is two times larger than the volume that everyone agrees to be 1 liter. The meat used to prepare a 0.25 pound hamburger is measured so it weighs one-fourth as much as 1 pound. Without units, a number can be meaningless, confusing, or possibly life threatening. Suppose a doctor prescribes phenobarbital to control a patient’s seizures and states a dosage of “100” without specifying units. Not only will this be confusing to the medical professional giving the dose, but the consequences can be dire: 100 mg given three times per day can be effective as an anticonvulsant, but a single dose of 100 g is more than 10 times the lethal amount.
We usually report the results of scientific measurements in SI units, an updated version of the metric system, using the units listed in Table 1. Other units can be derived from these base units. The standards for these units are fixed by international agreement, and they are called the International System of Units or SI Units (from the French, Le Système International d’Unités). SI units have been used by the United States National Institute of Standards and Technology (NIST) since 1964.
| Property Measured | Name of Unit | Symbol of Unit |
|---|---|---|
| length | meter | m |
| mass | kilogram | kg |
| time | second | s |
| temperature | kelvin | K |
| electric current | ampere | A |
| amount of substance | mole | mol |
| luminous intensity | candela | cd |
| Table 1. Base Units of the SI System | ||
Sometimes we use units that are fractions or multiples of a base unit. Ice cream is sold in quarts (a familiar, non-SI base unit), pints (0.5 quart), or gallons (4 quarts). We also use fractions or multiples of units in the SI system, but these fractions or multiples are always powers of 10. Fractional or multiple SI units are named using a prefix and the name of the base unit. For example, a length of 1000 meters is also called a kilometer because the prefix kilo means “one thousand,” which in scientific notation is 103 (1 kilometer = 1000 m = 103 m). The prefixes used and the powers to which 10 are raised are listed in Table 2.

Need a refresher or more practice with scientific notation? Visit this site to go over basics of scientific notation.
SI Base Units
The initial units of the metric system, which eventually evolved into the SI system, were established in France during the French Revolution. The original standards for the meter and the kilogram were adopted there in 1799 and eventually by other countries. This section introduces four of the SI base units commonly used in chemistry. Other SI units will be introduced in subsequent chapters.
Length
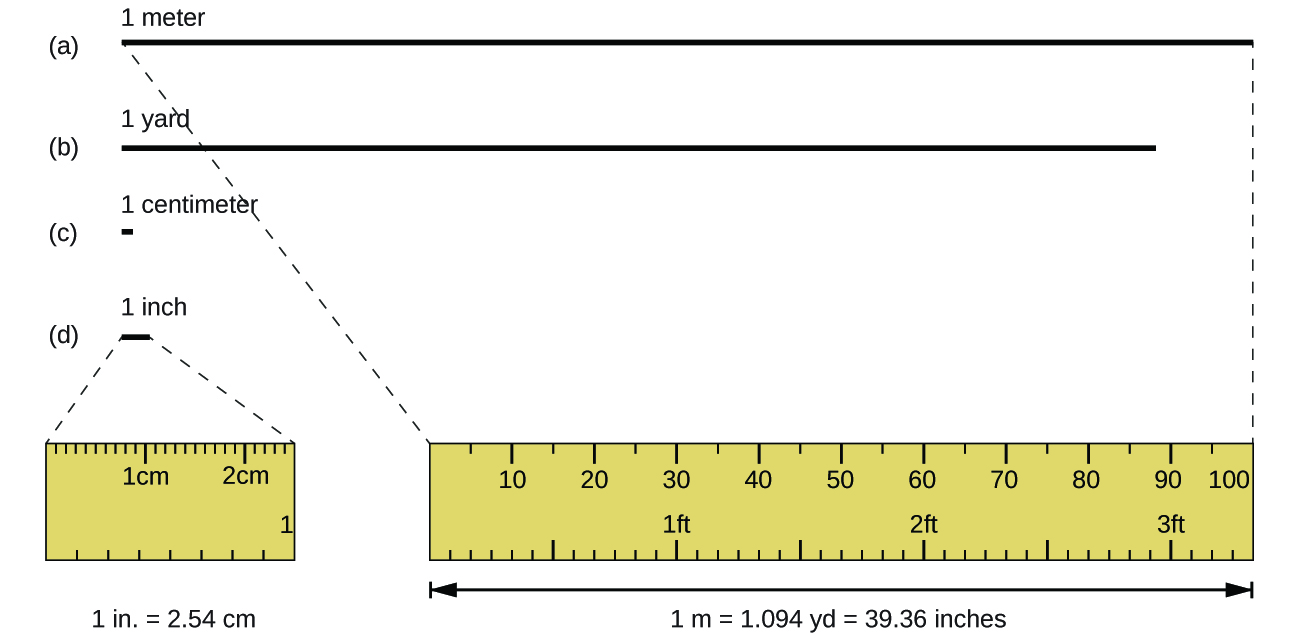
The standard unit of length in both the SI and original metric systems is the meter (m). A meter was originally specified as 1/10,000,000 of the distance from the North Pole to the equator. It is now defined as the distance light in a vacuum travels in 1/299,792,458 of a second. A meter is about 3 inches longer than a yard (Figure 1); one meter is about 39.37 inches or 1.094 yards. Longer distances are often reported in kilometers (1 km = 1000 m = 103 m), whereas shorter distances can be reported in centimeters (1 cm = 0.01 m = 10−2 m) or millimeters (1 mm = 0.001 m = 10−3 m).
Mass
The standard unit of mass in the SI system is the kilogram (kg). A kilogram was originally defined as the mass of a liter of water (a cube of water with an edge length of exactly 0.1 meter). Until May 2019, the kilogram was defined by a certain cylinder of platinum-iridium alloy, which is kept in France. Any object with the same mass as this cylinder was said to have a mass of 1 kilogram. One kilogram is about 2.2 pounds. The gram (g) is exactly equal to 1/1000 of the mass of the kilogram (10−3 kg). Currently, the kilogram is defined in quantum mechanical terms based on Plank's constant. Learn about the latest definition of the kilogram.
Temperature
Temperature is an intensive property. The SI unit of temperature is the kelvin (K). The IUPAC convention is to use kelvin (all lowercase) for the word, K (uppercase) for the unit symbol, and neither the word “degree” nor the degree symbol (°). The degree Celsius (°C) is also allowed in the SI system, with both the word “degree” and the degree symbol used for Celsius measurements. Celsius degrees are the same magnitude as those of kelvin, but the two scales place their zeros in different places. Water freezes at 273.15 K (0 °C) and boils at 373.15 K (100 °C) by definition, and normal human body temperature is approximately 310 K (37 °C).
Conversion of Temperature Units
We use the word temperature to refer to the hotness or coldness of a substance. One way we measure a change in temperature is to use the fact that most substances expand when their temperature increases and contract when their temperature decreases. The mercury or alcohol in a common glass thermometer changes its volume as the temperature changes. Because the volume of the liquid changes more than the volume of the glass, we can see the liquid expand when it gets warmer and contract when it gets cooler.
Unlike the Celsius scale, the kelvin scale is an absolute temperature scale in which 0 (zero) K corresponds to the lowest temperature that can theoretically be achieved. The early 19th-century discovery of the relationship between a gas's volume and temperature suggested that the volume of a gas would be zero at −273.15 °C. In 1848, British physicist William Thompson, who later adopted the title of Lord Kelvin, proposed an absolute temperature scale based on this concept (further treatment of this topic is provided later in the Gases Module).
The freezing temperature of water on this scale is 273.15 K and its boiling temperature 373.15 K. Notice the numerical difference in these two reference temperatures is 100, the same as for the Celsius scale, and so the linear relation between these two temperature scales will exhibit a slope of 1 [latex]\frac{\text{K}}{^{\circ}\text{C}}[/latex]. Following the same approach, the equations for converting between the kelvin and Celsius temperature scales are derived to be:
The 273.15 in these equations has been determined experimentally, so it is not exact. Figure 2 shows the relationship among the three temperature scales. Recall that we do not use the degree sign with temperatures on the kelvin scale.
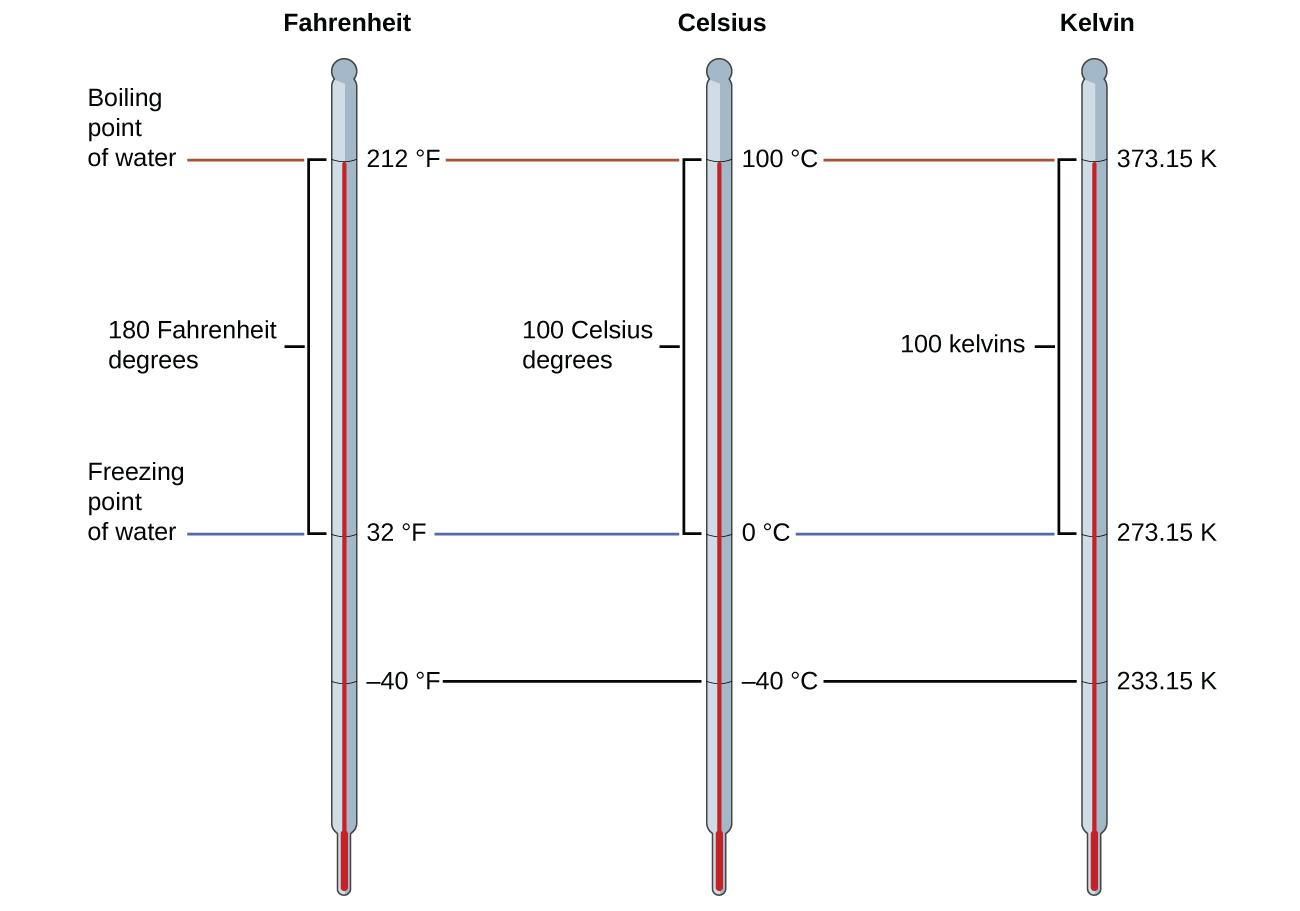
Although the kelvin (absolute) temperature scale is the official SI temperature scale, Celsius is commonly used in many scientific contexts and is the scale of choice for nonscience contexts in almost all areas of the world. Very few countries (the U.S. and its territories, the Bahamas, Belize, Cayman Islands, and Palau) still use Fahrenheit for weather, medicine, and cooking.
Example 1
Conversion from Celsius
Normal body temperature has been commonly accepted as 37.0 °C (although it varies depending on time of day and method of measurement, as well as among individuals). What is this temperature on the kelvin scale and on the Fahrenheit scale?
Solution
Check Your Learning
Convert 80.92 °C to K.
Answer:
354.07 K
Time
The SI base unit of time is the second (s). Small and large time intervals can be expressed with the appropriate prefixes; for example, 3 microseconds = 0.000003 s = 3 × 10⁻⁶ s and 5 megaseconds = 5,000,000 s = 5 × 10⁶ s. Alternatively, hours, days, and years can be used.
Derived SI Units
We can derive many units from the seven SI base units. For example, we can use the base unit of length to define a unit of volume, and the base units of mass and length to define a unit of density.
Volume
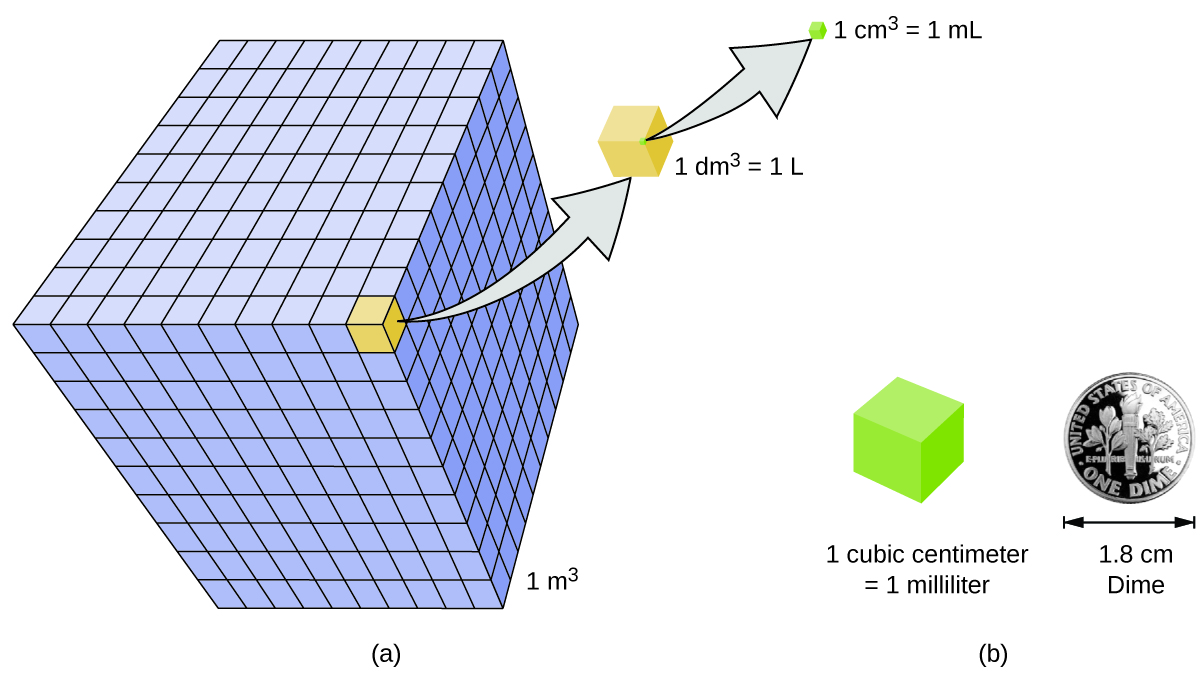
Volume is the measure of the amount of space occupied by an object. The standard SI unit of volume is defined by the base unit of length (Figure 3). The standard volume is a cubic meter (m3), a cube with an edge length of exactly one meter. To dispense a cubic meter of water, we could build a cubic box with edge lengths of exactly one meter. This box would hold a cubic meter of water or any other substance.
A more commonly used unit of volume is derived from the decimeter (0.1 m, or 10 cm). A cube with edge lengths of exactly one decimeter contains a volume of one cubic decimeter (dm3). A liter (L) is the more common name for the cubic decimeter. One liter is about 1.06 quarts.
A cubic centimeter (cm3) is the volume of a cube with an edge length of exactly one centimeter. The abbreviation cc (for cubic centimeter) is often used by health professionals. A cubic centimeter is also called a milliliter (mL) and is 1/1000 of a liter.
Density
We use the mass and volume of a substance to determine its density. Thus, the units of density are defined by the base units of mass and length.
The density of a substance is the ratio of the mass of a sample of the substance to its volume (mass/volume). The SI unit for density is the kilogram per cubic meter (kg/m3). For many situations, however, this is an inconvenient unit, so we often use grams per cubic centimeter (g/cm3) for the densities of solids and liquids, and grams per liter (g/L) for gases. Although there are exceptions, most liquids and solids have densities that range from about 0.7 g/cm3 (the density of gasoline) to 19 g/cm3 (the density of gold). The density of air is about 1.2 g/L. Table 3 shows the densities of some common substances.
| Solids | Liquids | Gases (at 25 °C and 1 atm) |
|---|---|---|
| ice (at 0 °C) 0.92 g/cm3 | water 1.0 g/cm3 | dry air 1.20 g/L |
| oak (wood) 0.60–0.90 g/cm3 | ethanol 0.79 g/cm3 | oxygen 1.31 g/L |
| iron 7.9 g/cm3 | acetone 0.79 g/cm3 | nitrogen 1.14 g/L |
| copper 9.0 g/cm3 | glycerin 1.26 g/cm3 | carbon dioxide 1.80 g/L |
| lead 11.3 g/cm3 | olive oil 0.92 g/cm3 | helium 0.16 g/L |
| silver 10.5 g/cm3 | gasoline 0.70–0.77 g/cm3 | neon 0.83 g/L |
| gold 19.3 g/cm3 | mercury 13.6 g/cm3 | radon 9.1 g/L |
| Table 3. Densities of Common Substances | ||
While there are many ways to determine the density of an object, perhaps the most straightforward method involves separately finding the mass and volume of the object, and then dividing the mass of the sample by its volume. In the following example, the mass is found directly by weighing, but the volume is found indirectly through length measurements.
Example 2
Calculation of Density
Gold—in bricks, bars, and coins—has been a form of currency for centuries. In order to swindle people into paying for a brick of gold without actually investing in a brick of gold, people have considered filling the centers of hollow gold bricks with lead to fool buyers into thinking that the entire brick is gold. It does not work: lead is a dense substance, but its density is not as great as that of gold, 19.3 g/cm3. What is the density of lead if a cube of lead has an edge length of 2.00 cm and a mass of 90.7 g?
Solution
The density of a substance can be calculated by dividing its mass by its volume. The volume of a cube is calculated by cubing the edge length.
volume of lead cube = 2.00 cm × 2.00 cm × 2.00 cm = 8.00 cm3
density = [latex]\frac{\text{mass}}{\text{volume}}[/latex] = [latex]\frac{90.7\;\text{g}}{8.00\;\text{cm}^3}[/latex] = [latex]\frac{11.3\;\text{g}}{1.00\;\text{cm}^3}[/latex] = 11.3 g/cm3
(We will discuss the reason for rounding to the first decimal place in the next section.)
Check Your Learning
(a) To three decimal places, what is the volume of a cube (cm3) with an edge length of 0.843 cm?
(b) If the cube in part (a) is copper and has a mass of 5.34 g, what is the density of copper to two decimal places?
Answer:
(a) 0.599 cm3 (b) 8.91 g/cm3
Accuracy and Precision
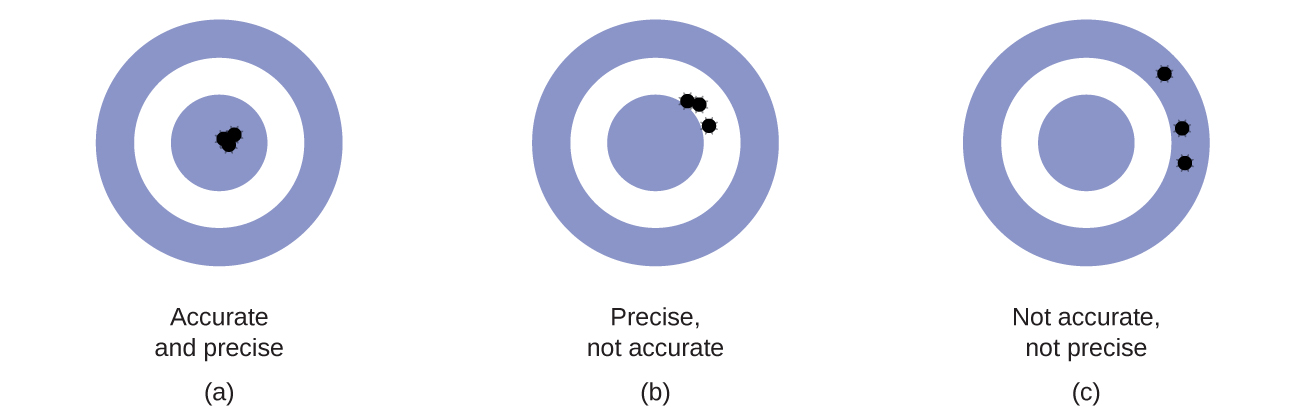
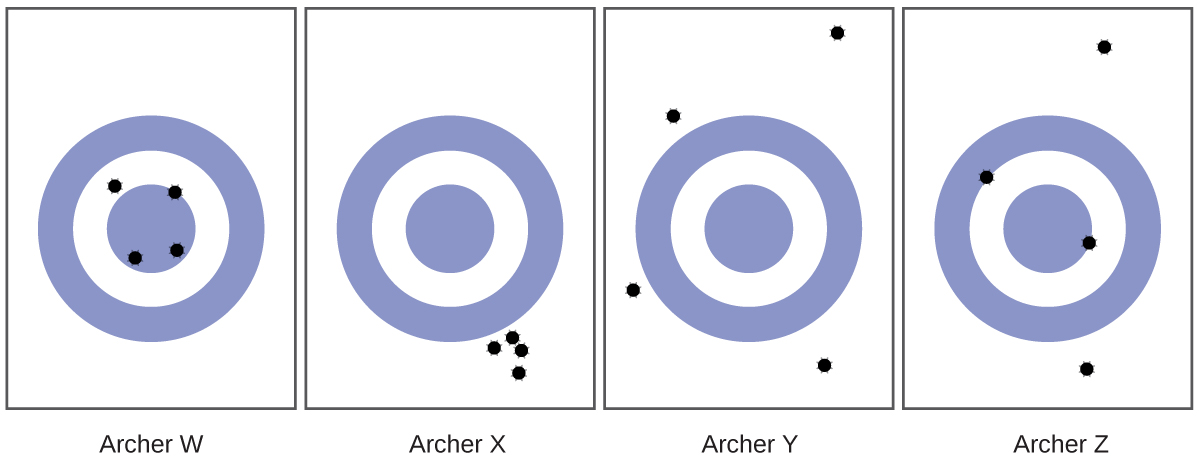
Scientists typically make repeated measurements of a quantity to ensure the quality of their findings and to know both the precision and the accuracy of their results. Measurements are said to be precise if they yield very similar results when repeated in the same manner. A measurement is considered accurate if it yields a result that is very close to the true or accepted value. Precise values agree with each other; accurate values agree with a true value. These characterizations can be extended to other contexts, such as the results of an archery competition (Figure 4).
Counting is the only type of measurement that is free from uncertainty, provided the number of objects being counted is not extremely large. The result of such a counting measurement is an example of an exact number. If we count eggs in a carton, we know exactly how many eggs the carton contains. The numbers of defined quantities are also exact. By definition, 1 foot is exactly 12 inches, 1 inch is exactly 2.54 centimeters, and 1 gram is exactly 0.001 kilogram. Quantities derived from measurements other than counting, however, are uncertain to varying extents due to practical limitations of the measurement process used.
Significant Figures in Measurements
Measured quantities, unlike defined or directly counted quantities, are not exact. In the laboratory, you will need to understand the limitations of the measuring devices you will use, such as balances and graduated cylinders. For example, when measuring the volume of liquid in a graduated cylinder, you should make a reading at the bottom of the meniscus, the lowest point on the curved surface of the liquid.
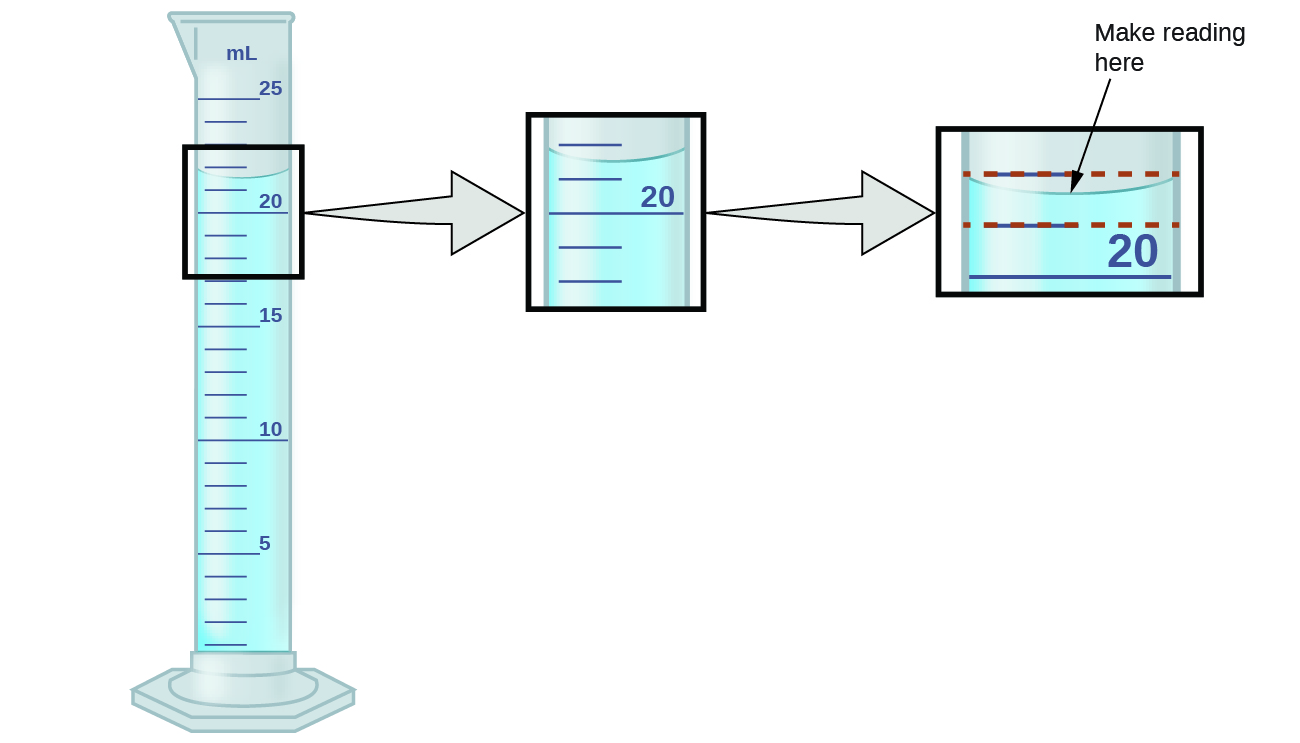
Refer to the illustration in Figure 5. The bottom of the meniscus in this case clearly lies between the 21 and 22 markings, meaning the liquid volume is certainly greater than 21 mL but less than 22 mL. The meniscus appears to be a bit closer to the 22-mL mark than to the 21-mL mark, and so a reasonable estimate of the liquid’s volume would be 21.6 mL. In the number 21.6, then, the digits 2 and 1 are certain, but the 6 is an estimate. Some people might estimate the meniscus position to be equally distant from each of the markings and estimate the tenth-place digit as 5, while others may think it to be even closer to the 22-mL mark and estimate the tenth-place digit to be 7. Note that it would be pointless to attempt to estimate a digit for the hundredths place, given that the tenths-place digit is uncertain. In general, numerical scales such as the one on this graduated cylinder will permit measurements to one-tenth of the smallest scale division. The scale in this case has 1-mL divisions, and so volumes may be measured to the nearest 0.1 mL.
This concept holds true for all measurements, even if you do not actively make an estimate. If you place a quarter on a standard electronic balance, you may obtain a reading of 6.72 g. The digits 6 and 7 are certain, and the 2 indicates that the mass of the quarter is likely between 6.71 and 6.73 grams. The quarter weighs about 6.72 grams, with a nominal uncertainty in the measurement of ± 0.01 gram. If we weigh the quarter on a more sensitive balance, we may find that its mass is 6.723 g. This means its mass lies between 6.722 and 6.724 grams, an uncertainty of 0.001 gram. Every measurement has some uncertainty, which depends on the device used (and the user’s ability). All of the digits in a measurement, including the uncertain last digit, are called significant figures or significant digits. Note that zero may be a measured value; for example, if you stand on a scale that shows weight to the nearest pound and it shows “120,” then the 1 (hundreds), 2 (tens) and 0 (ones) are all significant (measured) values.
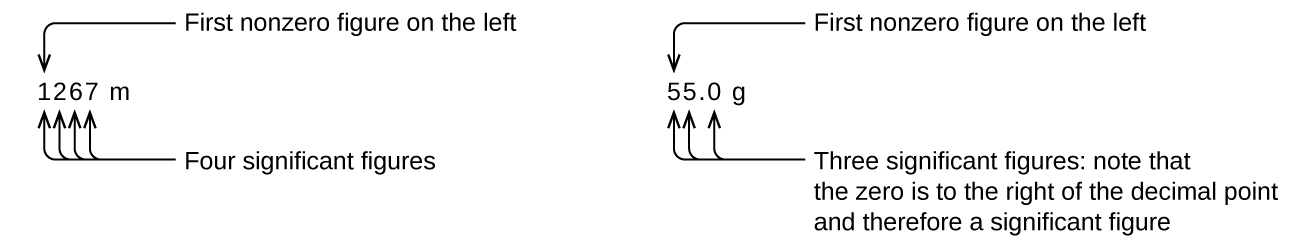
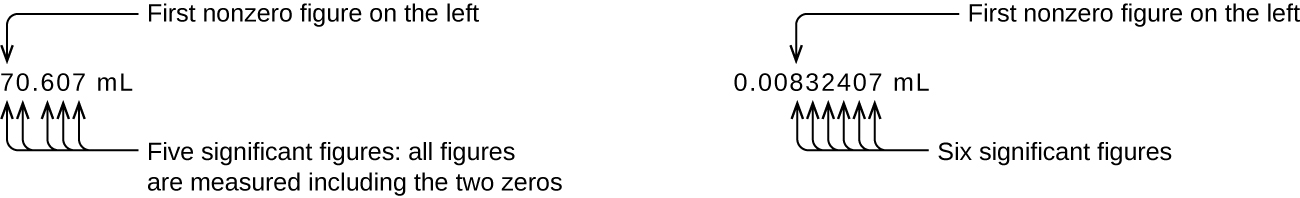
Whenever you make a measurement properly, all the digits in the result are significant. But what if you were analyzing a reported value and trying to determine what is significant and what is not? Well, for starters, all nonzero digits are significant, and it is only zeros that require some thought. We will use the terms “leading,” “trailing,” and “captive” for the zeros of a value and will consider how to deal with them.
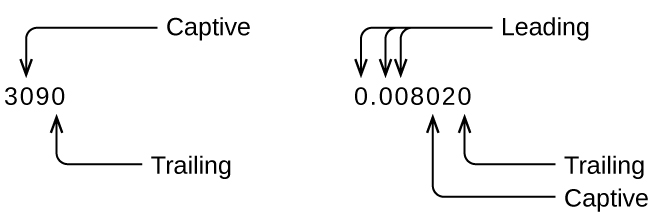
Starting with the first nonzero digit on the left, count this digit and all remaining digits to the right. This is the number of significant figures in the measurement unless the last digit is a trailing zero lying to the left of the decimal point.
Captive zeros result from measurement and are therefore always significant. Leading zeros, however, are never significant—they merely tell us where the decimal point is located.
The leading zeros in this example are not significant. We could use exponential notation (as described in Appendix B) and express the number as 8.32407 × 10⁻³; then the number 8.32407 contains all of the significant figures, and 10−3 locates the decimal point.
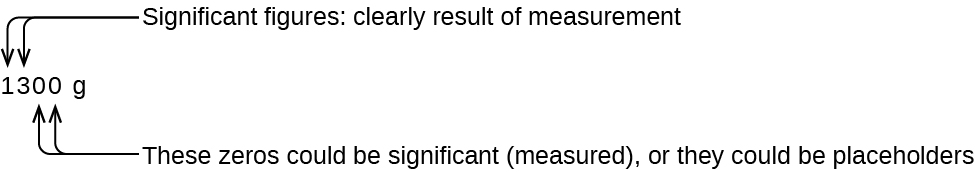
The number of significant figures is uncertain in a number that ends with a zero to the left of the decimal point location. The zeros in the measurement 1,300 grams could be significant or they could simply indicate where the decimal point is located. The ambiguity can be resolved with the use of exponential notation: 1.3 × 10³ (two significant figures), 1.30 × 10³ (three significant figures, if the tens place was measured), or 1.300 × 10³ (four significant figures, if the ones place was also measured). In cases where only the decimal-formatted number is available, it is prudent to assume that all trailing zeros are not significant.
When determining significant figures, be sure to pay attention to reported values and think about the measurement and significant figures in terms of what is reasonable or likely when evaluating whether the value makes sense. For example, the official January 2014 census reported the resident population of the US as 317,297,725. Do you think the US population was correctly determined to the reported nine significant figures, that is, to the exact number of people? People are constantly being born, dying, or moving into or out of the country, and assumptions are made to account for the large number of people who are not actually counted. Because of these uncertainties, it might be more reasonable to expect that we know the population to within perhaps a million or so, in which case the population should be reported as 3.17 × 10⁸ people.
Significant Figures in Calculations
A second important principle of uncertainty is that results calculated from a measurement are at least as uncertain as the measurement itself. We must take the uncertainty in our measurements into account to avoid misrepresenting the uncertainty in calculated results. One way to do this is to report the result of a calculation with the correct number of significant figures, which is determined by the following three rules for rounding numbers:
- When we add or subtract numbers, we should round the result to the same number of decimal places as the number with the least number of decimal places (the least precise value in terms of addition and subtraction).
- When we multiply or divide numbers, we should round the result to the same number of digits as the number with the least number of significant figures (the least precise value in terms of multiplication and division).
- If the digit to be dropped (the one immediately to the right of the digit to be retained) is less than 5, we “round down” and leave the retained digit unchanged; if it is more than 5, we “round up” and increase the retained digit by 1; if the dropped digit is 5, we round up or down, whichever yields an even value for the retained digit. (The last part of this rule may strike you as a bit odd, but it’s based on reliable statistics and is aimed at avoiding any bias when dropping the digit “5,” since it is equally close to both possible values of the retained digit.)
The following examples illustrate the application of this rule in rounding a few different numbers to three significant figures:
- 0.028675 rounds “up” to 0.0287 (the dropped digit, 7, is greater than 5)
- 18.3384 rounds “down” to 18.3 (the dropped digit, 3, is less than 5)
- 6.8752 rounds “up” to 6.88 (the dropped digit is 5, and the retained digit is even)
- 92.85 rounds “down” to 92.8 (the dropped digit is 5, and the retained digit is even)
Let’s work through these rules with a few examples.
Example 3
Rounding Numbers
Round the following to the indicated number of significant figures:
(a) 31.57 (to two significant figures)
(b) 8.1649 (to three significant figures)
(c) 0.051065 (to four significant figures)
(d) 0.90275 (to four significant figures)
Solution
(a) 31.57 rounds “up” to 32 (the dropped digit is 5, and the retained digit is even)
(b) 8.1649 rounds “down” to 8.16 (the dropped digit, 4, is less than 5)
(c) 0.051065 rounds “down” to 0.05106 (the dropped digit is 5, and the retained digit is even)
(d) 0.90275 rounds “up” to 0.9028 (the dropped digit is 5, and the retained digit is even)
Check Your Learning
Round the following to the indicated number of significant figures:
(a) 0.424 (to two significant figures)
(b) 0.0038661 (to three significant figures)
(c) 421.25 (to four significant figures)
(d) 28,683.5 (to five significant figures)
Answer:
(a) 0.42; (b) 0.00387; (c) 421.2; (d) 28,684
Example 4
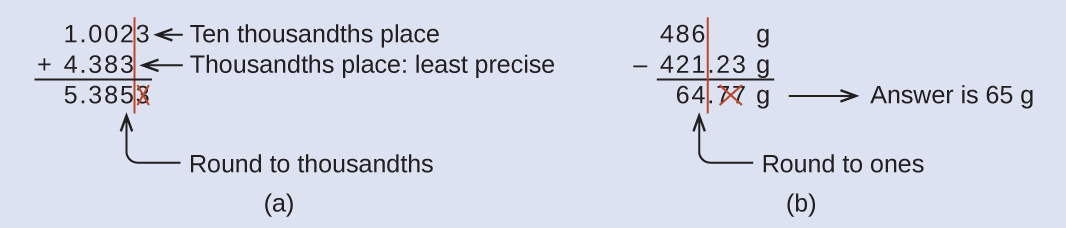
Addition and Subtraction with Significant Figures
Rule: When we add or subtract numbers, we should round the result to the same number of decimal places as the number with the least number of decimal places (i.e., the least precise value in terms of addition and subtraction).
(a) Add 1.0023 g and 4.383 g.
(b) Subtract 421.23 g from 486 g.
Solution
(a) [latex]\displaystyle \begin{array}{r}1.0023 \text{g} \\ +4.383 \;\;\text{g} \\ \hline 5.3853 \text{g} \end{array}[/latex]
Answer is 5.385 g (round to the thousandths place; three decimal places)
(b) [latex]\displaystyle \begin{array}{r}486 \;\;\;\;\; \text{g} \\ -421.23 \text{g} \\ \hline 64.77 \text{g} \end{array}[/latex]
Answer is 65 g (round to the ones place; no decimal places)
Check Your Learning
(a) Add 2.334 mL and 0.31 mL.
(b) Subtract 55.8752 m from 56.533 m.
Answer:
(a) 2.64 mL; (b) 0.658 m
Example 5
Multiplication and Division with Significant Figures
Rule: When we multiply or divide numbers, we should round the result to the same number of digits as the number with the least number of significant figures (the least precise value in terms of multiplication and division).
(a) Multiply 0.6238 cm by 6.6 cm.
(b) Divide 421.23 g by 486 mL.
Solution
(a) 0.6238 cm × 6.6 cm = 4.11708 cm2
→ result is 4.1 cm2 (round to two significant figures)
four significant figures × two significant figures
→ two significant figures in answer
(b) [latex]\frac{421.23\;\text{g}}{486\;\text{mL}}[/latex] = 0.86728 g/mL
→ result is 0.867 g/mL (round to three significant figures)
[latex]\frac{\text{five significant figures}}{\text{three significant figures}}[/latex] → three significant figures in answer
Check Your Learning
(a) Multiply 2.334 cm and 0.320 cm.
(b) Divide 55.8752 m by 56.53 s.
Answer:
(a) 0.747 cm2 (b) 0.9884 m/s
In the midst of all these technicalities, it is important to keep in mind the reason why we use significant figures and rounding rules—to correctly represent the certainty of the values we report and to ensure that a calculated result is not represented as being more certain than the least certain value used in the calculation.
Quantities can be exact or measured. Measured quantities have an associated uncertainty that is represented by the number of significant figures in the measurement. The uncertainty of a calculated value depends on the uncertainties in the values used in the calculation and is reflected in how the value is rounded. Measured values can be accurate (close to the true value) and/or precise (showing little variation when measured repeatedly).
Example 6
Calculation of Volume and Density with Significant Figures
One common bathtub is 13.44 dm long, 5.920 dm wide, and 2.54 dm deep. Assume that the tub is rectangular and calculate its approximate volume in liters.
Solution
= 13.44 dm × 5.920 dm × 2.54 dm
= 202.09459 dm3 (value from calculator)
= 202 dm3 or 202 L (answer rounded to three significant figures)
Check Your Learning
What is the density of a liquid with a mass of 31.1415 g and a volume of 30.13 cm3?
Answer:
1.034 g/mL
Example 7
Experimental Determination of Density Using Water Displacement
A piece of rebar is weighed and then submerged in a graduated cylinder partially filled with water, with results as shown.
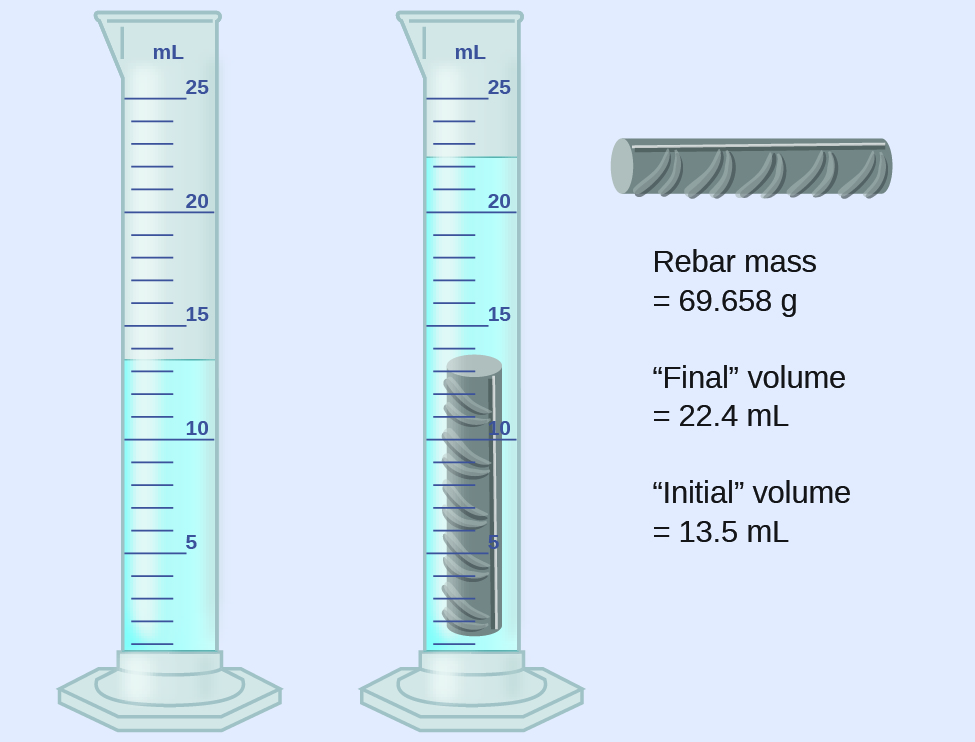
(a) Use these values to determine the density of this piece of rebar.
(b) Rebar is mostly iron. Does your result in (a) support this statement? How?
Solution
The volume of the piece of rebar is equal to the volume of the water displaced:
(rounded to the nearest 0.1 mL, per the rule for addition and subtraction)
The density is the mass-to-volume ratio:
(rounded to two significant figures, per the rule for multiplication and division)
The density of iron is 7.9 g/cm3, very close to that of rebar, which lends some support to the fact that rebar is mostly iron.
Check Your Learning
An irregularly shaped piece of a shiny yellowish material is weighed and then submerged in a graduated cylinder, with results as shown.
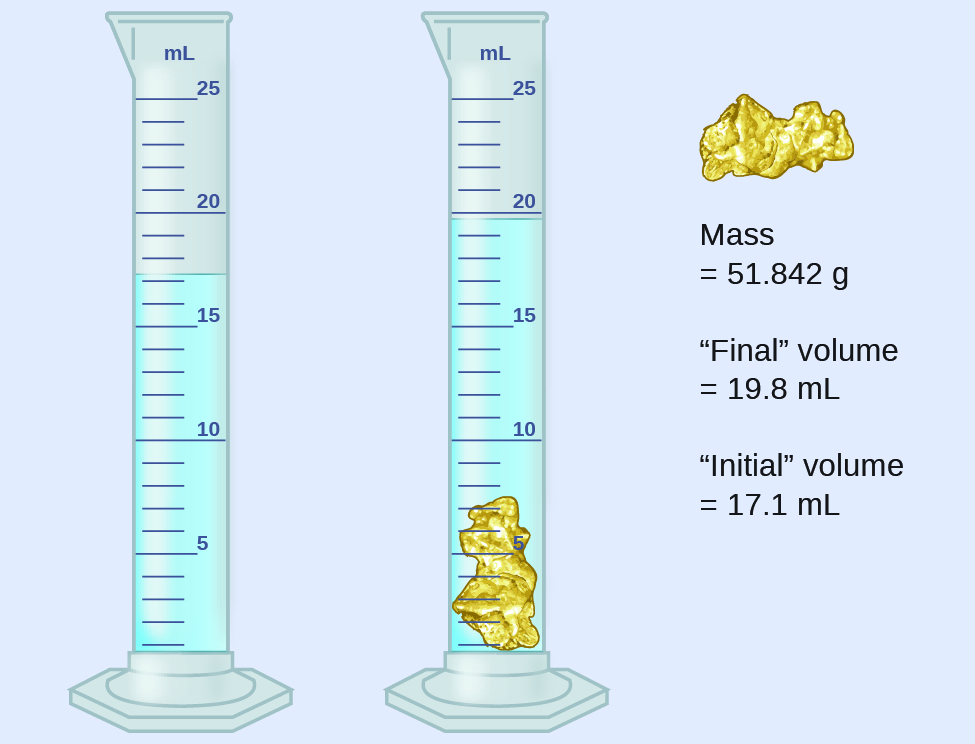
(a) Use these values to determine the density of this material.
(b) Do you have any reasonable guesses as to the identity of this material? Explain your reasoning.
Answer:
(a) 19 g/cm3; (b) It is likely gold because it has the right appearance for gold and is very close to the density given for gold in Table 3.
Intensive and Extensive Properties
Properties of matter fall into one of two categories. If the property depends on the amount of matter present, it is an extensive property. The mass and volume of a substance are examples of extensive properties; for instance, a gallon of milk has a larger mass and volume than a cup of milk. The value of an extensive property is directly proportional to the amount of matter in question. If the property of a sample of matter does not depend on the amount of matter present, it is an intensive property. Temperature is an example of an intensive property. If the gallon and cup of milk are each at 20 °C (room temperature), when they are combined, the temperature remains at 20 °C. As another example, consider the distinct but related properties of heat and temperature. A drop of hot cooking oil spattered on your arm causes brief, minor discomfort, whereas a pot of hot oil yields severe burns. Both the drop and the pot of oil are at the same temperature (an intensive property), but the pot clearly contains much more heat (extensive property).
Dimensional Analysis
It is often the case that a quantity of interest may not be easy (or even possible) to measure directly but instead must be calculated from other directly measured properties and appropriate mathematical relationships. For example, consider measuring the average speed of an athlete running sprints. This is typically accomplished by measuring the time required for the athlete to run from the starting line to the finish line, and the distance between these two lines, and then computing speed from the equation that relates these three properties:
speed = [latex]\frac{\text{distance}}{\text{time}}[/latex]
An Olympic-quality sprinter can run 100 m in approximately 10 s, corresponding to an average speed of
[latex]\frac{\text{100 m}}{\text{10 s}}[/latex] = 10 m/s
Note that this simple arithmetic involves dividing the numbers of each measured quantity to yield the number of the computed quantity (100/10 = 10) and likewise dividing the units of each measured quantity to yield the unit of the computed quantity (m/s = m/s). Now, consider using this same relation to predict the time required for a person running at this speed to travel a distance of 25 m. The same relation between the three properties is used, but in this case, the two quantities provided are a speed (10 m/s) and a distance (25 m). To yield the sought property, time, the equation must be rearranged appropriately:
The time can then be computed as:
Again, arithmetic on the numbers (25/10 = 2.5) was accompanied by the same arithmetic on the units (m/m/s = s) to yield the number and unit of the result, 2.5 s. Note that, just as for numbers, when a unit is divided by an identical unit (in this case, m/m), the result is “1”—or, as commonly phrased, the units “cancel.”
These calculations are examples of a versatile mathematical approach known as dimensional analysis (or the factor-label method). Dimensional analysis is based on this premise: the units of quantities must be subjected to the same mathematical operations as their associated numbers. This method can be applied to computations ranging from simple unit conversions to more complex, multi-step calculations involving several different quantities.
Conversion Factors and Dimensional Analysis
A ratio of two equivalent quantities expressed with different measurement units can be used as a unit conversion factor. For example, the lengths of 2.54 cm and 1 in. are equivalent (by definition), and so a unit conversion factor may be derived from the ratio,
[latex]\frac{\text{2.54 cm}}{\text{1 in.}}[/latex] (2.54 cm = 1 in.) or 2.54 [latex]\frac{\text{cm}}{\text{in}}[/latex] = 2.54
Several other commonly used conversion factors are given in Table 4.
| Length | Volume | Mass |
|---|---|---|
| 1 m = 1.0936 yd | 1 L = 1.0567 qt | 1 kg = 2.2046 lb |
| 1 in. = 2.54 cm (exact) | 1 qt = 0.94635 L | 1 lb = 453.59 g |
| 1 km = 0.62137 mi | 1 ft3 = 28.317 L | 1 (avoirdupois) oz = 28.349 g |
| 1 mi = 1609.3 m | 1 tbsp = 14.787 mL | 1 (troy) oz = 31.103 g |
| Table 4. Common Conversion Factors | ||
When we multiply a quantity (such as distance given in inches) by an appropriate unit conversion factor, we convert the quantity to an equivalent value with different units (such as distance in centimeters). For example, a basketball player’s vertical jump of 34 inches can be converted to centimeters by:
34 in. × [latex]\frac{\text{2.54 cm}}{\text{1}\rule[0.5ex]{1em}{0.1ex}\hspace{-1em}\text{ in.}}[/latex] = 86 cm
Since this simple arithmetic involves quantities, the premise of dimensional analysis requires that we multiply both numbers and units. The numbers of these two quantities are multiplied to yield the number of the product quantity, 86, whereas the units are multiplied to yield [latex]\frac{\text{in.} \times \text{cm}}{\text{in.}}[/latex]. Just as for numbers, a ratio of identical units is also numerically equal to one, [latex]\frac{\text{in.}}{\text{in.}}[/latex] = 1, and the unit product thus simplifies to cm. (When identical units divide to yield a factor of 1, they are said to “cancel.”) Using dimensional analysis, we can determine that a unit conversion factor has been set up correctly by checking to confirm that the original unit will cancel, and the result will contain the sought (converted) unit.
Example 8
Using a Unit Conversion Factor
The mass of a competition frisbee is 125 g. Convert its mass to ounces using the unit conversion factor derived from the relationship 1 oz = 28.349 g (Table 4).
Solution
If we have the conversion factor, we can determine the mass in kilograms using an equation similar the one used for converting length from inches to centimeters.
We write the unit conversion factor in its two forms:
The correct unit conversion factor is the ratio that cancels the units of grams and leaves ounces.
x oz = 125 g × [latex]\frac{\text{1 oz}}{\text{28.349}\;\rule[0.25ex]{0.5em}{0.1ex}\hspace{-0.5em}g}[/latex] = [latex]\frac{125}{28.349}[/latex] oz
= 4.41 oz (3 significant figures)
Check Your Learning
Convert a volume of 9.345 qt to liters.
Answer:
8.844 L
Beyond simple unit conversions, dimensional analysis can be used to solve more complex problems involving computations. Regardless of the details, the basic approach is the same—all the dimensional units involved in the calculation must be appropriately oriented to ensure that they appropriately cancel and/or combine to yield the desired unit in the result. This is why it is referred to as the dimensional analysis. As your study of chemistry continues, you will encounter many opportunities to apply this approach.
Example 9
Computing Quantities from Measurement Results and Known Mathematical Relations
What is the density of common antifreeze in units of g/mL? A 4.00 qt sample of the antifreeze weighs 9.26 lb.
Solution
Since density = [latex]\frac{\text{mass}}{\text{volume}}[/latex], we need to divide the mass in grams by the volume in milliliters. In general: the number of units of B = the number of units of A × unit conversion factor. The necessary conversion factors are given in Table 4: 1 lb = 453.59 g; 1 L = 1.0567 qt; 1 L = 1,000 mL. We can convert mass from pounds to grams in one step:
We need to use two steps to convert volume from quarts to milliliters.
- Convert quarts to liters.
4.00
qt× [latex]\frac{1\;\text{L}}{1.0567\;\rule[0.25ex]{0.5em}{0.1ex}\hspace{-0.5em}\text{qt}}[/latex] = 3.78 L - Convert liters to milliliters.
3.78
L× [latex]\frac{1000 \;\text{L}}{\rule[0.25ex]{0.5em}{0.1ex}\hspace{-0.5em}\text{L}}[/latex] = 3.78 L × 103 mL
Then,
Alternatively, the calculation could be set up in a way that uses three unit conversion factors sequentially as follows:
Check Your Learning
What is the volume in liters of 1.000 oz, given that 1 L = 1.0567 qt and 1 qt = 32 oz (exactly)?
Answer:
2.956 × 10⁻² L
Example 10
Computing Quantities from Measurement Results and Known Mathematical Relations
While being driven from Philadelphia to Atlanta, a distance of about 1250 km, a 2014 Lamborghini Aventador Roadster uses 213 L gasoline.
(a) What (average) fuel economy, in miles per gallon, did the Roadster get during this trip?
(b) If gasoline costs $3.80 per gallon, what was the fuel cost for this trip?
Solution
(a) We first convert distance from kilometers to miles:
and then convert volume from liters to gallons:
Then,
Alternatively, the calculation could be set up in a way that uses all the conversion factors sequentially, as follows:
(b) Using the previously calculated volume in gallons, we find:
Check Your Learning
A Toyota Prius Hybrid uses 59.7 L gasoline to drive from San Francisco to Seattle, a distance of 1300 km (two significant digits).
(a) What (average) fuel economy, in miles per gallon, did the Prius get during this trip?
(b) If gasoline costs $3.90 per gallon, what was the fuel cost for this trip?
Answer:
(a) 51 mpg; (b) $62
Data and the Scientific Method
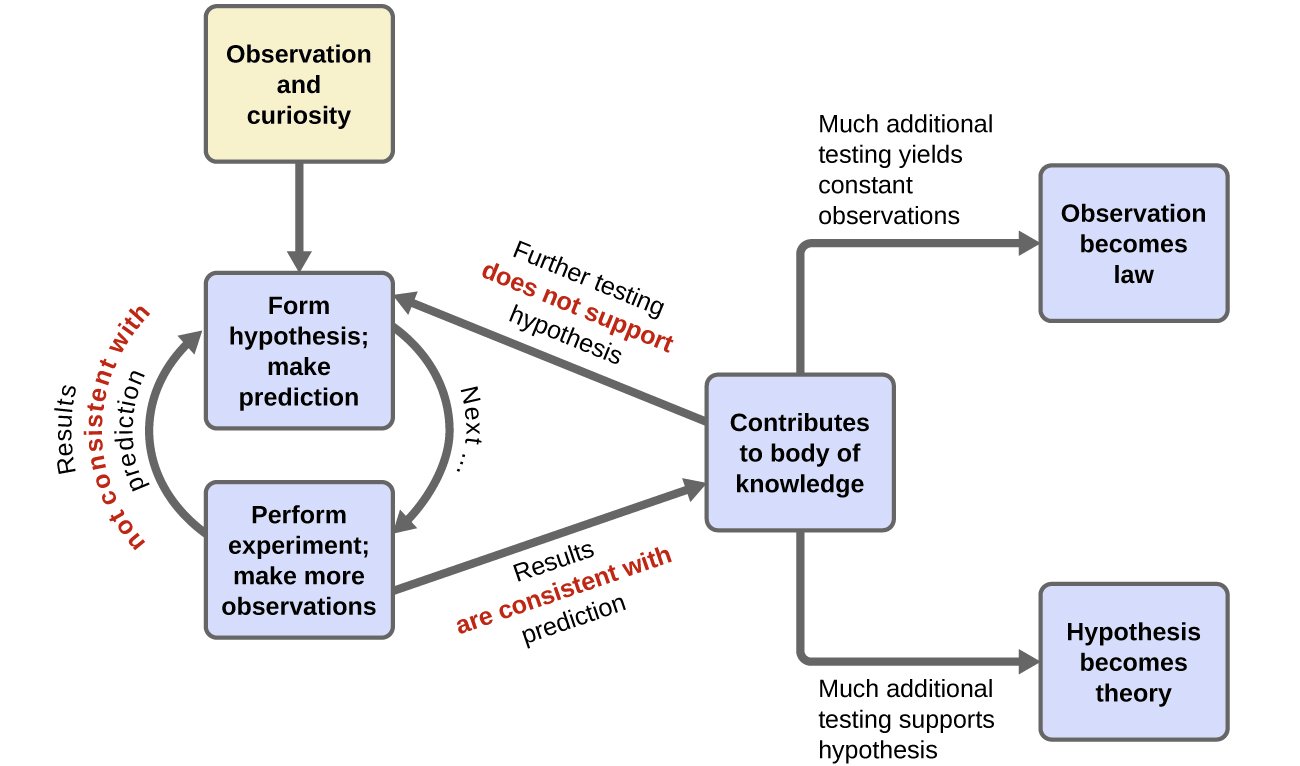
Chemistry is a science based on observation and experimentation. Doing chemistry involves attempting to answer questions and explain observations in terms of the laws and theories of chemistry, using procedures that are accepted by the scientific community. There is no single route to answering a question or explaining an observation, but there is an aspect common to every approach: Each uses knowledge based on experiments that can be reproduced to verify the results. Some routes involve a hypothesis, a tentative explanation of observations that acts as a guide for gathering and checking information. We test a hypothesis by experimentation, calculation, and/or comparison with the experiments of others and then refine it as needed.
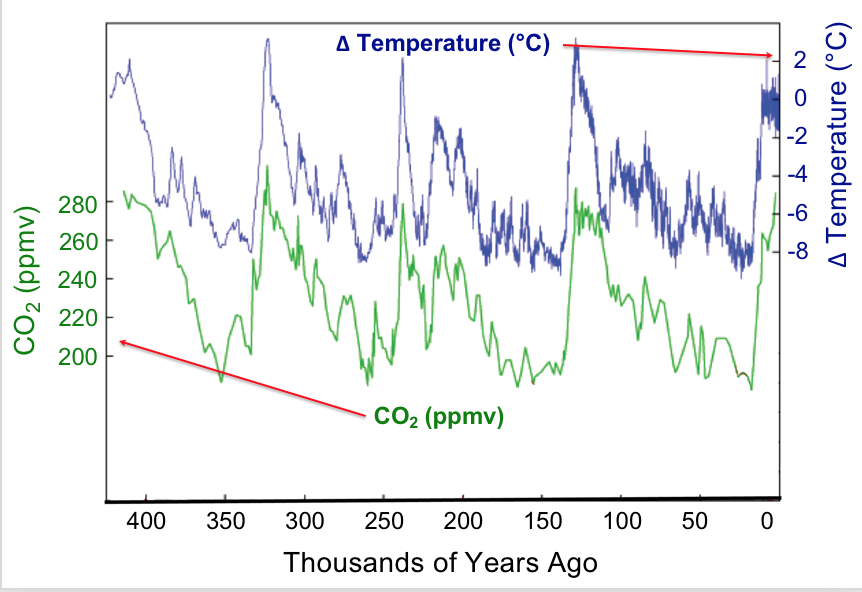
Observation provides the starting point for hypothesis generation. Data that we observe may be presented in tables or various types of graphs. Let's look at some data concerning global surface temperatures and levels of carbon dioxide, CO2, over many thousands of years (Figure 6). A simple glance enables us to glean many features from this plot. The plot uses double vertical axes with the left-side axis showing CO2 levels as measured in parts-per-million-by-volume (ppmv) whereas the right-side axis shows the change in temperature (Δ T) measured in degrees Celsius (°C). The horizontal axis displays time, beginning with the present at the far right and proceeding back in time to the left. The time span is about 400,000 years. The data shown here could be called the result of a natural experiment; that is data that are produced by natural conditions. Under natural conditions many factors may be changing: the output of the sun, the amount and type of vegetation on earth, the reflectivity of the atmosphere, etc. Strikingly, one sees that increases and decreases in carbon dioxide levels with time are matched by increases and decreases in the mean global temperature; in other words the data are correlated. Does this mean that increased temperature affects increased carbon dioxide levels?
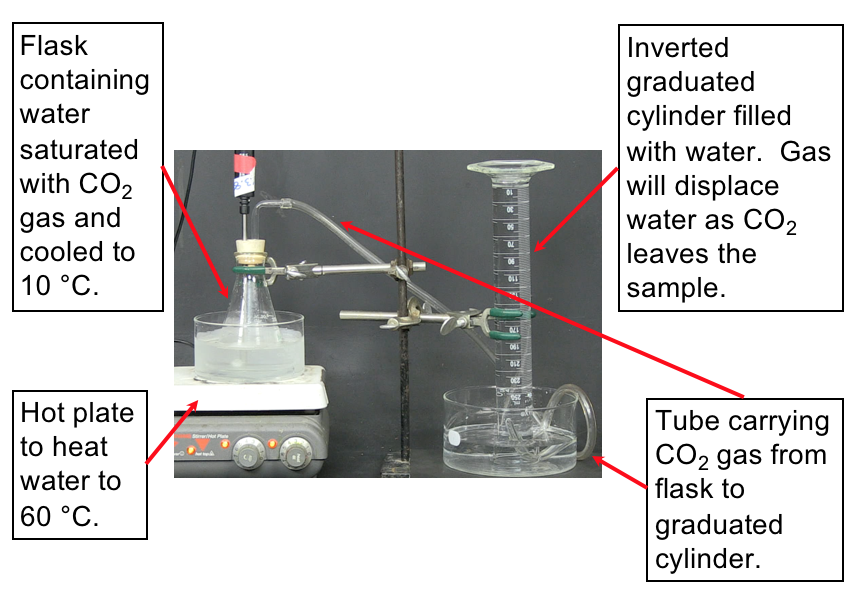
To investigate why the atmospheric carbon dioxide level correlates with temperature we can propose a reason (make a hypothesis) and devise some means of testing our proposal. For example, we might hypothesize that CO2 dissolved in the oceans is released into the atmosphere as temperature increases. How can this be tested? Let's devise a controlled experiment that addresses this hypothesis. We want to measure how much carbon dioxide is released when a water solution of carbon dioxide is warmed. A setup to make these measurements is shown in the demonstration below along with the resulting data.
Demonstration: Measurement of released CO2 gas upon heating water
Set up. The following video demonstrates the experiment to measure the volume of CO2 released from water upon heating the water. The set-up for the experiment is shown in Figure 7. Make sure to understand the set-up described in the image before watching the demonstration so that you understand what is happening.
Prediction. Now watch the video that displays how the CO2 is collected as the water is heated. You can slow down or speed up the video by clicking on the "1x" in the lower right-hand corner of the video player. Predict what you expect to see while watching the video (e.g., how will you be able to know the gas is being released?).
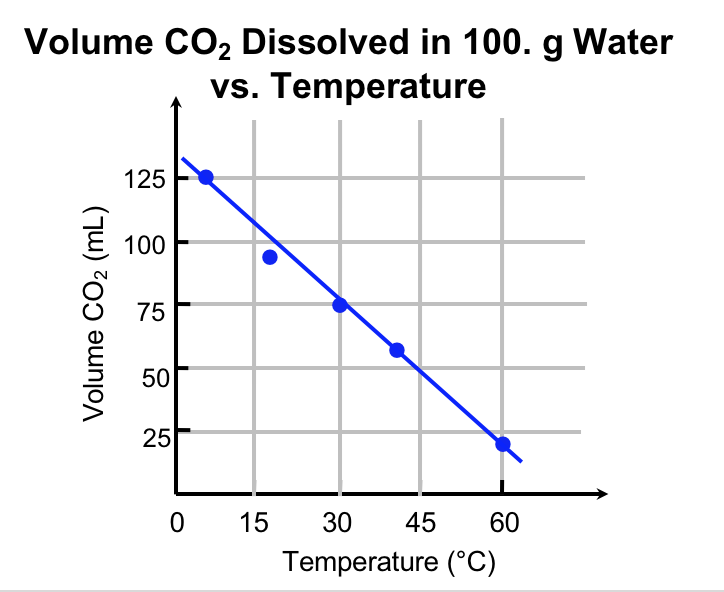
Explanation. Figure 8 communicates the data from this experiment. Notice the temperature is on the x-axis, and the volume of dissolved CO2 is on the y-axis. A good graph has a meaningful title, axis labels (including units), and a constant scale on each axis. The data is plotted, and a line of best-fit is drawn.
Key Concepts and Summary
Measurements provide quantitative information that is critical in studying and practicing chemistry. Each measurement has an amount, a unit for comparison, and an uncertainty. Measurements can be represented in either decimal or scientific notation. Scientists primarily use the SI (International System) or metric systems. We use base SI units such as meters, seconds, and kilograms, as well as derived units, such as liters (for volume) and g/cm3 (for density). In many cases, we find it convenient to use unit prefixes that yield fractional and multiple units, such as microseconds (10−6 seconds) and megahertz (106 hertz), respectively.
It is often useful or necessary to convert a measured quantity from one unit into another. These conversions are accomplished using unit conversion factors, which are derived by simple applications of a mathematical approach called dimensional analysis. This strategy is also employed to calculate sought quantities using measured quantities and appropriate mathematical relations.
Scientific advancement is an iterative process. People make observations and generate testable hypotheses. When experiments are completed in the laboratory, it's essential to have controls. Communication of results often involves graphs with the independent variable on the x-axis and the dependent variable on the y-axis.
Key Equations
- density = [latex]\frac{\text{mass}}{\text{volume}}[/latex]
Glossary
- accuracy
- how closely a measurement aligns with a correct value
- Celsius (°C)
- unit of temperature; water freezes at 0 °C and boils at 100 °C on this scale
- cubic centimeter (cm3 or cc)
- volume of a cube with an edge length of exactly 1 cm
- cubic meter (m3)
- SI unit of volume
- density
- ratio of mass to volume for a substance or object
- dimensional analysis
- versatile mathematical approach that can be applied to computations ranging from simple unit conversions to more complex, multi-step calculations involving several different quantities
- exact number
- number derived by counting or by definition
- extensive property
- property of a substance that depends on the amount of the substance
- intensive property
- property of a substance that is independent of the amount of the substance
- kelvin (K)
- SI unit of temperature; 273.15 K = 0 ºC
- kilogram (kg)
- standard SI unit of mass; 1 kg = approximately 2.2 pounds
- length
- measure of one dimension of an object
- liter (L)
- (also, cubic decimeter) unit of volume; 1 L = 1,000 cm3
- meter (m)
- standard metric and SI unit of length; 1 m = approximately 1.094 yards
- milliliter (mL)
- 1/1,000 of a liter; equal to 1 cm3
- precision
- how closely a measurement matches the same measurement when repeated
- rounding
- procedure used to ensure that calculated results properly reflect the uncertainty in the measurements used in the calculation
- second (s)
- SI unit of time
- SI units (International System of Units)
- standards fixed by international agreement in the International System of Units (Le Système International d’Unités)
- significant figures
- (also, significant digits) all of the measured digits in a determination, including the uncertain last digit
- uncertainty
- estimate of amount by which measurement differs from true value
- unit
- standard of comparison for measurements
- unit conversion factor
- ratio of equivalent quantities expressed with different units; used to convert from one unit to a different unit
- volume
- amount of space occupied by an object
Chemistry End of Section Exercises
- Determine how many significant figures are in each of the following numbers and then rewrite each number in scientific notation:
- 704
- 0.03344
- 5000
- 22080
- 1000.00
- 0.0000000651
- 0.00007157
- 0.04500
- Categorize each of the following as either an exact number or a measurement:
- the number of eggs in a basket
- the mass of a dozen eggs
- the number of gallons of gasoline necessary to fill an automobile gas tank
- the number of cm in 2 m
- the volume of a can of soda
- the time required to drive from San Francisco to Kansas City at an average speed of 53 mi/h
- Perform the following calculations and report each answer with the correct number of significant figures.
- 628 × 342
- (5.63 × 102) × (7.4 × 103)
- [latex]\frac{28.0}{(13.483)(0.05832)}[/latex]
- 8119 × 0.000023
- 14.98 + 27,342 + 84.7593
- 42 + 0.2599
- 0.147 + 0.0066 + 0.002
- 15 – 0.15 – 0.6155
- [latex]\frac{(8.78)(0.050)}{0.478}[/latex]
- [latex]\frac{(88.5-87.57)}{45.13}[/latex]
- Consider the results of the archery contest shown in this figure.
- Which archer is most precise?
- Which archer is most accurate?
- Who is both least precise and least accurate?
- Classify the following sets of measurements as accurate, precise, both, or neither.
- Use different balances to weight a metal square with a known mass of 15.000 g: 17.27 g, 13.05 g, 19.46 g, 16.92 g
- Testing the volume of a batch of 25-mL pipettes: 27.02 mL, 26.99 mL, 26.97 mL, 27.01 mL
- Determining the purity of a pure gold sample: 99.9999%, 99.9998%, 99.9998%, 99.9999%
- Fill in the blanks in the following table:
Prefix Symbol Factor centi- 103 m 10-9 pico- μ - Explain the difference between extensive properties and intensive properties.
- Identify the following properties as either extensive or intensive.
- volume
- temperature
- humidity
- energy
- boiling point
- density
- The label on a soft drink bottle gives the volume in two units: 2.0 L and 67.6 fl oz. Use this information to derive a conversion factor between the English and metric units. How many significant figures can you justify in your conversion factor?
- A barrel of oil is 42 gallons. How many liters of oil are in a barrel? (1 liter = 1.05669 quarts; 4 quarts = 1 gallon)
- The distance between the centers of the two oxygen free grammar check atoms in an oxygen molecule is 1.21 × 10⁻⁸ cm. What is this distance in nanometers?
- An instructor is preparing for an experiment requiring 225 g phosphoric acid. The only container readily available is a 150-mL Erlenmeyer flask. Is it large enough to contain the acid, whose density is 1.83 g/mL?
- Osmium is one of the densest elements known. What is its density if 2.72 g has a volume of 0.121 cm3?
- A large piece of jewelry has a mass of 132.6 g. A graduated cylinder initially contains 48.6 mL water. When the jewelry is submerged in the graduated cylinder, the total volume increases to 61.2 mL.
- Determine the density of this piece of jewelry.
- Assuming that the jewelry is made from only one substance, what substance is it likely to be? The following information may be helpful:
Substance Density Diamond 3.51 g/cm3 Gold 19.3 g/cm3 Platinum 21.5 g/cm3 Silver 10.5 g/cm3
- Designate the following statements as either a Testable Hypotheses or a Non-Testable Statement:
- Dogs are social animals.
- All people should have dogs as pets.
- A dogs' sense of smell is more discerning than that of a human.
- Petting a dog releases calming hormones in humans.
- Dog-training programs should be free to all dog-owners.
- A person is heating a sample of cold water. As she applies heat, she measures the temperature each minute. Generate a graph of the following data.
Time (min) Temperature (°C) 1.0 5.0 2.0 10.0 3.0 14.0 4.0 21.0 Find the slope of the line to determine the rate at which the temperature changes.
- If the person continues to heat the water at the rate described in problem #61, determine the temperature after heating the water for 8 minutes and 45 seconds.
Answers to Chemistry End of Section Exercises
- (a) 3 significant figures, 7.04 × 10²; (b) 4 significant figures, 3.344 × 10⁻²; (c) 1 significant figures, 5 × 10³; (d) 4 significant figures, 2.208 × 10⁴; (e) 6 significant figures, 1.00000 × 10³; (f) 3 significant figures, 6.51 × 10⁻⁸; (g) 4 significant figures, 7.157 × 10⁻⁵; (h) 4 significant figures, 4.500 × 10⁻²
- (a) exact; (b) measured; (c) measured; (d) exact; (e) measured; (f) measured
- a) 2.15 × 10⁵; (b) 4.2 × 10⁶; (c) 35.6; (d) 0.19; (e) 27,442; (f) 42; (g) 0.156; (h) 14; (i) 0.92; (j) 0.02
- (a) Archer X; (b) Archer W; (c) Archer Y
- (a) Not accurate or precise; (b) Precise but not accurate; (c) Precise and accurate
-
Prefix Symbol Factor centi- c 102 kilo- k 103 milli- m 10-3 nano- n 10-9 pico- p 10-12 micro- μ 10-6 - The value of an extensive property depends upon the amount of matter being considered, whereas the value of an intensive property is the same regardless of the amount of matter being considered.
- (a) extensive; (b) intensive; (c) intensive; (d) extensive; (e) intensive; (f) intensive (Density is the ratio of mass to volume, both extensive properties, however dividing one extensive property by another will in effect “cancel” this dependence on amount, yielding a ratio that is independent of amount.)
- The conversion factor can be presented two ways: [latex]\frac{\text{2.0 L}}{\text{67.6 fl oz}}[/latex] or [latex]\frac{\text{67.6 fl oz}}{\text{2.0 L}}[/latex]
Only two significant figures are justified. - 160 L
- 0.121 nm
- Yes, the acid's volume is 123 mL.
- 22.5 g/cm3
- (a) 10.5 g/cm3; (b) silver
- (a) Testable hypothesis; (b) Non-Testable Statement; (c) Testable hypothesis; (d) Testable hypothesis; (e) Non-Testable Statement
- The independent variable is time, so it is placed on the x-axis. The temperature increases as heat is applied for a given amount of time. Temperature change is the dependent variable, so it is placed on the y-axis. The slope of the line is 5.1 °C/min. This means that the temperature of the water increases approximately 5.1 degrees each minute that it is heated.
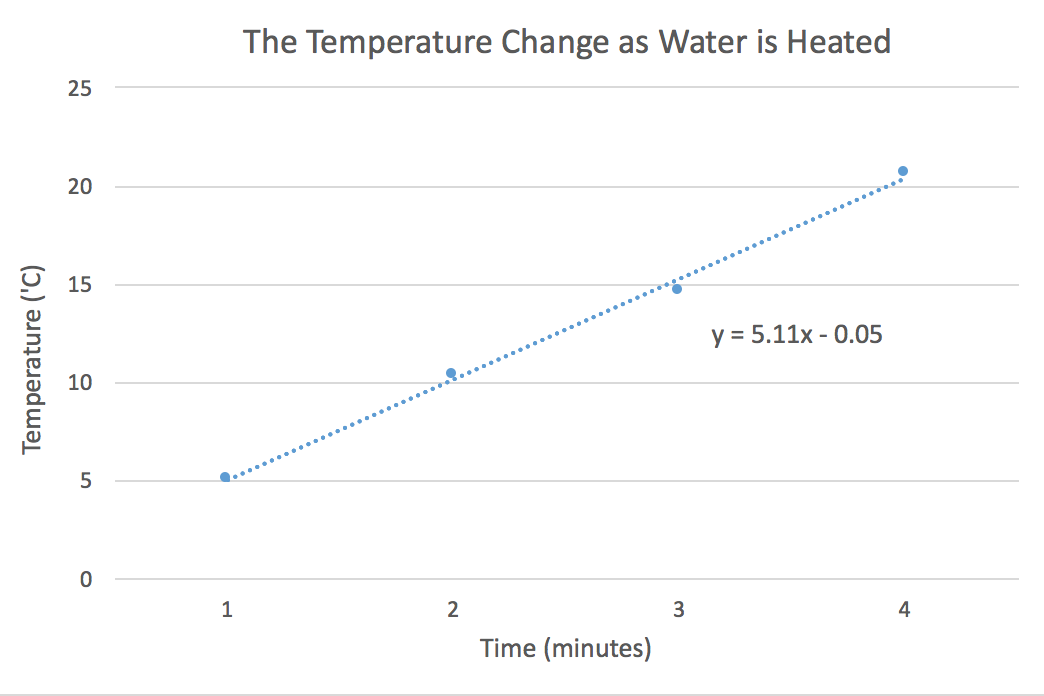
- 45 °C
