
34 Waves and the Electromagnetic Spectrum (M7Q1)
Introduction
Learning Objectives for Waves and the Electromagnetic Spectrum
- Describe the basic properties of light as a wave.
| Properties of Waves | Electromagnetic Spectrum |
| Key Concepts and Summary | Key Equations | Glossary | End of Section Exercises |
Properties of Waves
A wave is an oscillation or periodic movement that can transport energy from one point in space to another. Common examples of waves are all around us. Shaking the end of a rope transfers energy from your hand to the other end of the rope, dropping a pebble into a pond causes waves to ripple outward along the water's surface, and the expansion of air that accompanies a lightning strike generates sound waves (thunder) that can travel outward for several miles. In each of these cases, kinetic energy is transferred through matter (the rope, water, or air) while the matter remains essentially in place.
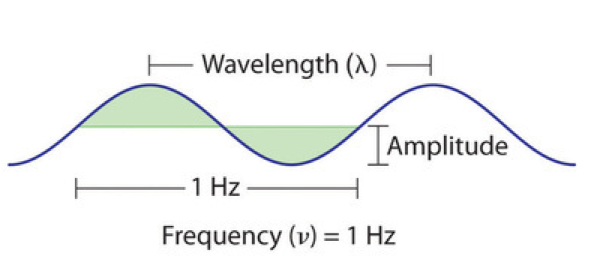
All waves are characterized by a wavelength (denoted by λ, the lowercase Greek letter lambda), a frequency (denoted by ν, the lowercase Greek letter nu), and an amplitude. As can be seen in Figure 1, the wavelength is the distance between two consecutive peaks or troughs in a wave (measured in meters in the SI system). The frequency is the number of wave cycles that pass a specified point in space in a specified amount of time (in the SI system, this time is measured in seconds). A cycle corresponds to one complete wavelength. The unit for frequency, therefore, is expressed as cycles per second (s−1), also referred to as hertz (Hz). The amplitude corresponds to the magnitude of the wave's displacement and so, in Figure 1, this corresponds to one-half the height between the peaks and troughs.
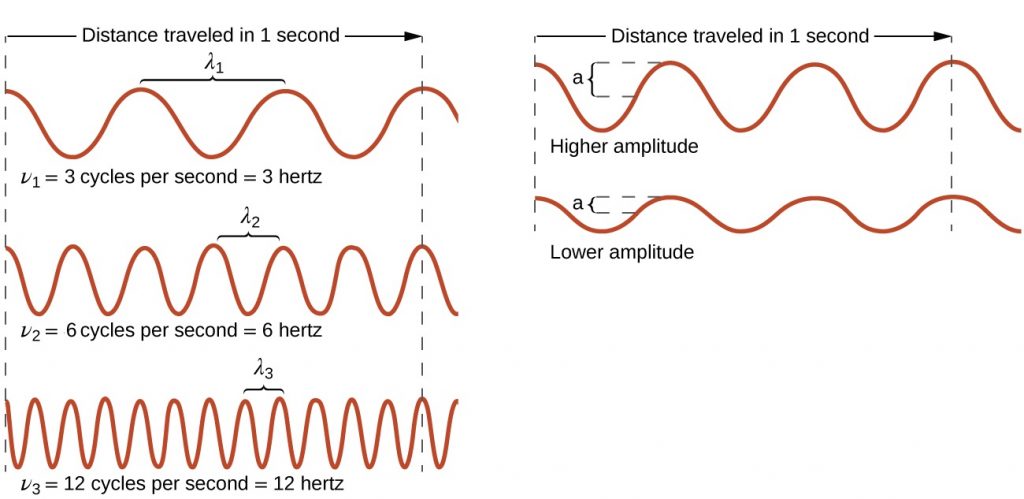
As can be seen in Figure 2, the properties of a wave are related. On the left side of Figure 2, all waves have the same amplitude, but the wave on top only completes 3 cycles per second, and therefore has a frequency of 3 Hz. The wave on the bottom completes 12 cycles in the same amount of time (1 second), and therefore has a frequency of 12 Hz. In order to complete 4 times as many cycles in the same timeframe, the wavelength of the bottom wave must be shorter than the wavelength of the top wave (in fact, it must be 4 times shorter) and assuming that the waves are traveling at the same speed. This produces an inverse relationship between wavelength and frequency—as wavelength decreases, frequency increases. Note that this relationship does not depend on the amplitude of the wave. On the right side of Figure 2, you can see that waves with the same wavelength and frequency can have different amplitudes. The amplitude is related to the intensity of the wave, which for light is the brightness, and for sound is the loudness.
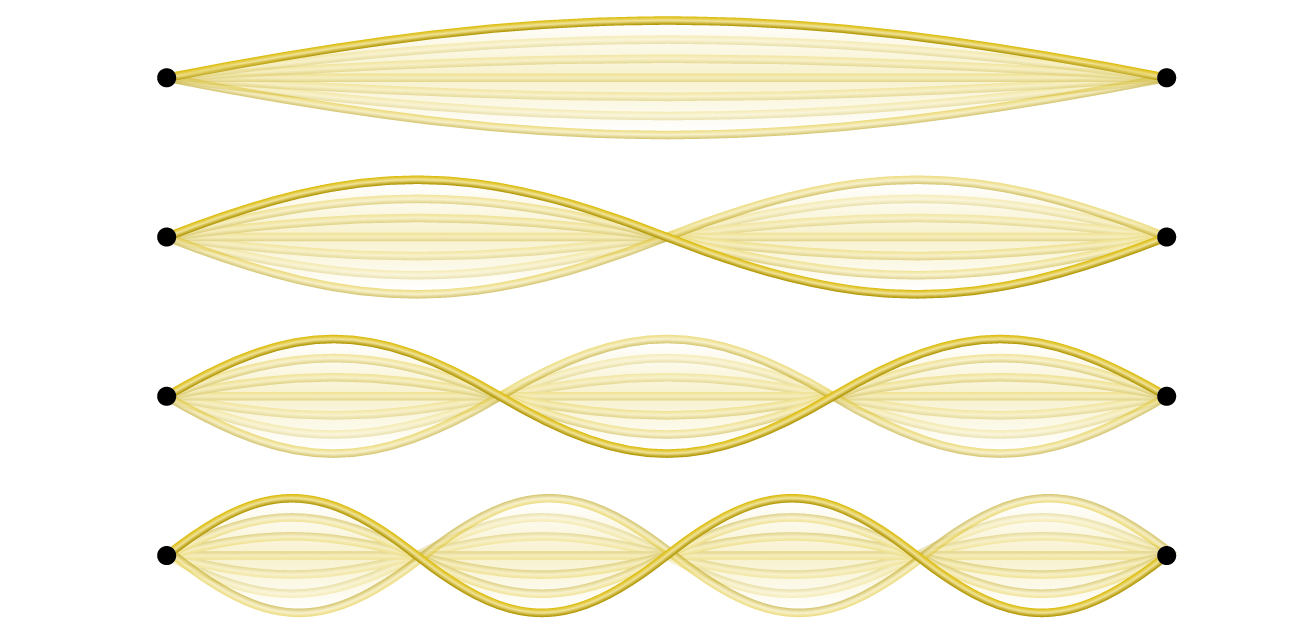
Not all waves are traveling waves. Standing waves (also known as stationary waves) remain constrained within some region of space. The simplest example of a standing wave is a one-dimensional wave associated with a vibrating string that is held fixed at its two end points. Figure 3 shows the four lowest-energy standing waves for a vibrating string at a particular amplitude. Although the string's motion lies mostly within a plane, the wave itself is considered to be one dimensional, since it lies along the length of the string. The motion of string segments in a direction perpendicular to the string length generates the waves and so the amplitude of the waves is visible as the maximum displacement of the curves seen in Figure 3. The key observation from the figure is that only those waves having an integer number, n, of half-wavelengths between the end points can form. A system with fixed end points such as this restricts the number and type of the possible waveforms. Another important observation is that the waves displaying more than one-half wavelength all have one or more points between the two end points that are not in motion. These special points with zero amplitude are called nodes. The energies of the standing waves with a given amplitude in a vibrating string increase with the number of half-wavelengths, n. Since the number of nodes is n – 1, the energy can also be said to depend on the number of nodes, generally increasing as the number of nodes increases.
Demonstration: Nodes in standing waves
Set up. The following video shows a demonstration of a standing wave created using a rope attached to a drill. As the drill bit rotates, the rope forms a standing wave. You will notice that the number of nodes, peaks, and troughs in the wave will change with the energy input from the drill.
Explanation. Starting at the lowest drill speed, there was one half wavelength between the stationary point on the left side of the rope and the drill bit on the right side of the rope. With increased energy from the drill, the number of wavelengths between the two ends increases, as do the number of nodes.
The Electromagnetic Spectrum
The nature of light has been a subject of inquiry since antiquity. In the seventeenth century, Isaac Newton performed experiments with lenses and prisms and was able to demonstrate that white light consists of the individual colors of the rainbow combined together. Newton explained his optics findings in terms of a "corpuscular" view of light, in which light was composed of streams of extremely tiny particles traveling at high speeds according to Newton's laws of motion. Others in the seventeenth century, such as Christiaan Huygens, had shown that optical phenomena such as reflection and refraction could be equally well explained in terms of light as waves traveling at high speed through a medium called "luminiferous aether" that was thought to permeate all space. Early in the nineteenth century, Thomas Young demonstrated that light passing through narrow, closely spaced slits produced interference patterns that could not be explained in terms of Newtonian particles but could be easily explained in terms of waves. Later in the nineteenth century, after James Clerk Maxwell developed his theory of electromagnetic radiation and showed that light was the visible part of a vast spectrum of electromagnetic waves, the particle view of light became thoroughly discredited. By the end of the nineteenth century, scientists viewed the physical universe as roughly comprising two separate domains: matter composed of particles moving according to Newton's laws of motion, and electromagnetic radiation consisting of waves governed by Maxwell's equations. Today, these domains are referred to as classical mechanics and classical electrodynamics (or classical electromagnetism), respectively. Although there were a few physical phenomena that could not be explained within this framework, scientists at that time were so confident of the overall soundness of this framework that they viewed these aberrations as puzzling paradoxes that would ultimately be resolved somehow within this framework. As we shall see, these paradoxes led instead to an entirely new framework that intimately connects both particles and waves at a fundamental level called wave-particle duality, which has superseded the classical view and marked the beginning of a revolution in science.
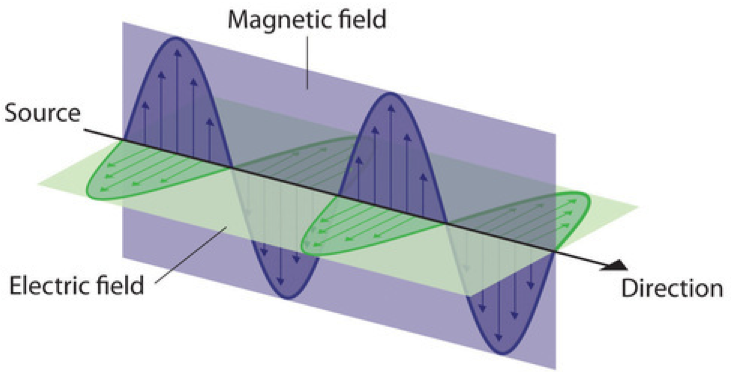
Water waves transmit energy through space by the periodic oscillation of matter (the water). But waves need not be restricted to travel through matter. As Maxwell showed, electromagnetic waves consist of an electric field oscillating in step with a perpendicular magnetic field, both of which are perpendicular to the direction of travel (Figure 4). The properties of waves—λ, ν, and amplitude—that were used to describe waves in matter also apply to forms of electromagnetic radiation. Electromagnetic waves have wavelengths that fall within an enormous range—wavelengths of kilometers (103 m) to picometers (10−12 m) have been observed. Frequencies commonly have units of megahertz (1 MHz = 1 × 10⁶ Hz) and gigahertz (1 GHz = 1 × 10⁹ Hz), indicating that 1 × 10⁶ or 1 × 10⁹ wavelengths pass a single point in one second.
Electromagnetic waves can travel through a vacuum at a constant speed of 2.998 × 10⁸ m/s, the speed of light (denoted by c). The product of a wave's wavelength (λ) and its frequency (ν), λν, is the speed of the wave. Thus, for electromagnetic radiation in a vacuum:
c = 2.998 × 10⁸ ms-1 = λν
Notice that the units of c in this equation are m/s. For this equation, the wavelength must be in units of meters and the frequency must be in units of Hz (or 1/s) so that when you multiply λν you end up with m × [latex]\frac{1}{s}[/latex] = [latex]\frac{m}{s}[/latex], which is the unit of the speed of light. Make sure that your units appropriately cancel using dimensional analysis, as always.
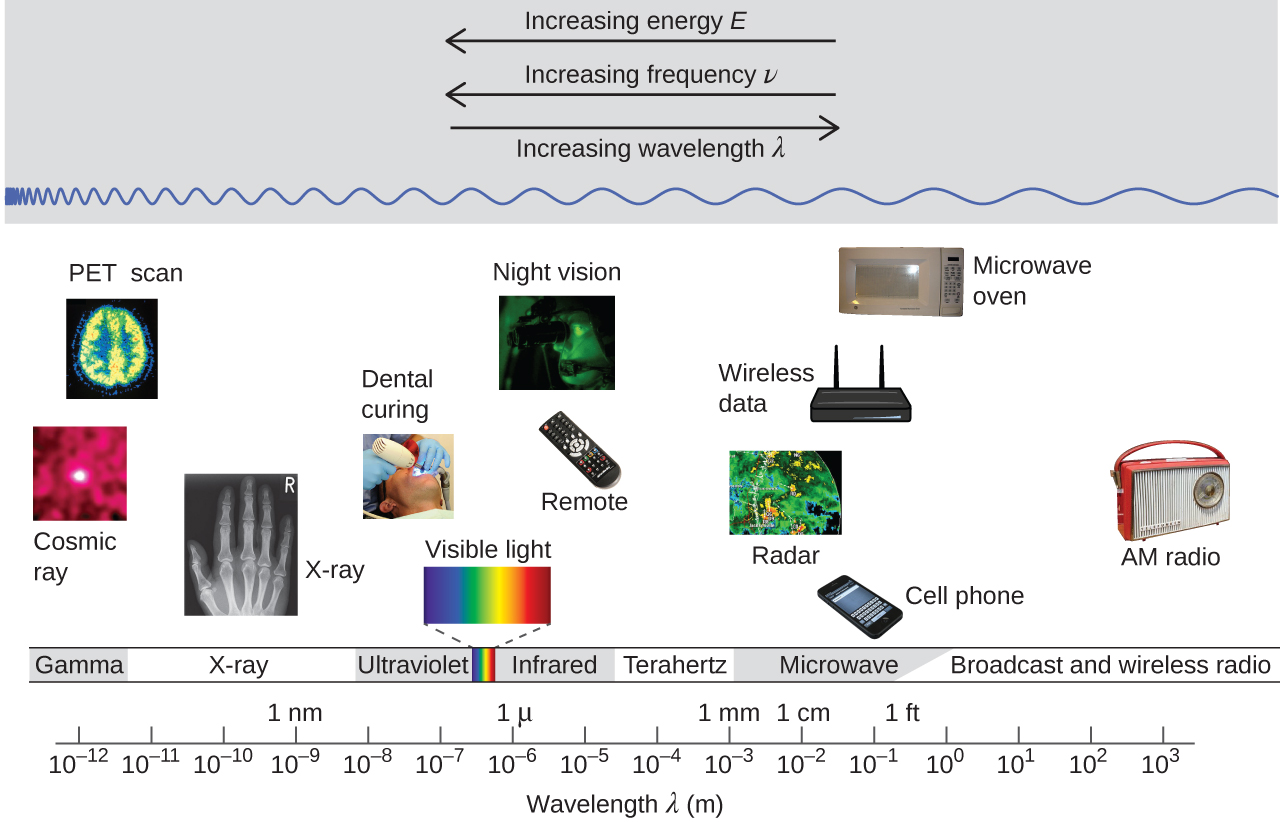
This equation is another demonstration of the inverse relationship between wavelength and frequency: As the wavelength increases, the frequency must decrease so that the speed remains constant. The inverse proportionality is illustrated in Figure 5. This figure also shows the electromagnetic spectrum—the range of all types of electromagnetic radiation. Each of the various colors of visible light has specific frequencies and wavelengths associated with them, and you can see that visible light makes up only a small portion of the electromagnetic spectrum. Because the technologies developed to work in various parts of the electromagnetic spectrum are different, for reasons of convenience and historical legacies, different units are typically used for different parts of the spectrum. For example, radio waves are usually specified as frequencies (typically in units of MHz), while the visible region is usually specified in wavelengths (typically in units of nm or angstroms).
Demonstration: Elements have characteristic emission spectra
Set up. A flame test is a method used to detect the presence of certain elements in a sample, primarily metals. Samples are exposed to a gas flame and produce a characteristic emission spectrum. We can qualitatively observe the emission spectrum by noting the different colors that are produced when each sample is introduced into the flame (e.g., the lithium sample looks red). Another way of performing this test, as shown in the demonstration below, is to use a spectrometer (sometimes referred to as a spectrophotometer).
In the demonstration below, you will see the reading by the spectrometer in the upper right-hand quadrant of the video. In this spectrum, the x axis displays wavelength (from 350 nm to 950 nm) and the y axis records intensity. You'll notice that before any samples are introduced into the flame, there are already peaks in the emission spectrum resulting from the color of the flame itself (these peaks occur around 590 nm [tallest], 675 nm [medium height], and 770 nm [shortest]). As samples are introduced (see the label in the lower center of the video), these peaks will change height and new peaks will appear as the flame color changes. The time-stamps with good views of the flame and spectrum are provided below so that you can pause the video to inspect how the spectrum changes.
Explanation. The qualitative results for the flame test are:
- Lithium produces a red flame (pause the video ~0:26 to observe the spectrum).
- Boron produces a green flame (~0:36 to observe the spectrum).
- Sodium produces a yellow flame (~0:44 to observe the spectrum).
- Potassium produces a purple flame (~0:55 to observe the spectrum).
- Calcium produces a red flame (~1:06 to observe the spectrum).
- Copper produces a green flame (~1:13 to observe the spectrum).
- Strontium produces a scarlet flame (~1:23 to observe the spectrum).
- Barium produces a yellow-green flame (~1:33 to observe the spectrum).
While the qualitative data (i.e., our perception of the color of the flames) limits the identification of samples based on a flame test, using a spectrometer to record the wavelengths of light produced when each sample is introduced into a flame provides a way to characterize unknown samples.
Example 1
Determining the Frequency and Wavelength of Radiation
A sodium streetlight gives off yellow light that has a wavelength of 589 nm (1 nm = 1 × 10⁻⁹ m). What is the frequency of this light?
Solution
We can rearrange the equation c = λν to solve for the frequency:
Since c is expressed in meters per second, we must also convert 589 nm to meters.
Check Your Learning
One of the frequencies used to transmit and receive cellular telephone signals in the United States is 850 MHz. What is the wavelength in meters of these radio waves?
Answer:
0.353 m = 35.3 cm
Chemistry in Real Life: Wireless Communication
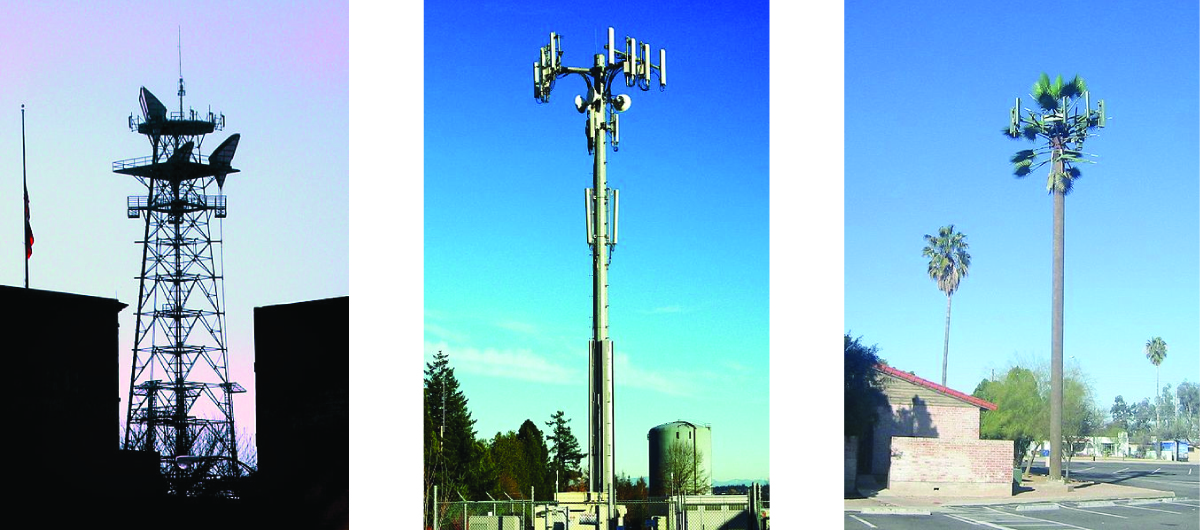
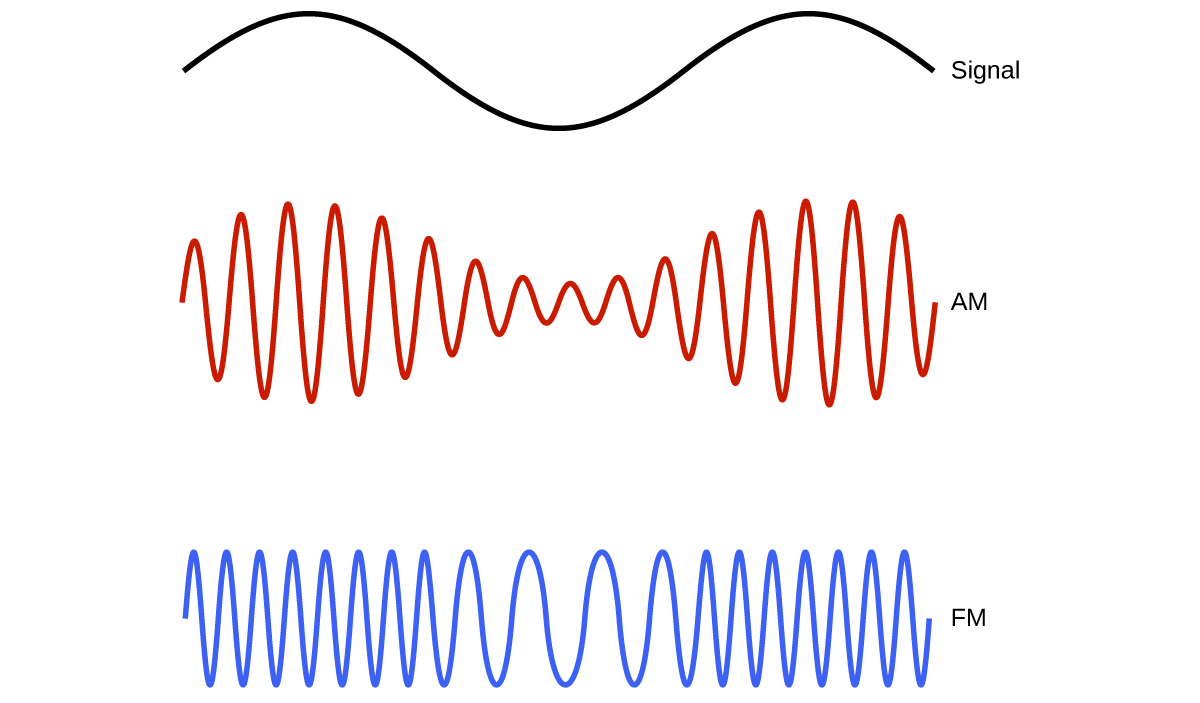
Many valuable technologies operate in the radio (3 kHz-300 GHz) frequency region of the electromagnetic spectrum. At the low frequency (low energy, long wavelength) end of this region are AM (amplitude modulation) radio signals (540-2830 kHz) that can travel long distances. FM (frequency modulation) radio signals are used at higher frequencies (87.5-108.0 MHz). In AM radio, the information is transmitted by varying the amplitude of the wave. In FM radio, by contrast, the amplitude is constant and the instantaneous frequency varies (Figure 7).
Other technologies also operate in the radio-wave portion of the electromagnetic spectrum. For example, 4G cellular telephone signals are approximately 880 MHz, while Global Positioning System (GPS) signals operate at 1.228 and 1.575 GHz, local area wireless technology (Wi-Fi) networks operate at 2.4 to 5 GHz, and highway toll sensors operate at 5.8 GHz. The frequencies associated with these applications are convenient because such waves tend not to be absorbed much by common building materials.
Key Concepts and Summary
Waves are described by their wavelength (λ), frequency (ν), and amplitude. These terms can be used to describe waves in matter and electromagnetic waves. Light and other forms of electromagnetic radiation move through a vacuum with a constant speed, c, of 2.998 × 10⁸ ms−1. The speed of light in a vacuum is not affected by the frequency or wavelength of the light (e.g., blue light moves as fast as red light in a vacuum). This radiation shows wavelike behavior and is an example of a traveling wave. Wavelength and frequency are inversely related: As one increases, the other decreases.
Key Equations
- c = 2.998 × 10⁸ ms-1 = λν
Glossary
- amplitude
- extent of the displacement caused by a wave (for sinusoidal waves, it is one-half the difference from the peak height to the trough depth, and the intensity is proportional to the square of the amplitude)
- electromagnetic radiation
- energy transmitted by waves that have an electric-field component and a magnetic-field component
- electromagnetic spectrum
- range of energies that electromagnetic radiation can comprise, including radio, microwaves, infrared, visible, ultraviolet, X-rays, and gamma rays; since electromagnetic radiation energy is proportional to the frequency and inversely proportional to the wavelength, the spectrum can also be specified by ranges of frequencies or wavelengths
- frequency (ν)
- number of wave cycles (peaks or troughs) that pass a specified point in space per unit time
- hertz (Hz)
- the unit of frequency, which is the number of cycles per second, s−1
- intensity
- property of wave-propagated energy related to the amplitude of the wave, such as brightness of light or loudness of sound
- node
- any point of a standing wave with zero amplitude
- standing wave
- (also, stationary wave) localized wave phenomenon characterized by discrete wavelengths determined by the boundary conditions used to generate the waves; standing waves are inherently quantized
- wave
- oscillation that can transport energy from one point to another in space
- wavelength (λ)
- distance between two consecutive peaks or troughs in a wave
Chemistry End of Section Exercises
- An FM radio station found at 103.1 on the FM dial broadcasts at a frequency of 1.031 × 10⁸ s−1 (103.1 MHz). What is the wavelength of these radio waves in meters?
- FM-95, an FM radio station, broadcasts at a frequency of 9.51 × 10⁷ s−1 (95.1 MHz). What is the wavelength of these radio waves in meters?
- The laser on a Blu-ray player has a wavelength of 405 nm. In what region of the electromagnetic spectrum is this radiation? What is its frequency?
- The emission spectrum of cesium contains two lines whose frequencies are (a) 3.45 × 10¹⁴ Hz and (b) 6.53 × 10¹⁴ Hz. What are the wavelengths of the two lines? What color are the lines?
- When rubidium ions are heated to a high temperature, two lines are observed in its line spectrum at wavelengths (a) 7.9 × 10⁻⁷ m and (b) 4.2 × 10⁻⁷ m. What are the frequencies of the two lines? What color do we see when we heat a rubidium compound?
Answers to Chemistry End of Section Exercises
- 2.908 m
- 3.15 m
- Visible region; 7.40 × 10¹⁴ Hz
- (a) λ = 8.69 × 10⁻⁷ m; (b) λ = 4.59 × 10⁻⁷ m; The color of (a) is red; (b) is blue.
- (a) 3.8 × 10¹⁴ Hz; (b) 7.1 × 10¹⁴ Hz; The color of (a) is red; (b) is blue.
