
Unit Three
Day 21: Reaction Energy Diagram and Arrhenius Equation
D21.1 Factors that Affect the Rate Constant
Section D18.3 listed several factors that affect reaction rate: the chemical nature of the reactants; temperature; concentrations; catalysts; and, for heterogeneous reactions, surface area. The rate law, and the order of reaction with respect to each concentration in the rate law, indicate how rate depends on concentration. Chemical nature of reactants and temperature both affect the rate constant k. We will discuss catalysts and heterogeneous reactions later.
It appears obvious to say that different substances are likely to react at different rates. Thus a rate constant value applies to specific reactant and product molecules; that is, to a particular balanced chemical equation. Less obvious is that the rate “constant” is only constant at a given temperature; that is, a reaction has many different rate constants, each constant at a specified temperature. The value of the rate constant is determined by three main factors, the first two of which depend on temperature:
- To react, molecules must come close enough to each other to exchange energy and perhaps to break and form bonds; that is, molecules must collide. The rate constant is proportional to the rate of collisions:
[latex]k\;{\propto}\;\dfrac{\text{number of collisions}}{\text{time}}[/latex]
- For a reaction to occur, there must be sufficient energy in the reactant molecule or molecules to allow electrons to rearrange (to break and/or form bonds). The smaller the energy required, the larger the rate constant is.
- The reacting molecules must collide in an orientation that allows the reaction to proceed; that is, even though the molecules have enough energy, a collision is more likely to result in reaction when the molecules are arranged in certain ways.
Let’s consider these factors in more detail.
D21.2 Reaction Energy Diagrams
The rate of a chemical reaction depends on the energies of the reacting atoms and/or molecules. Bonds often need to be broken along the course of the reaction as new bonds are formed, and energy is required to break those bonds. Because energy is crucial for understanding the kinetics of a reaction, it is useful to diagram the energy changes that occur as a reaction proceeds.
Let’s use a simple reaction as an example. Consider cis–trans isomerization—changing a cis isomer into a trans isomer or vice versa. We’ve learned before that these geometric isomers can be separated at room temperature because there is a barrier to rotation around an alkene double bond. This “barrier” is the energy needed to rotate around the double bond until the π bond is completely broken (when the two 2p AOs that form the π bond are oriented at 90° to each other).
For a cis–trans isomerization, the angle of rotation around the double bond is a good measure of the progress of the reaction. Figure 2 shows energy versus reaction progress for conversion of cis-1,2-difluoroethene to trans-1,2-difluoroethene.
![]()
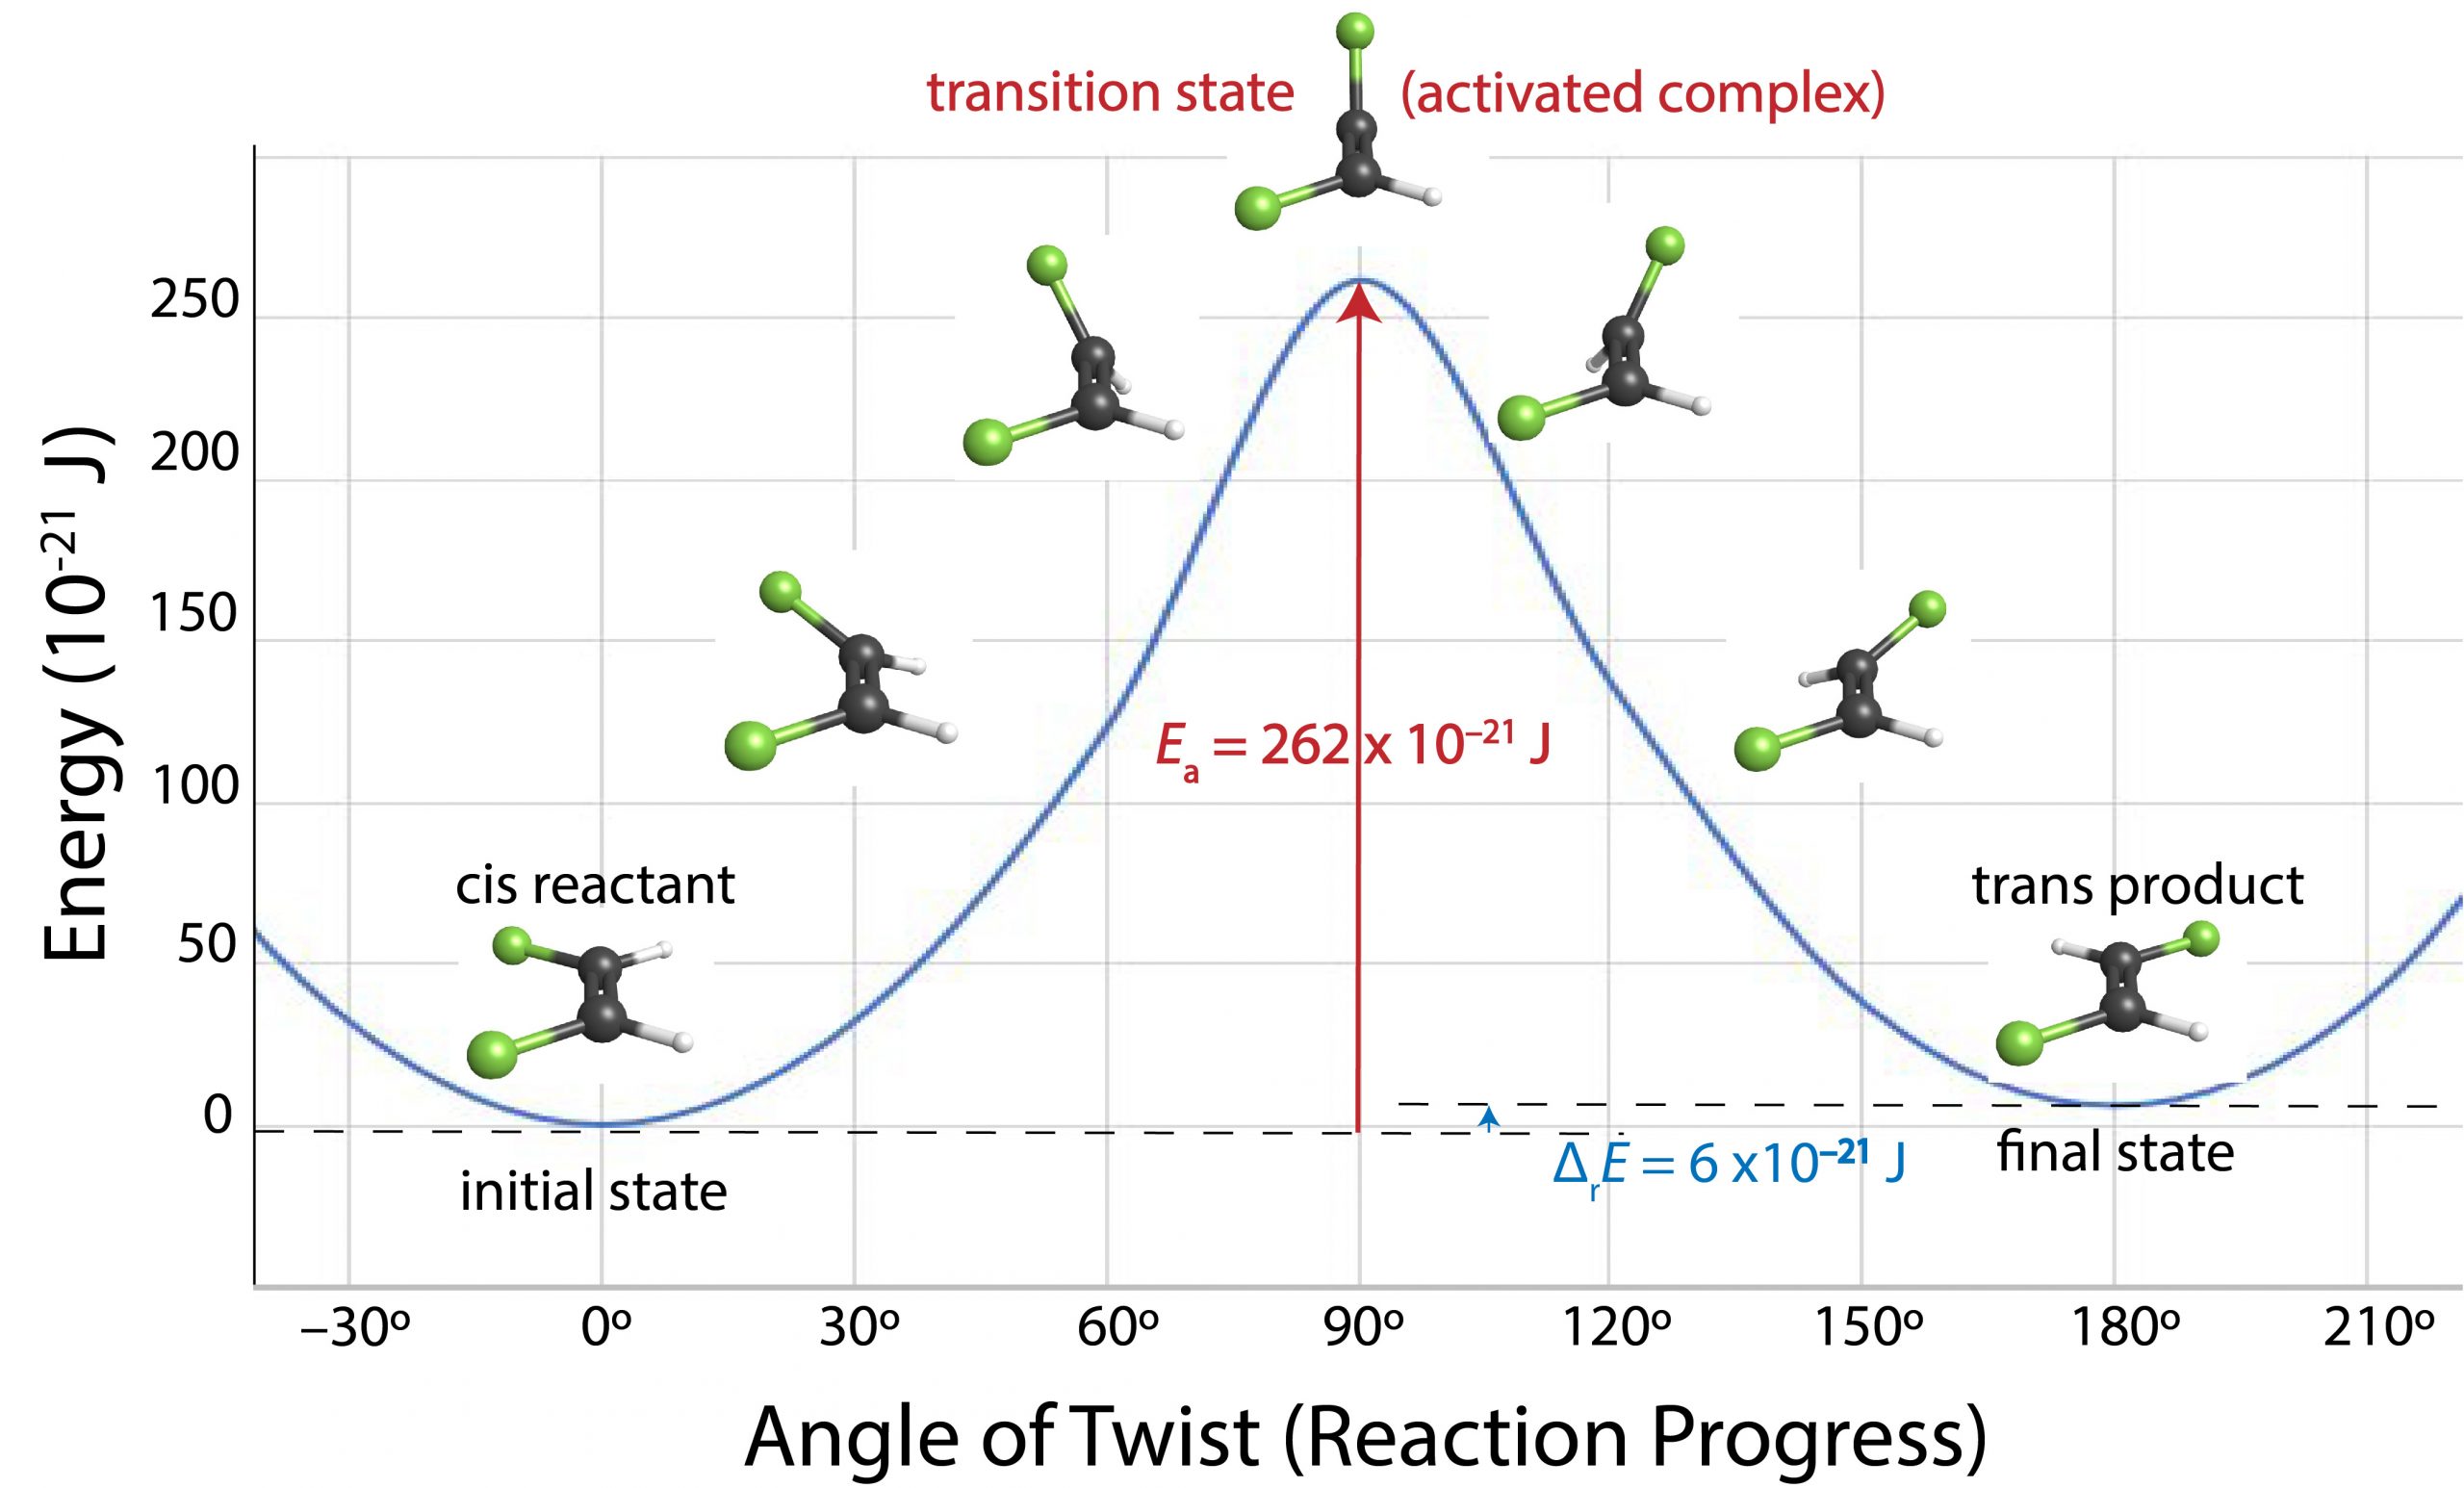
As one end of the molecule rotates relative to the other, energy increases because the π bond is partially broken. When the angle of rotation reaches 90° the π bond is completely broken and the energy of the molecule has increased by the bond energy of the π bond. Once the angle exceeds 90°, a new π bond begins to form and the molecule’s energy decreases. Finally, when the angle of rotation is 180° the new π bond is completely formed and the molecule’s energy has decreased almost to the same value it was initially. If a molecule does not have enough energy, which in this case is 262 × 10-21 J, the rotation cannot occur. Thus, only molecules whose energy is more than 262 × 10-21 J can react. As we shall see, at room temperature only a tiny fraction of all cis-1,2-difluoroethene molecules has this much energy, so rotation around the double bond is very slow at room temperature. Raising the temperature increases the fraction of molecules with enough energy to react and therefore increases the rate.
A diagram that shows energy as a function of reaction progress (such as Figure 2) is called a reaction energy diagram. In Figure 2, the reactant (cis isomer) and product (trans isomer) are connected by a single transition state, which is a maximum on the reaction energy diagram. The transition-state structure (or activated complex) is the structure that corresponds to the transition state. Because a transition-state structure has greater energy than either reactant molecule(s) or product molecule(s), it is unstable and exists for a very short time (typically < 10-15 s). This makes it very difficult to observe experimentally, unlike the stable reactant(s) and product(s).
The difference in energy between the transition state and the reactant(s) is the activation energy (Ea) of the reaction going forward (from reactant to product). If all other factors affecting the rate are the same, the greater the activation energy is, the slower the reaction is.
The difference in energy between products and reactants is the reaction energy change, ΔrE:
ΔrE = ∑Eproducts – ∑Ereactants
Figure 2 shows that the cis–trans isomerization of 1,2-difluoroethene has an activation energy of 262 × 10-21 J/molecule (or 158 kJ/mol) and a reaction energy change of +6 × 10-21 J/molecule (or +4 kJ/mol; the positive sign indicates that the trans isomer is slightly higher in energy than the cis isomer).
D21.3 Temperature and Maxwell-Boltzmann Distribution
How do we think about the energies available to each molecule in a reaction mixture, and how does the temperature of the system play into this?
For a collection of molecules, say a 1-L container of gaseous cis-1,2-difluoroethene at 1 bar, the average kinetic energy of all the molecules, KEavg, is directly proportional to the observed temperature:
R is the gas constant, 8.314 J/K·mol.
But the individual molecules do not all have the same KE nor are they all traveling at the same velocity. Recall that the kinetic energy of a molecule of mass (m) and velocity (v) is:
At any given temperature (or KEavg), there is a distribution of individual molecular velocities (or kinetic energies). This distribution is known as the Maxwell-Boltzmann distribution. It shows the fraction of molecules that have a particular velocity. For example, Figure 3 shows the Maxwell-Boltzmann distribution for cis-1,2-difluoroethene gas at various temperatures.
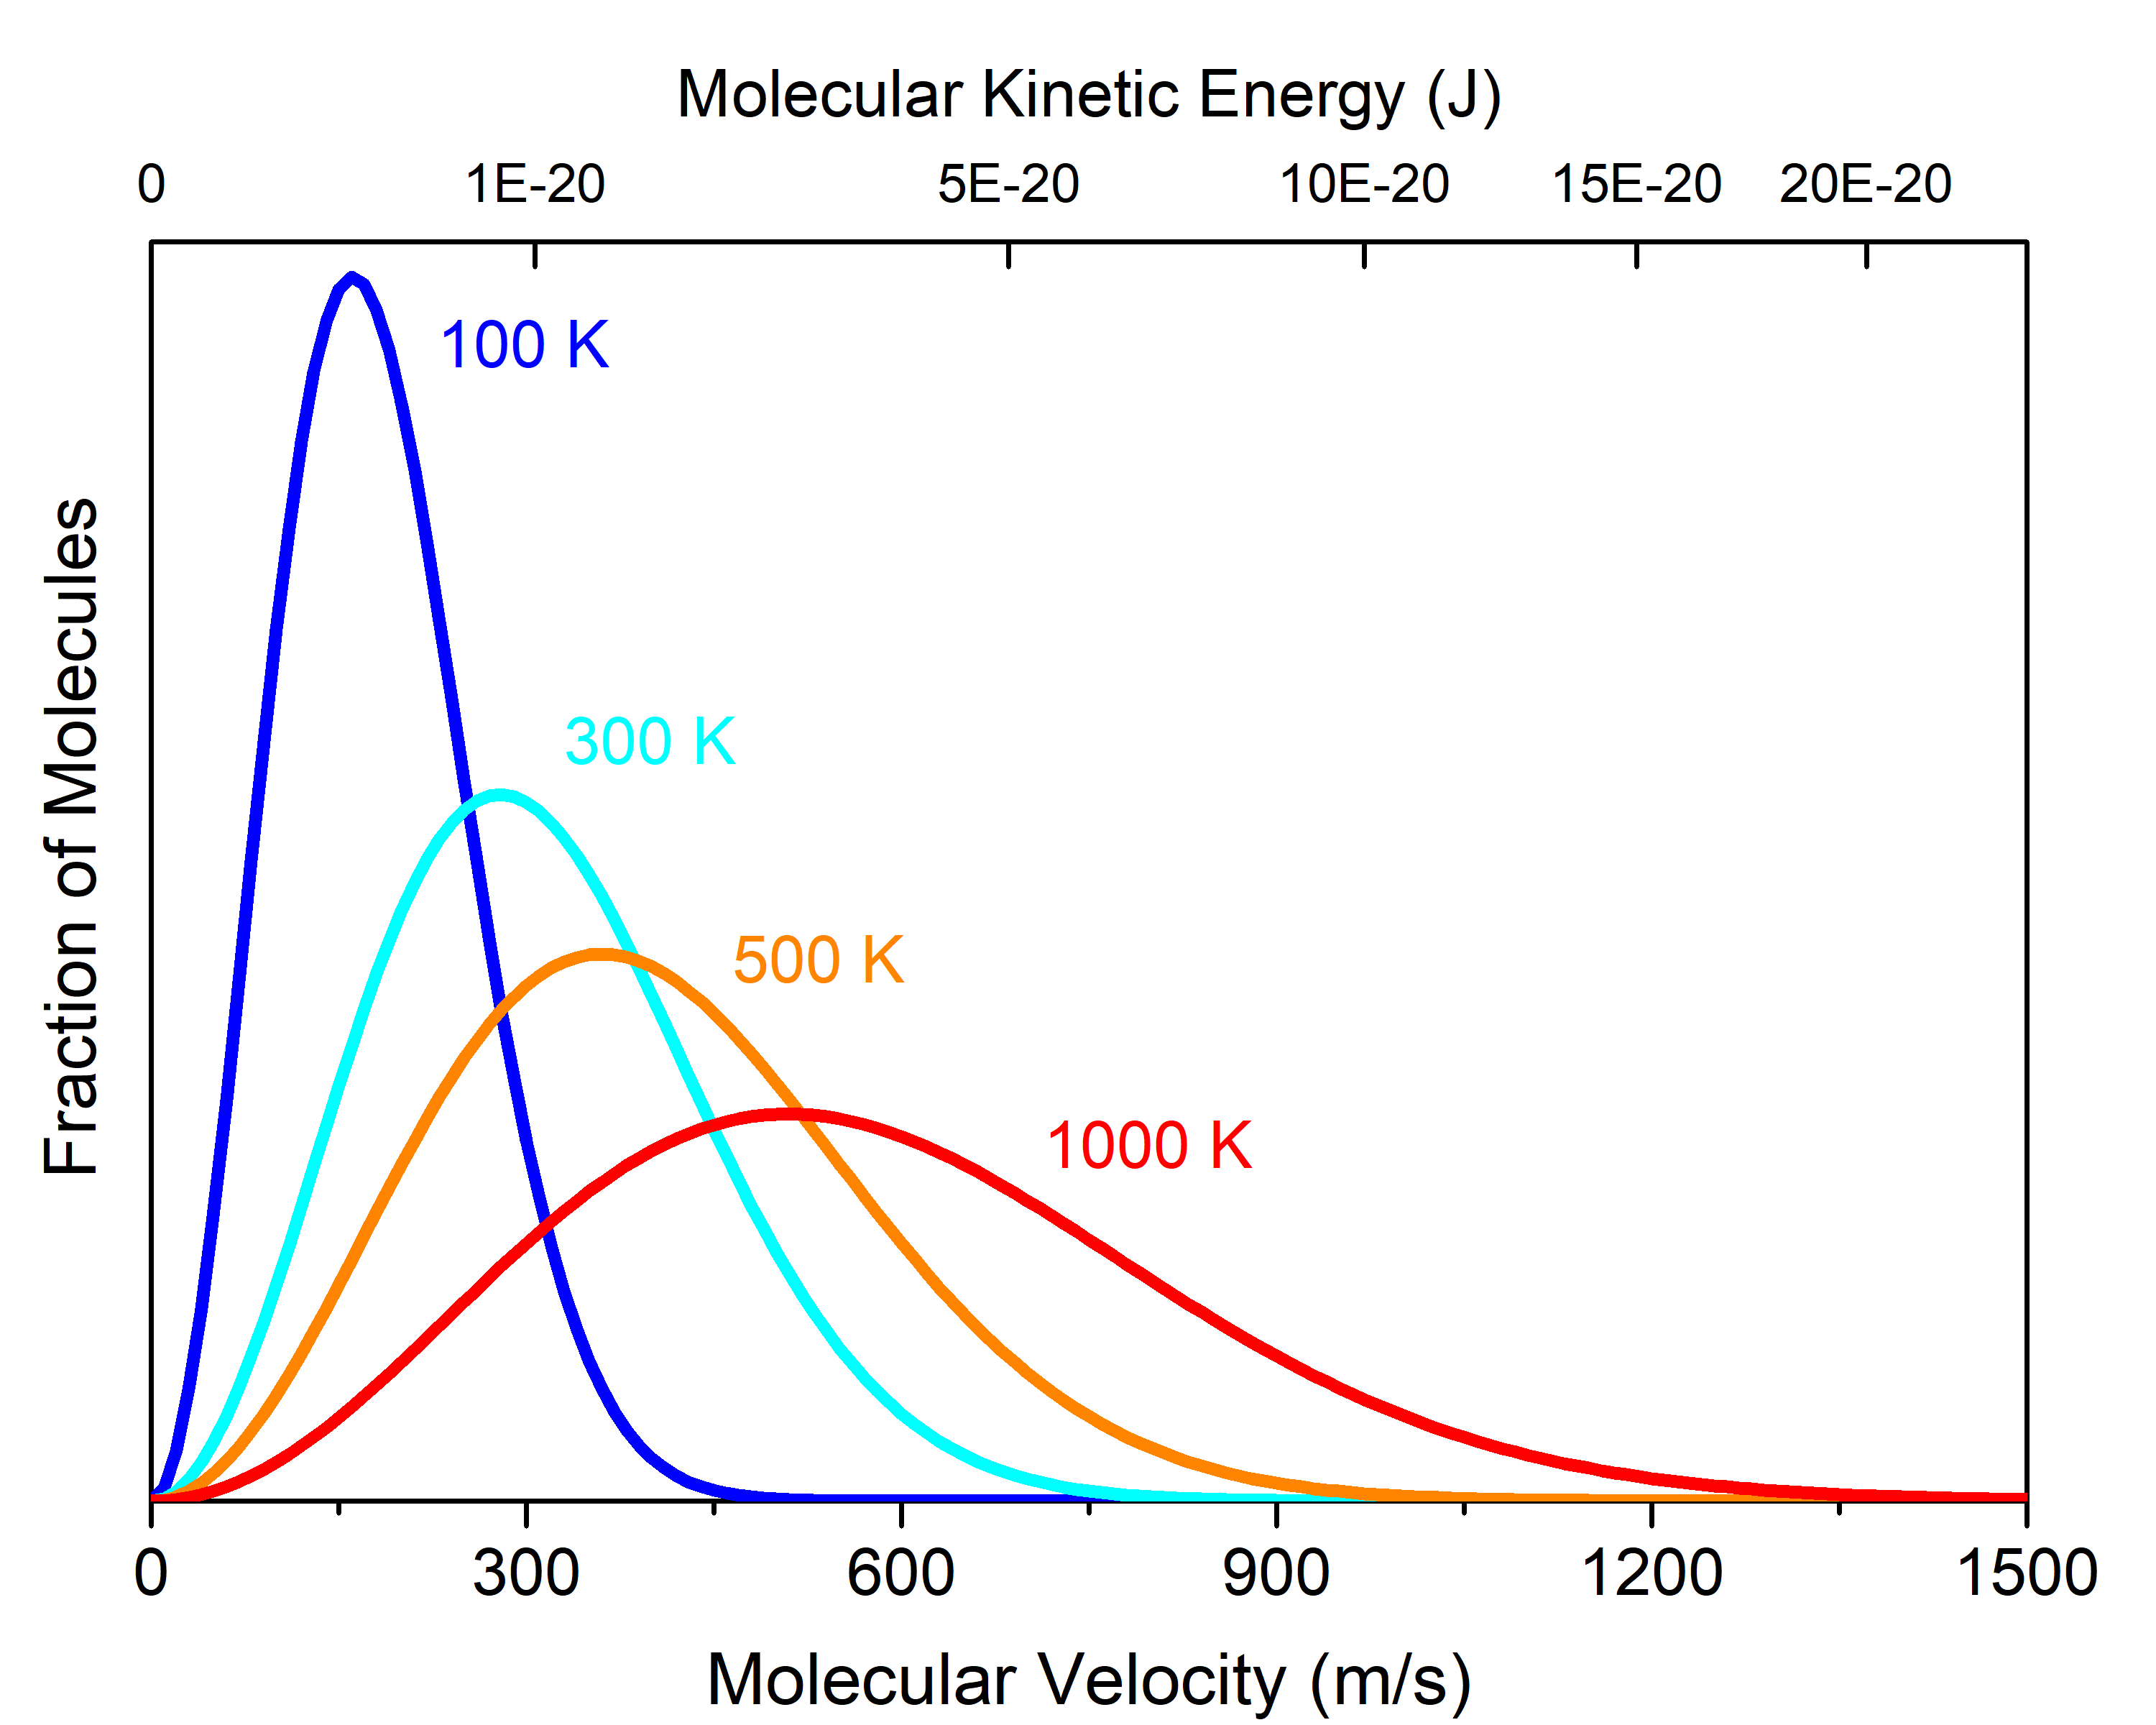
The fraction of cis-1,2-difluoroethene molecules moving at 1200 m/s is much larger when the sample is at 1000 K (red curve) than at 100 K (blue curve). In general, if the temperature of a gas sample increases, its KEavg increases, and the Maxwell-Boltzmann distribution shifts toward higher velocity.
Because the molecules are in constant motion, they will occasionally collide against each other. In a collision, energy can be transferred from one molecule to another, so that one molecule speeds up after the collision while the other slows down. Hence, even while the temperature of the sample and KEavg remain constant, the kinetic energy of any given molecule is continually changing over time.
D21.4 Activation Energy and Temperature
A reaction will not proceed unless the kinetic energy available to the reactant(s) is at least as high as the activation energy (Ea). If the activation energy is much larger than the average kinetic energy of the reactants, Ea >> KEavg, the reaction will occur slowly. This is the case when Ea is large (e.g., the transition state structure involves numerous covalent bonds breaking but few bonds forming) and/or when the temperature of the sample is low. On the other hand, if Ea << KEavg, the reaction will likely proceed rapidly.
For example, Figure 2 indicates that the cis–trans isomerization reaction of cis-1,2-difluoroethene has Ea = 262 × 10-21 J/molecule, corresponding to the energy needed to break the π bond. At 500 K, the Maxwell-Boltzmann distribution (Figure 3, orange curve) shows that nearly all the molecules have KE < 15 × 10-20 J, that is, 150 × 10-21 J, much smaller than Ea. Very few reactant molecules have enough energy to reach the transition state.
Nevertheless, at 500 K, a very small fraction of the molecules is moving very fast (v > 1200 m/s). If such a rapidly moving molecule hits another molecule in a way that causes one carbon to start rotating around the other carbon, and if the hit is hard enough so that after the collision the second molecule has energy greater than Ea , that is, > 262 × 10-21 J/molecule, then the reaction can occur. But this happens very rarely at 500 K.
If the temperature increases, for example to 1000 K, then there is a larger fraction of molecules moving at sufficiently high speed, and more molecules can overcome the Ea barrier and change from a cis isomer into a trans isomer at any given time. Hence, the reaction is occurring faster (rate is higher). On the other hand, at room temperature (300 K), the fraction of molecules that can have sufficient energy to overcome the barrier is so small that the reaction can essentially be considered as not occurring (rate ≈ 0). Hence, at room temperature we can separate the cis and trans isomers and they are considered as different substances.
The fraction of reactant molecules with sufficient energy to react depends on the activation energy of the reaction and the temperature of the reaction mixture. The rate constant is proportional to the fraction of molecules with sufficient energy and that fraction involves an exponential (a power of e, the base of the natural logarithm system).:
Here, R is the ideal gas constant (as 8.314 J mol-1 K-1), T is absolute temperature (in kelvins), and Ea is expressed in J/mol; hence units in the exponent cancel. This proportionality relationship tells us that k is larger when Ea is smaller as well as when T is larger. Hence, increasing the temperature of a reaction has a similar effect on reaction rate as lowering the reaction’s activation energy. This is illustrated in Figure 4.
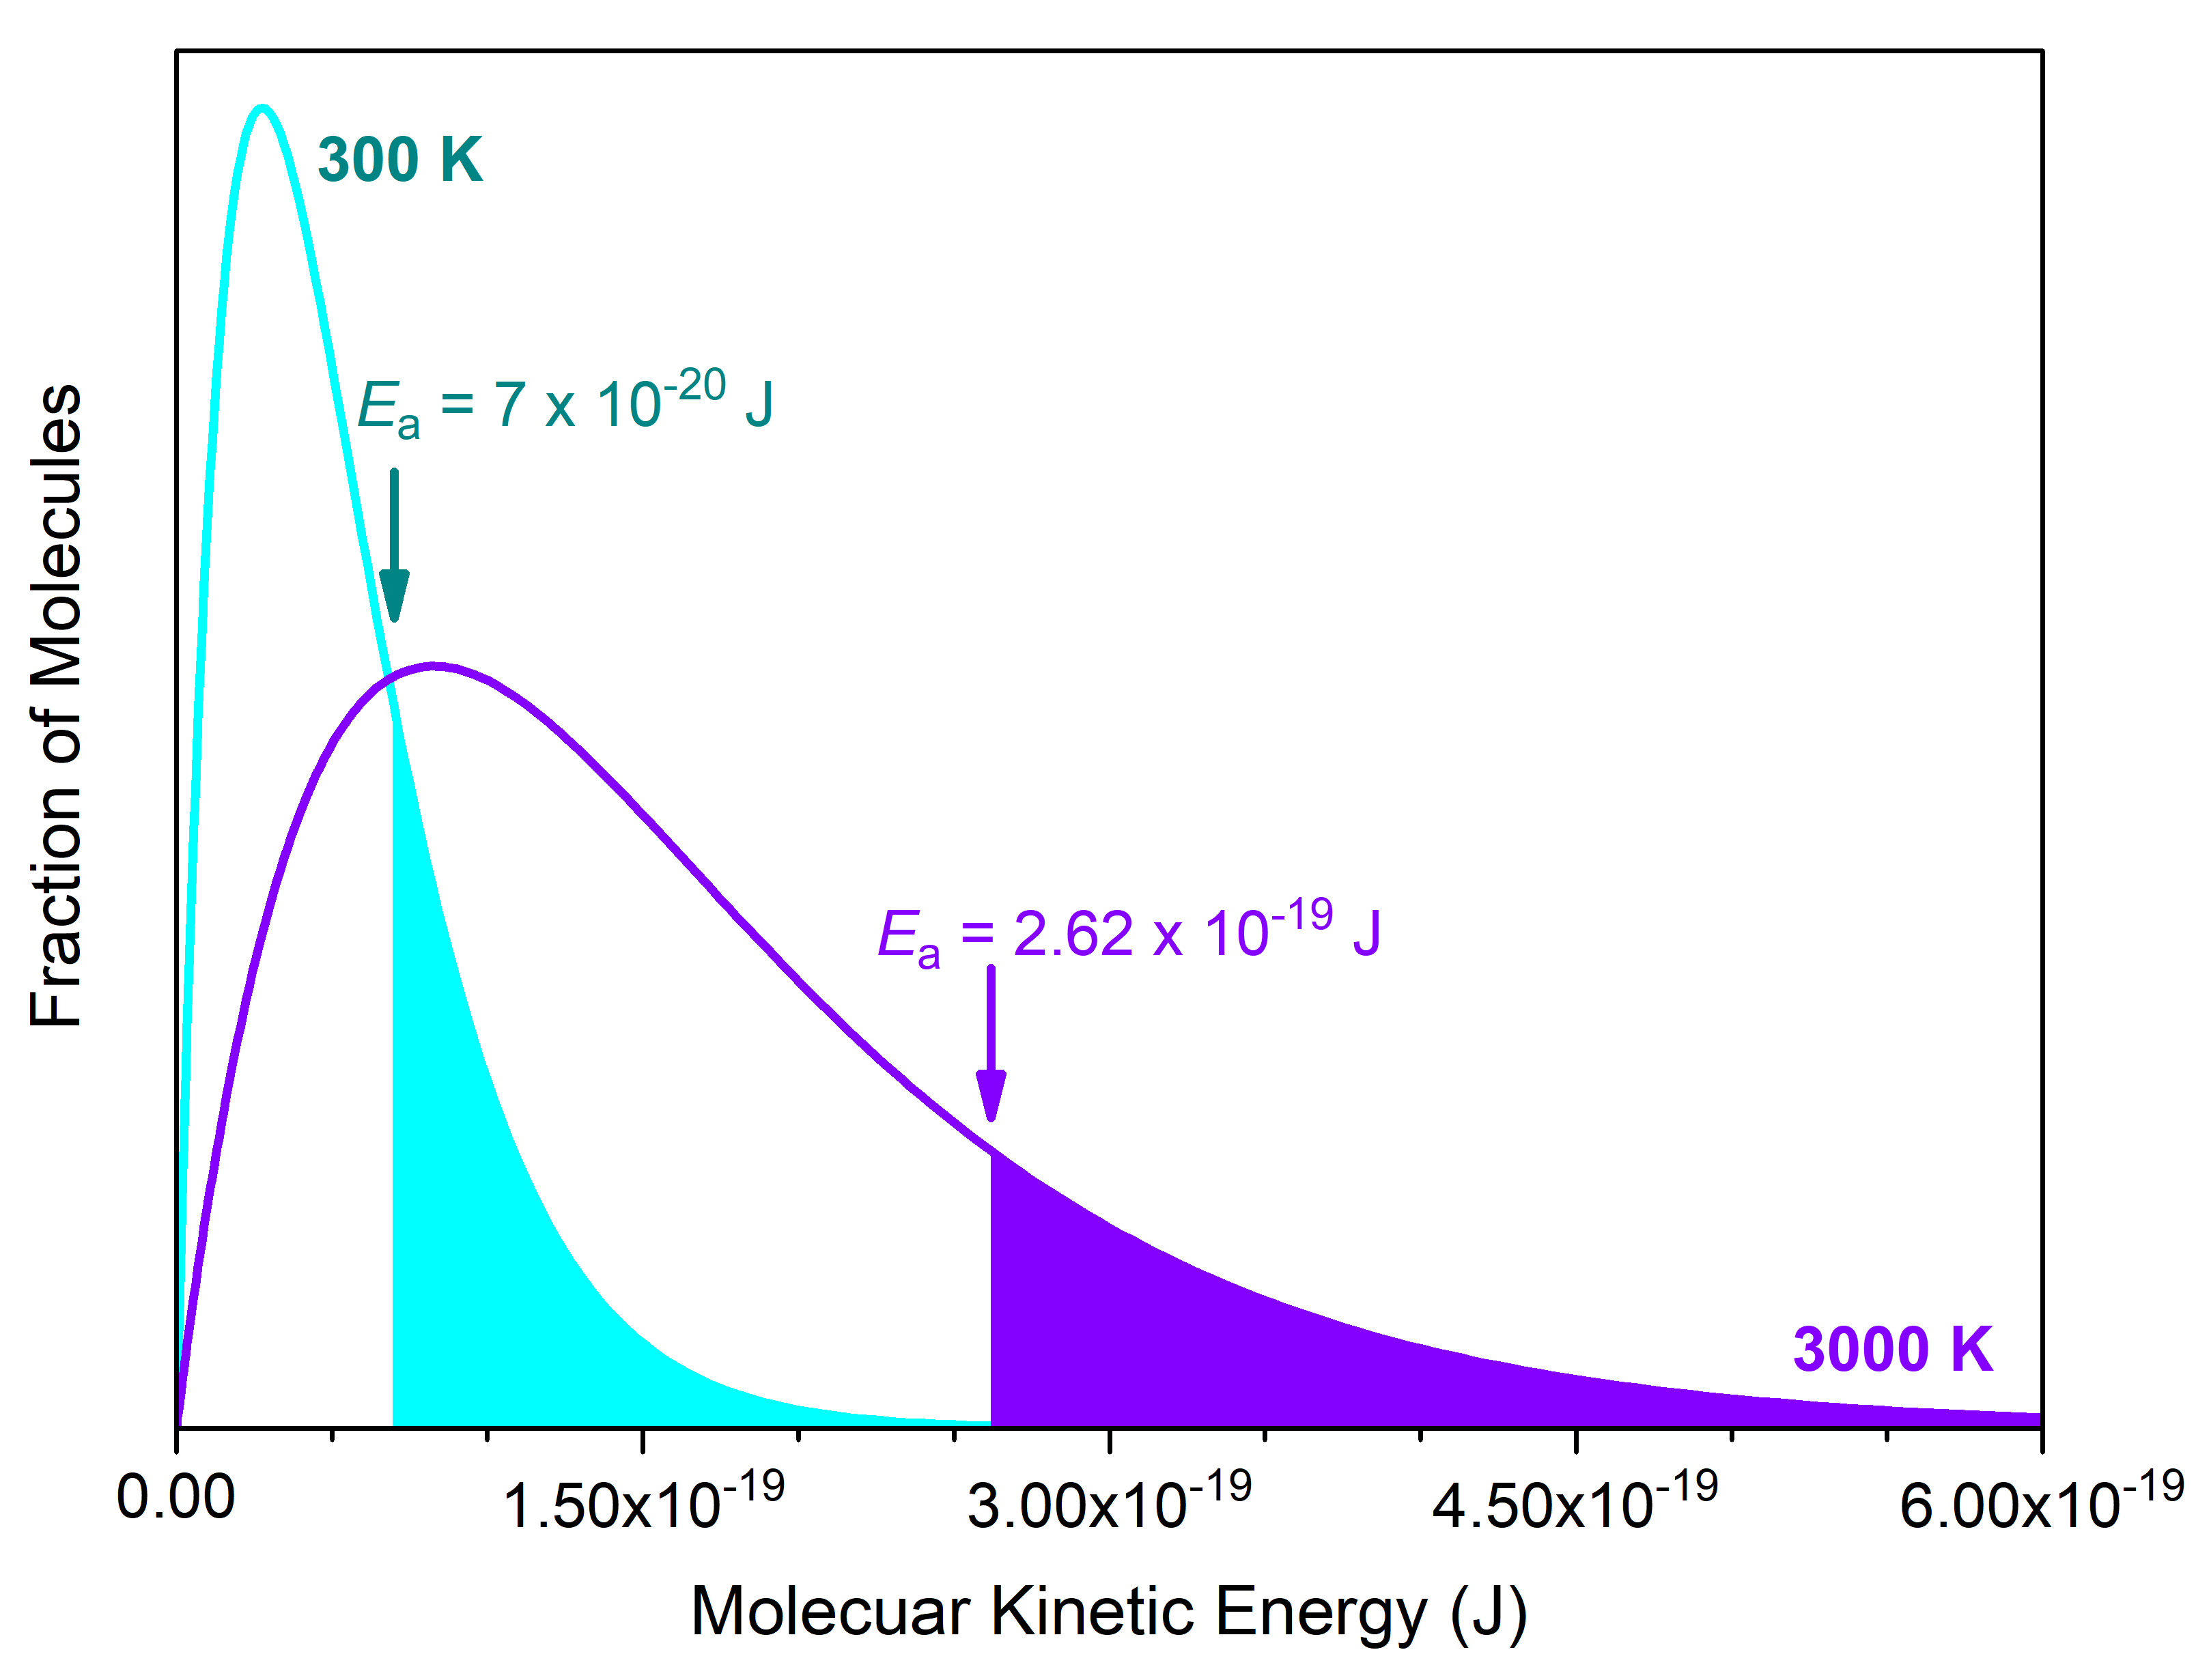
The number of cis-1,2-difluoroethene molecules exceeding the Ea = 2.62 × 10⁻¹⁹ J barrier at 3000 K (violet curve) is shaded in violet. This is the same fraction of molecules (shaded in cyan) that exceeds a lower Ea = 7 × 10-20 J barrier at room temperature (300K, cyan curve). This lower barrier, 7 × 10-20 J/molecule (or 40 kJ/mol), is typical for rotation around a C-C single bond (conformational isomers). Hence, we cannot separate one conformer from another at room temperature, because the reaction for converting between them has a fast rate at room temperature (conformers are not considered as distinct substances).
D21.5 Steric Factor
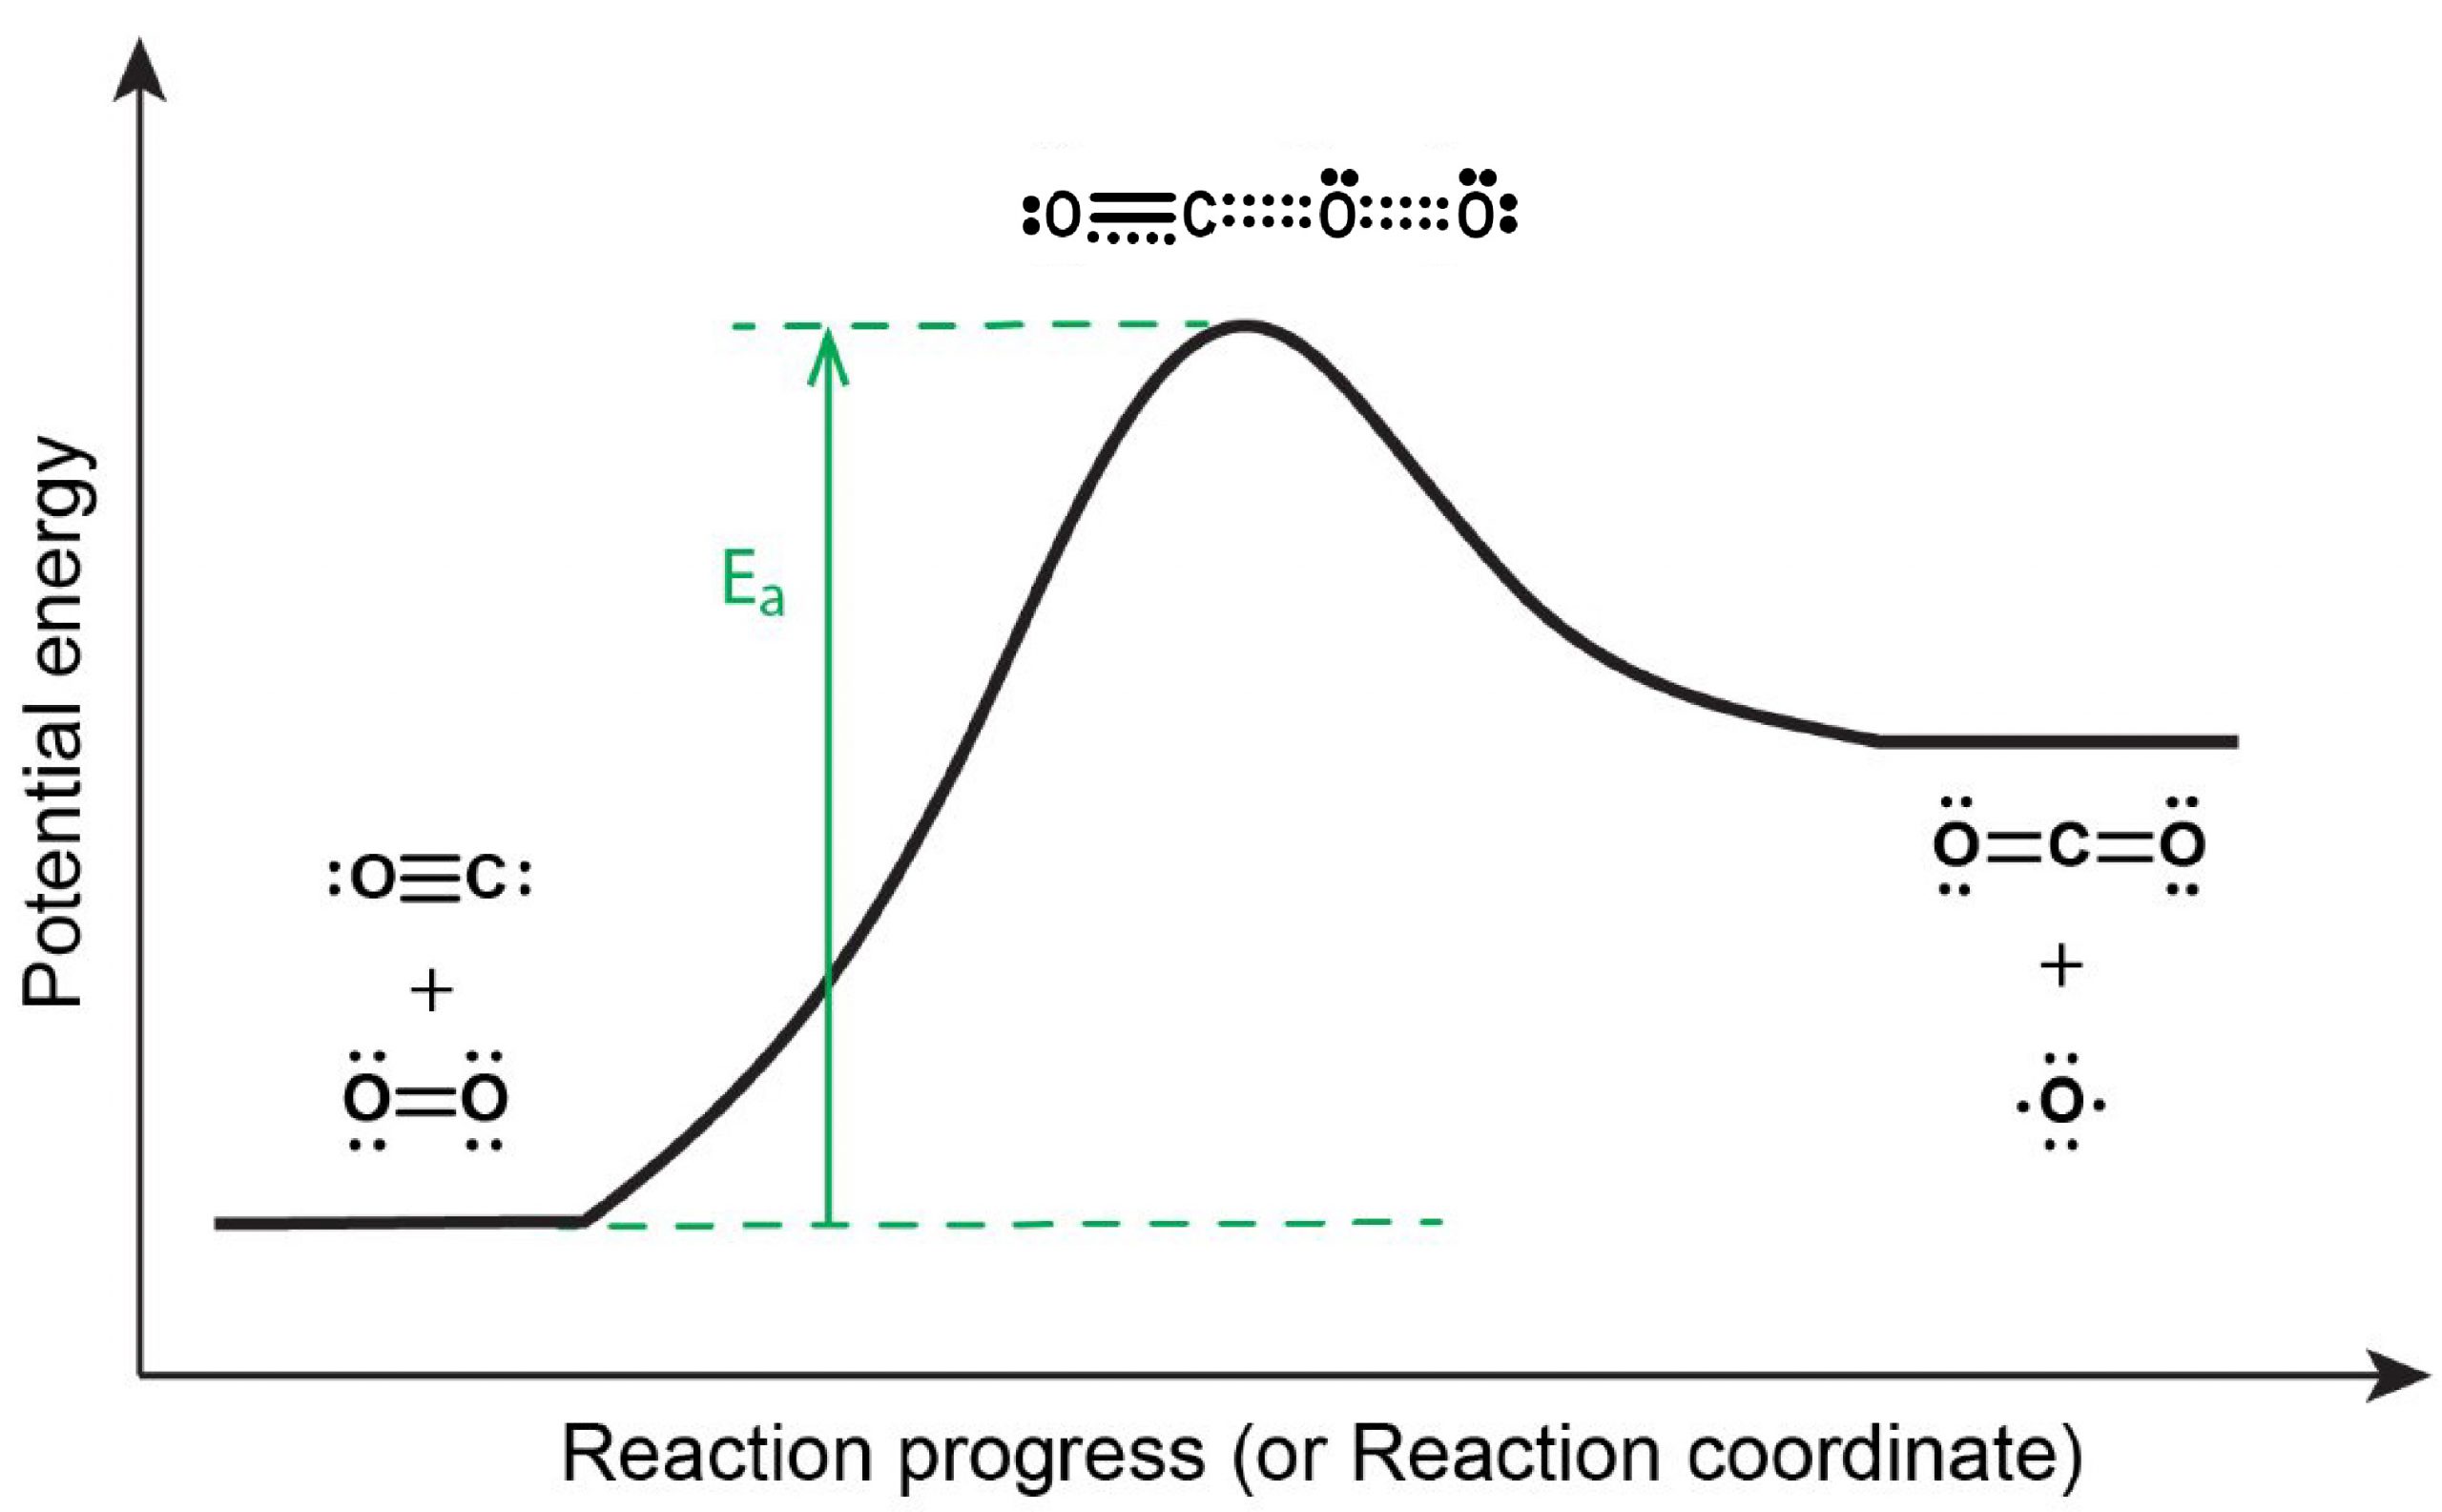
The steric factor is the fraction of collisions energetic enough to react that actually results in reaction. To see why some sufficiently energetic collisions do not always result in a reaction proceeding forward, consider this reaction:
The reaction energy diagram is shown in Figure 5. In order to proceed forward, an O2 molecule needs to collide with a CO molecule with sufficient energy to reach the transition state, where a new C=O double bond begins to form while the O=O double bond breaks and one of the C≡O π bonds also breaks.
Activity 1: Steric Factor
D21.6 Arrhenius Equation and Arrhenius Plot
Taking all that we have discussed above, the relationship between the activation energy, temperature, steric factor and the rate constant for a given reaction is summarized by the Arrhenius equation :
The constant A is called the frequency factor and it depends on the rate at which collisions occur and the fraction of collisions that have the correct orientation (steric factor). The exponential term, e-Ea/RT, is the fraction of the total number of collisions that has sufficient energy to overcome the activation-energy barrier of the reaction.
The Arrhenius equation describes quantitatively much of what we have already discussed about reaction rates. For example, for two similar reactions occurring at the same temperature, the reaction with the higher Ea has the smaller rate constant and hence is slower. Also, a change in conditions that increases the number of collisions with a favorable orientation results in an increase in A and, consequently, an increase in k.
Exercise 1: Calculating Rate Constants
If we take the natural logarithm of both sides of the Arrhenius equation, we have:
which has a standard linear equation format:
This provides a convenient way to experimentally determine Ea and A for a reaction. By measuring k at different temperatures and plotting ln(k) versus 1/T, we can obtain a straight line where slope = –Ea/R and y-intercept = ln(A).
Activity 2: Determining Ea
You can estimate the activation energy without constructing the Arrhenius plot if the rate constant was determined at only two temperatures.
The slope of an Arrhenius plot is:
Therefore:
which can be rearranged as:
Day 21 Pre-class Podia Problem
The rate constant for the rate of decomposition of N2O5 to NO and O2 in the gas phase:
2 N2O5(g) → 4 NO(g) + 3 O2(g)
is 1.66 M-1s-1 at 650. K and 7.39 M-1s-1 at 700. K. Assuming this reaction obeys the Arrhenius equation, calculate the activation energy.
Two days before the next whole-class session, this Podia question will become live on Podia, where you can submit your answer.
