
Unit Four
Day 31: Le Châtelier’s Principle, Equilibrium and Gibbs Free Energy
D31.1 Le Châtelier’s Principle: Change in Temperature
When a chemical reaction is at equilibrium and the temperature changes, the reaction’s equilibrium constant is different at the new temperature. Le Chatelier’s principle can be used to predict which direction an equilibrium shifts and hence whether increasing temperature increases or decreases K. Remember that, according to Le Chatelier’s principle, an equilibrium shifts in a direction that partially counteracts the change in conditions.
Consider the reaction
N2(g) + O2(g) ⇌ 2 NO(g) ΔrH° = 180.5 kJ/mol at 25 °C
As shown by the enthalpy change, this reaction is endothermic: when the reaction takes place in the forward direction, the temperature is lowered. Because enthalpy change does not vary significantly with temperature, the forward reaction is endothermic at all temperatures where all reactants and products are in the gas phase. The reverse reaction is always exothermic.
Suppose that the reaction is at equilibrium at a particular temperature and the temperature is suddenly increased. To partially compensate for the temperature increase, the reaction shifts toward products (the endothermic direction), which lowers the temperature a bit. Thus, when equilibrium is reached at the higher temperature, the concentration of NO is larger and the concentrations of N2 and O2 are lower. This results in a larger value for Kc at the higher temperature.
If the temperature of the reaction is suddenly lowered, the reaction shifts to partially raise the temperature—in the exothermic direction. In this case, the shift is from products to reactants. Thus, at a lower temperature the concentrations of reactants are larger, the concentrations of products are smaller, and the equilibrium constant is smaller.
Summarizing,
- An increase in temperature shifts an equilibrium in the endothermic direction (the direction with positive ΔrH°) because the endothermic reaction partially counteracts the increase in temperature
- A decrease in temperature shifts an equilibrium in the exothermic direction (the direction with negative ΔrH°) because the exothermic reaction partially counteracts the decrease in temperature.
- The different concentrations in the new equilibrium system (after the shift resulting from the temperature change) correspond to a different value for the equilibrium constant.
- The larger the magnitude of ΔrH° is the larger the shift in the equilibrium is and the greater the change in the equilibrium constant is.
Exercise 1: Applying Le Chatelier’s Principle to Temperature Change
D31.2 Catalysts and Equilibrium
A catalyst speeds up the rate of a reaction, allowing the equilibrium to be reached more quickly (by speeding up both forward and reverse reactions). Hence, catalysts influence the kinetics of a reaction. However, a catalyst has no effect on the value of an equilibrium constant nor on equilibrium concentrations.
D31.3 Gibbs Free Energy and Equilibrium
The standard Gibbs free energy change for a reaction indicates whether a reaction is product-favored at equilibrium (ΔrG° < 0) or reactant-favored at equilibrium (ΔrG° > 0). A strongly product-favored reaction (large negative ΔrG°) has a large equilibrium constant (K>> 1) and a strongly reactant-favored reaction (large positive ΔrG°) has a very small equilibrium constant (K<<1, a very small fraction because K cannot be negative). These qualitative statements suggest that there may be a quantitative relationship between the equilibrium constant and ΔrG° for a given reaction.
The reaction quotient, Q, was introduced as a convenient measure of the status of a reaction. When Q < K, the reaction proceeds spontaneously in the forward direction until equilibrium is reached (Q = K). Conversely, if Q > K, the reaction proceeds spontaneously in the reverse direction until equilibrium is achieved.
The relationship between ΔrG°, Q, and K is illustrated graphically in Figure 1 in graphs of G vs. reaction progress. In each graph, on the far left, the system is all reactants and Q = 0. On the far right, the system is all products and Q = ∞. The slope at any point on each graph is ΔrG/Δ(reaction progress). Because Δ(reaction progress) is always positive, the sign of the slope is the sign of ΔrG.
In the light cyan region where Q < K, the slope of the plot is negative, corresponding to negative ΔrG, which predicts spontaneous forward reaction. In the light pink region where Q > K, the slope is positive, corresponding to positive ΔrG which predicts spontaneous reverse reaction. Where the slope is zero (bottom of the curve), ΔrG = 0, and the system is at equilibrium with Q = K. Hence, we can think of reaction progress as rolling down the sides of a Gibbs free energy valley, with equilibrium at the bottom (minimum G).
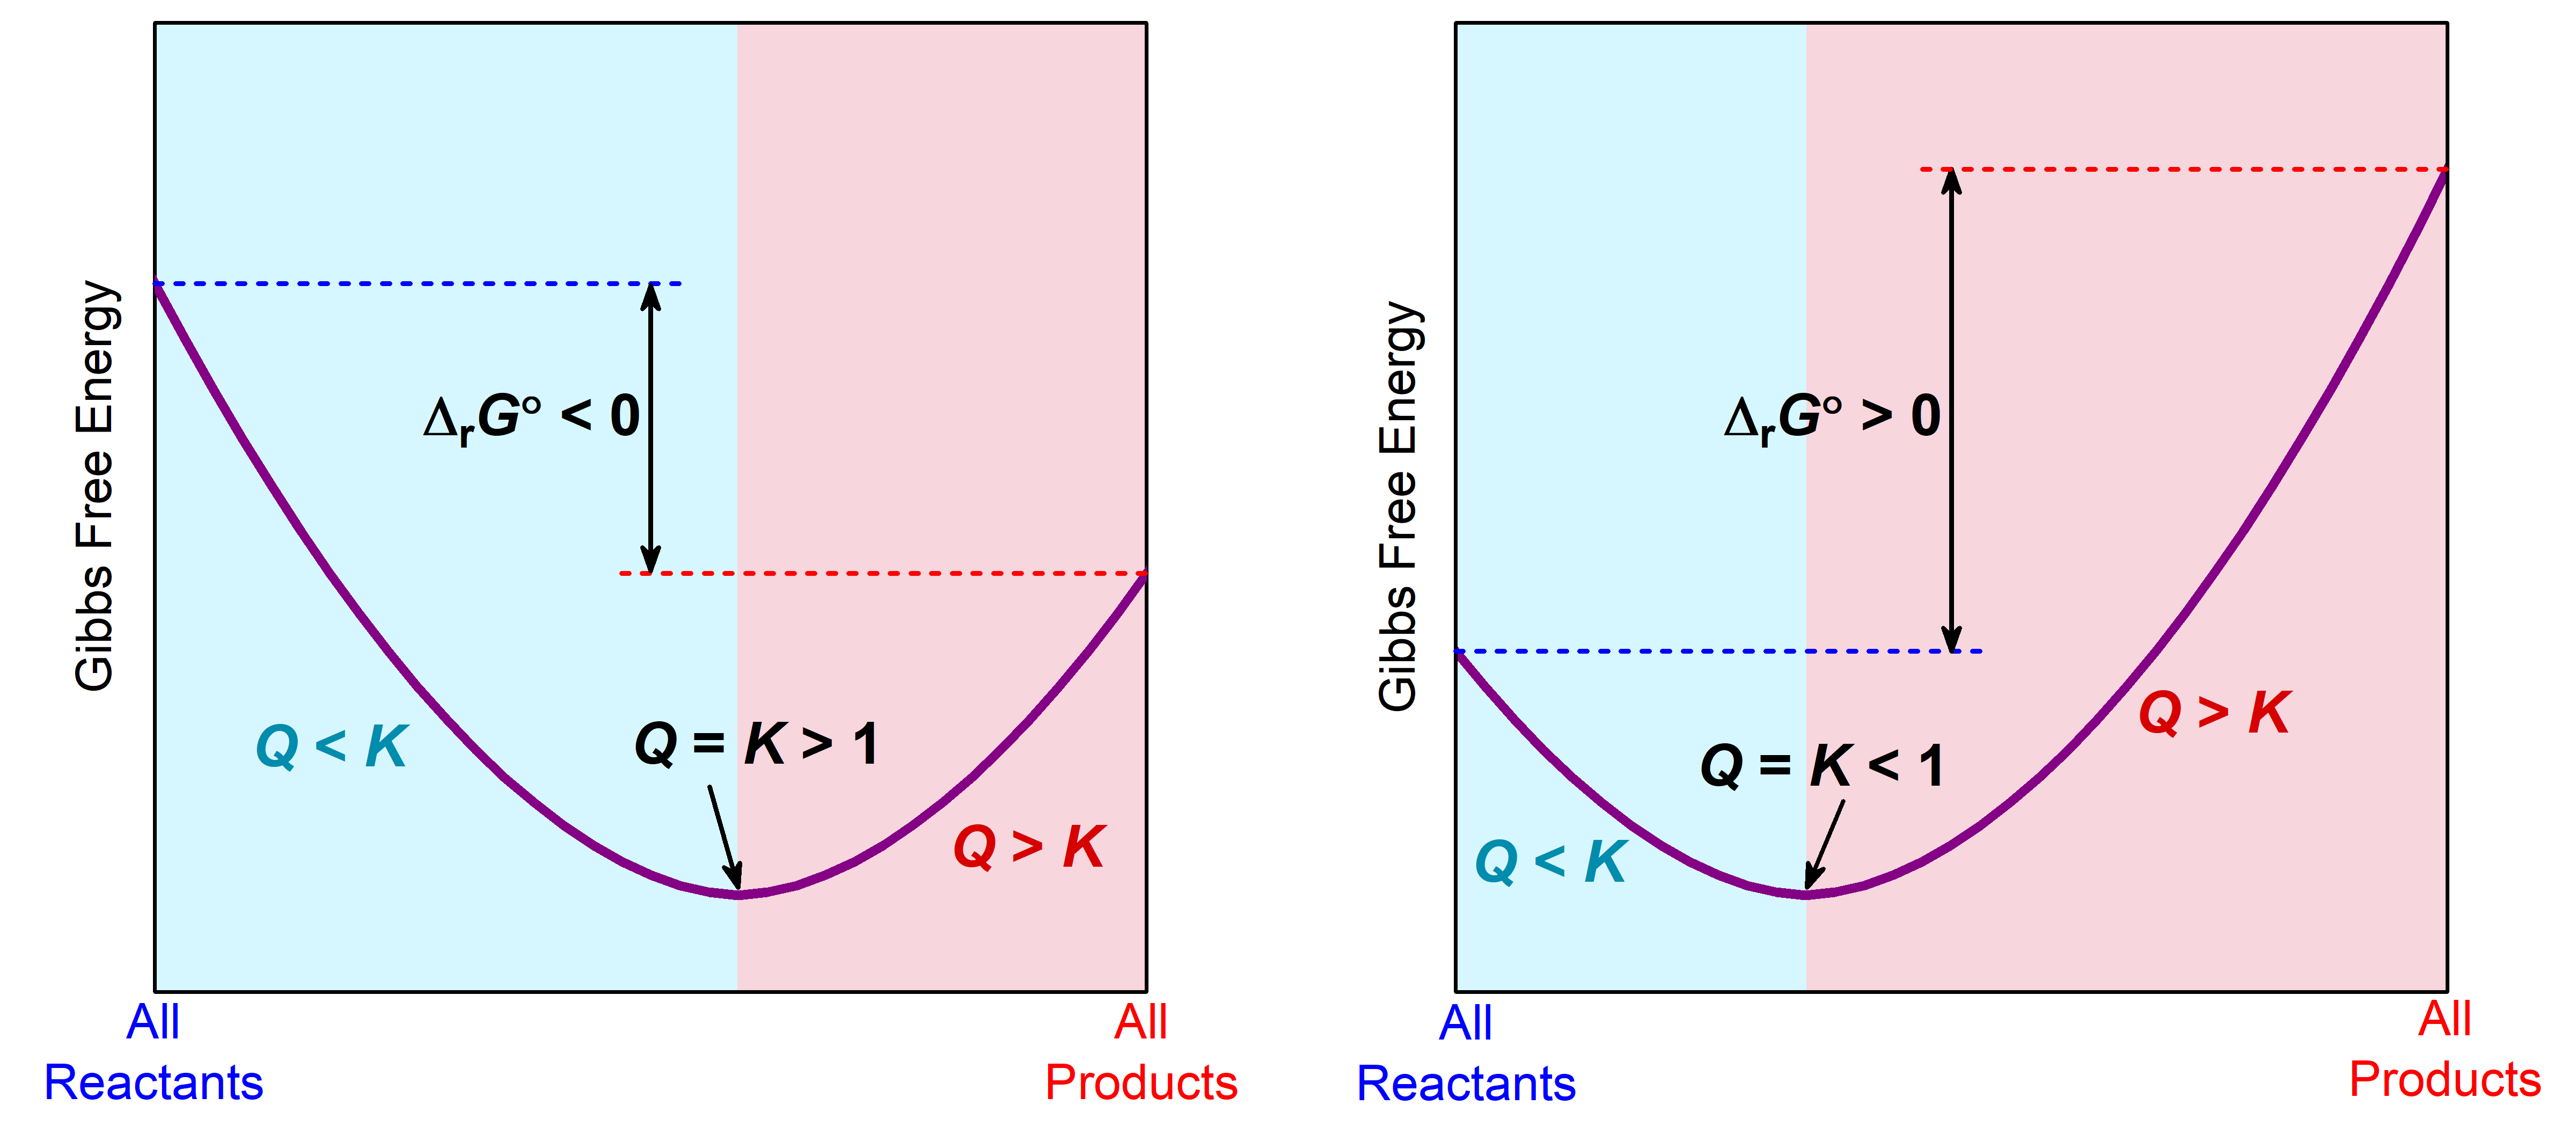
Where equilibrium lies along the reaction progress depends on the sign of ΔrG°. When ΔrG° < 0, the equilibrium (minimum in the curve) is further to the right, indicating that there are more products than reactants when equilibrium is reached. When ΔrG° > 0, the equilibrium is further to the left, indicating that reactants predominate.
The Gibbs free energy change at any point along the reaction progress involves adjusting ΔrG° by the factor RT(lnQ):
At equilibrium, Q = K and ΔrG = 0, therefore:
Note that in these last equations the equilibrium constant is represented by K°. The standard equilibrium constant, Kº, is either the concentration equilibrium constant (Kc) with each concentration divided by the standard-state concentration of 1 M or the pressure equilibrium constant (Kp) with each pressure divided by the standard-state pressure of 1 bar. Hence, Kº is truly unitless. Dividing by the standard-state concentration or pressure means that if concentrations in Kc are expressed in M (mol/L) the numerical values of Kº and Kc are the same. Similarly, if partial pressures in Kp are expressed in bar, the numerical values of Kº and Kp are the same.
| Kº | ΔrG° | |
|---|---|---|
| > 1 | < 0 | Product-favored at equilibrium. |
| < 1 | > 0 | Reactant-favored at equilibrium. |
| = 1 | = 0 | Reactants and products are equally abundant at equilibrium. |
Exercise 2: Gibbs Free Energy and Equilibrium
Exercise 3: Gibbs Free Energy—Nonstandard Conditions
D31.4 Effect of Temperature
Recall that:
Therefore:
This equation can be used to calculate K° at different temperatures, if we assume that ΔrH° and ΔrS° for a reaction have the same values at all temperatures. This is a good, but not perfect, assumption and we will use it in this course unless specified otherwise. It is not a good assumption if there is a phase change for a reactant or a product within the temperature range of interest.
Dividing both sides of the equation by -RT gives:
| lnK° = | [latex]-\frac{{\Delta}_rH^{\circ}}{R}\left(\frac{1}{T}\right)[/latex] | + | [latex]\frac{{\Delta}_rS^{\circ}}{R}[/latex] |
| y = | mx | + | b |
A plot of ln K° vs. [latex]\frac{1}{T}[/latex] is called a van’t Hoff plot. The graph has slope = [latex]-\frac{{\Delta}_rH^{\circ}}{R}[/latex] and intercept = [latex]\frac{{\Delta}_rS^{\circ}}{R}[/latex]. If the concentrations of reactants and products are measured at various temperatures so that K° can be calculated at each temperature, both the reaction entropy change and enthalpy change can be obtained from a van’t Hoff plot.
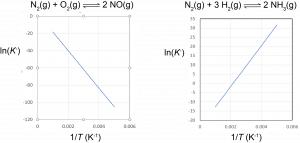
Based on the equation for the van’t Hoff plot, an exothermic reaction (ΔrH° < 0) has K° decreasing with increasing temperature, and an endothermic reaction (ΔrH° > 0) has K° increasing with increasing temperature. This quantitative result agrees with the qualitative predictions made by applying Le Chatelier’s principle. It also shows that the magnitude of ΔrH° dictates how rapidly K° changes as a function of temperature. In contrast, ΔrS° affects the magnitude of K° but not its temperature dependence.
For example, suppose that K°1 and K°2 are the equilibrium constants for a reaction at temperatures T1 and T2, respectively:
Subtracting the two equations yields:
Thus calculating ΔrH° from tabulated ΔfH° and measuring the equilibrium constant at one temperature allows us to calculate the equilibrium constant at any other temperature (assuming that ΔrH° and ΔrS° are independent of temperature).
Exercise 4: Temperature Dependence of the Equilibrium Constant
Podia Question
Ammonium nitrate is an important fertilizer that supplies nitrogen to crops. It also can be used as an explosive to remove tree stumps from farm fields or in terrorist bombings. There are two reactions that can occur to produce the explosive effect. At lower temperatures ammonium nitrate decomposes to form dinitrogen monoxide and water vapor, but at higher temperatures it decomposes explosively to form nitrogen, water vapor, and oxygen. The reaction equations and thermodynamic parameters at 298 K are
(1) NH4NO3(s) → N2O(g) + 2 H2O(g) ΔrH° = −36.026 kJ/mol ΔrS° = 446.42 J K−1 mol−1
(2) NH4NO3(s) → N2(g) + ½ O2(g) + 2 H2O(g) ΔrH° = −118.076 kJ/mol ΔrS° = 520.749 J K−1 mol−1
a) Which of the reactions is(are) product-favored at room temperature? Which of the reactions is(are) product-favored at 1000 K? Explain briefly.
b) Is there a temperature below which one of the reactions is more product-favored and above which the other reaction is more product favored? If there is such a temperature for these two reactions, determine what that temperature is.
Two days before the next whole-class session, this Podia question will become live on Podia, where you can submit your answer.
