
Review Section
Review: Waves
Much of modern technology is based on electromagnetic radiation. Radio waves from a mobile phone, X-rays used by dentists, the energy used to cook food in your microwave, the radiant heat from a toaster wire, and the colors emanating from your television screen are forms of electromagnetic radiation. All exhibit behaviors that can be explained by a wave theory.
A wave is an oscillation or periodic movement that can transfer energy from one point to another. For example, the expansion and compression of air that accompanies a lightning strike generates sound waves (thunder) that can travel several miles and cause your ear drums (and sometimes windows) to vibrate. Kinetic energy is transferred through matter (the air) while the matter remains essentially in place. An insightful example of a wave occurs in sports stadiums when fans in a narrow region of seats rise simultaneously and stand with their arms raised for a few seconds before sitting down again and fans in neighboring sections likewise stand up and sit down in sequence. While this wave can quickly encircle a large stadium, none of the fans actually travel with the wave—they all stay in or above their seats.
All waves are characterized by these properties: wavelength ([latex]\lambda[/latex]), the distance between two consecutive peaks, troughs, or other equivalent points in a wave; frequency ([latex]\nu[/latex]), the number of wave cycles (a cycle corresponds to one complete wavelength) that pass a specified point in space in a specified time; and amplitude (A), the magnitude of the wave’s displacement. See examples shown in Figure 1.
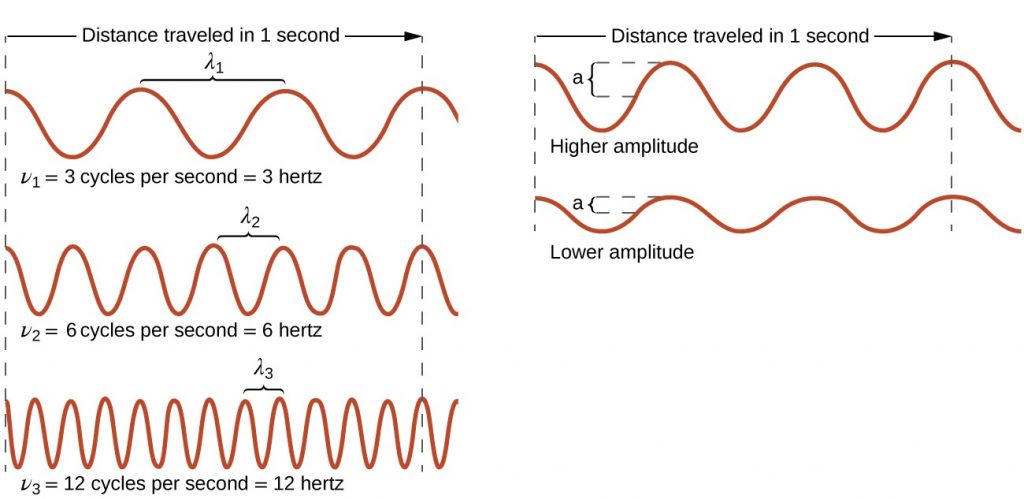
The SI unit for [latex]\lambda[/latex] is meter, and for [latex]\nu[/latex] is hertz (Hz), which is the number of cycles per second [Hz = [latex]\dfrac{1}{s}[/latex] = s−1]. Common multiples are megahertz, (1 MHz = 1 × 10⁶ Hz) and gigahertz (1 GHz = 1 × 10⁹ Hz). The maximum amplitude of a wave shown in Figure 1 corresponds to one-half the height between the peaks and troughs, and is related to the intensity of the wave. For example, for sound waves, greater amplitude means louder sound.
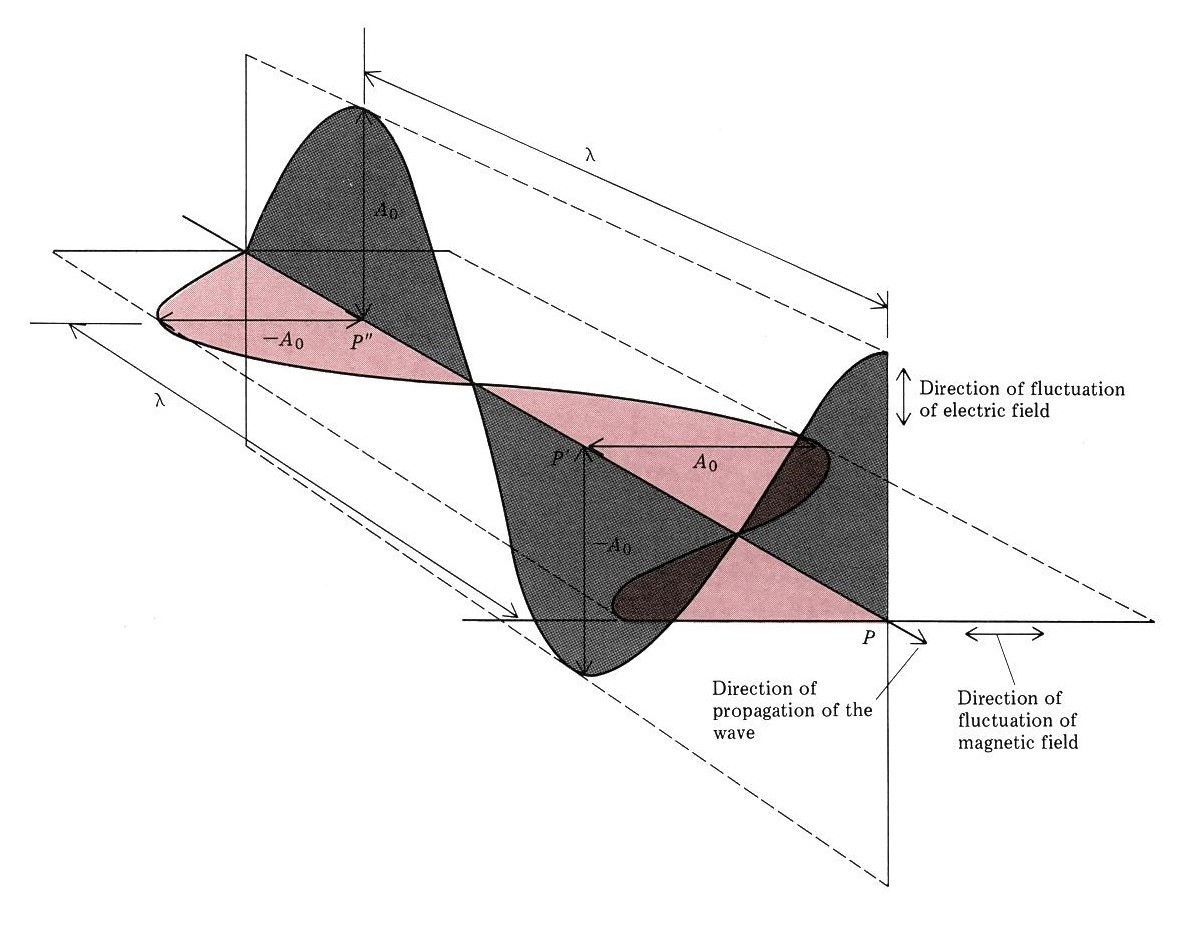
Waves are not restricted to traveling through matter. James Clerk Maxwell proposed the existence of electromagnetic waves, which consist of an electric field oscillating in the x dimension in step with a magnetic field oscillating in the y dimension. The electromagnetic oscillations travel in the z dimension, where x, y, and z are Cartesian coordinate axes. Electromagnetic radiation travels through a vacuum at a constant speed of 2.998 × 10⁸ m/s, the speed of light (c).
The product of a wave’s wavelength and its frequency, [latex]\lambda\nu[/latex], is the speed of the wave. (The wave travels distance [latex]\lambda[/latex] per cycle and the number of cycles traveled in a given time is [latex]\nu[/latex].) Thus, for electromagnetic radiation in a vacuum:
Because the product [latex]\lambda\nu[/latex] is constant, wavelength and frequency are inversely proportional: as the wavelength increases, the frequency decreases.
Exercise 1: Photons and Laser Light
For all exercises, before doing any calculation or looking at the hint, write in your class notebook an explanation of how you plan to work out the problem. Do all the steps in the calculation in your notebook. Once you have arrived at an answer, submit your results below and click the “Check” button to see if it is correct. If one or more parts of your answer is incorrect, go over your work in your notebook carefully and check for errors. “Retry” with your new answer. Look at the hint (click on it to expand for view) only after you have made attempts at answering the question.
Solution: Click the word “solution” to see an explanation of how the result was obtained.
Additional Practice
One of the frequencies used to transmit and receive cellular telephone signals in the United States is 850 MHz. Calculate the wavelength of these radio waves; express your result in meters.
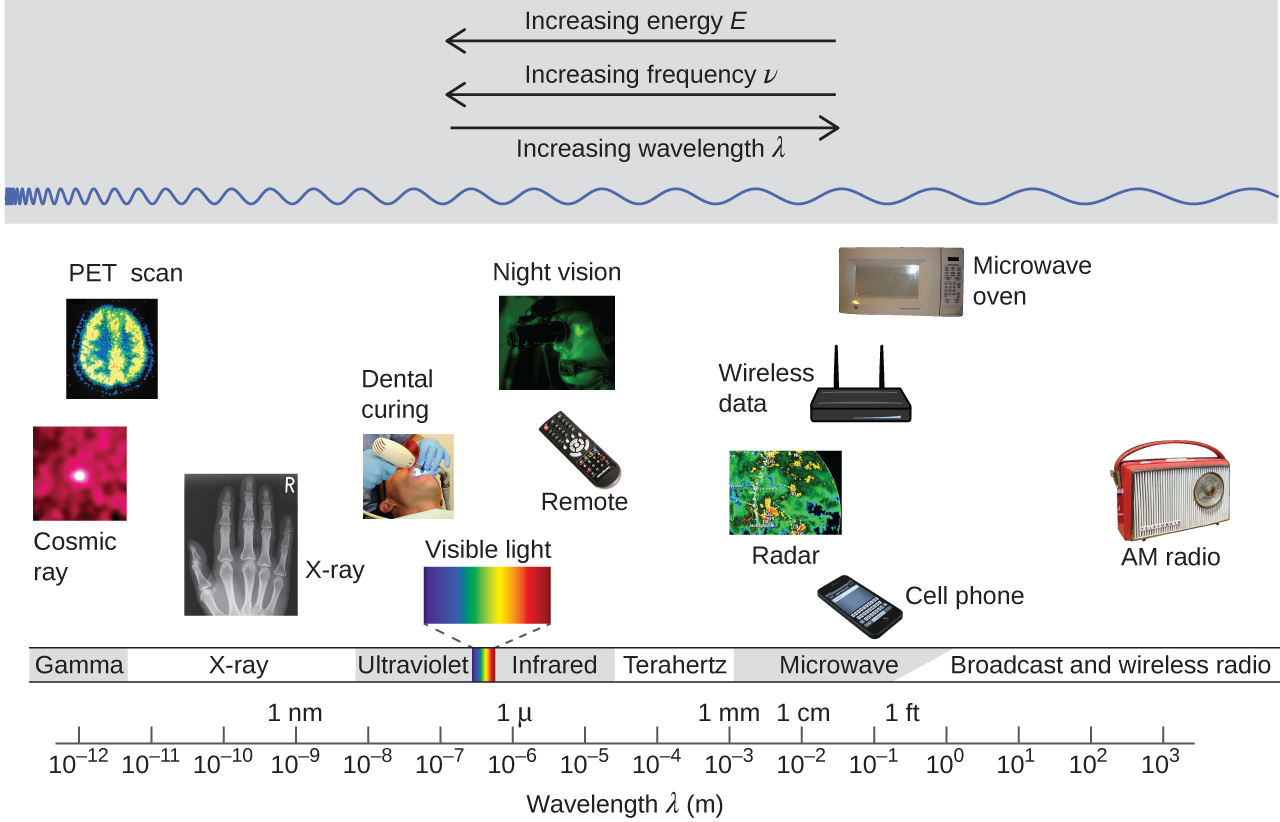
Figure 3 shows the electromagnetic spectrum, the range of all types of electromagnetic radiation. It spans an enormous range—wavelengths of kilometers (103 m) to picometers (10−12 m) have been observed, and the visible-light range makes up only a small portion of it. Given the expansive range of wavelengths, different units are typically used for different parts of the spectrum. For example, radio waves are usually specified as frequencies (typically in units of MHz or GHz), while the visible region is usually specified in wavelengths (typically in units of nm or Å).
D1.2 Wave Properties
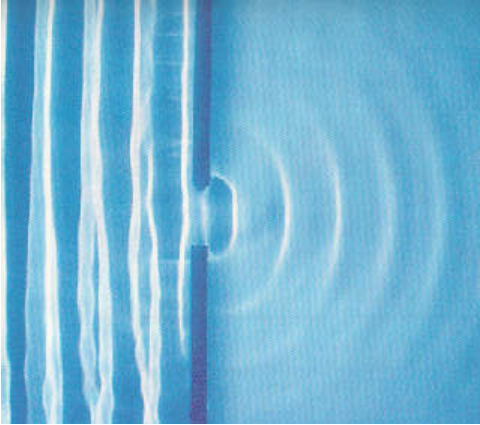 When a wave passes through a pinhole or a very narrow slit, waves fan out on other side of the pinhole or slit. This is shown on the right for water waves moving from left to right through a hole about the same width as the wavelength.
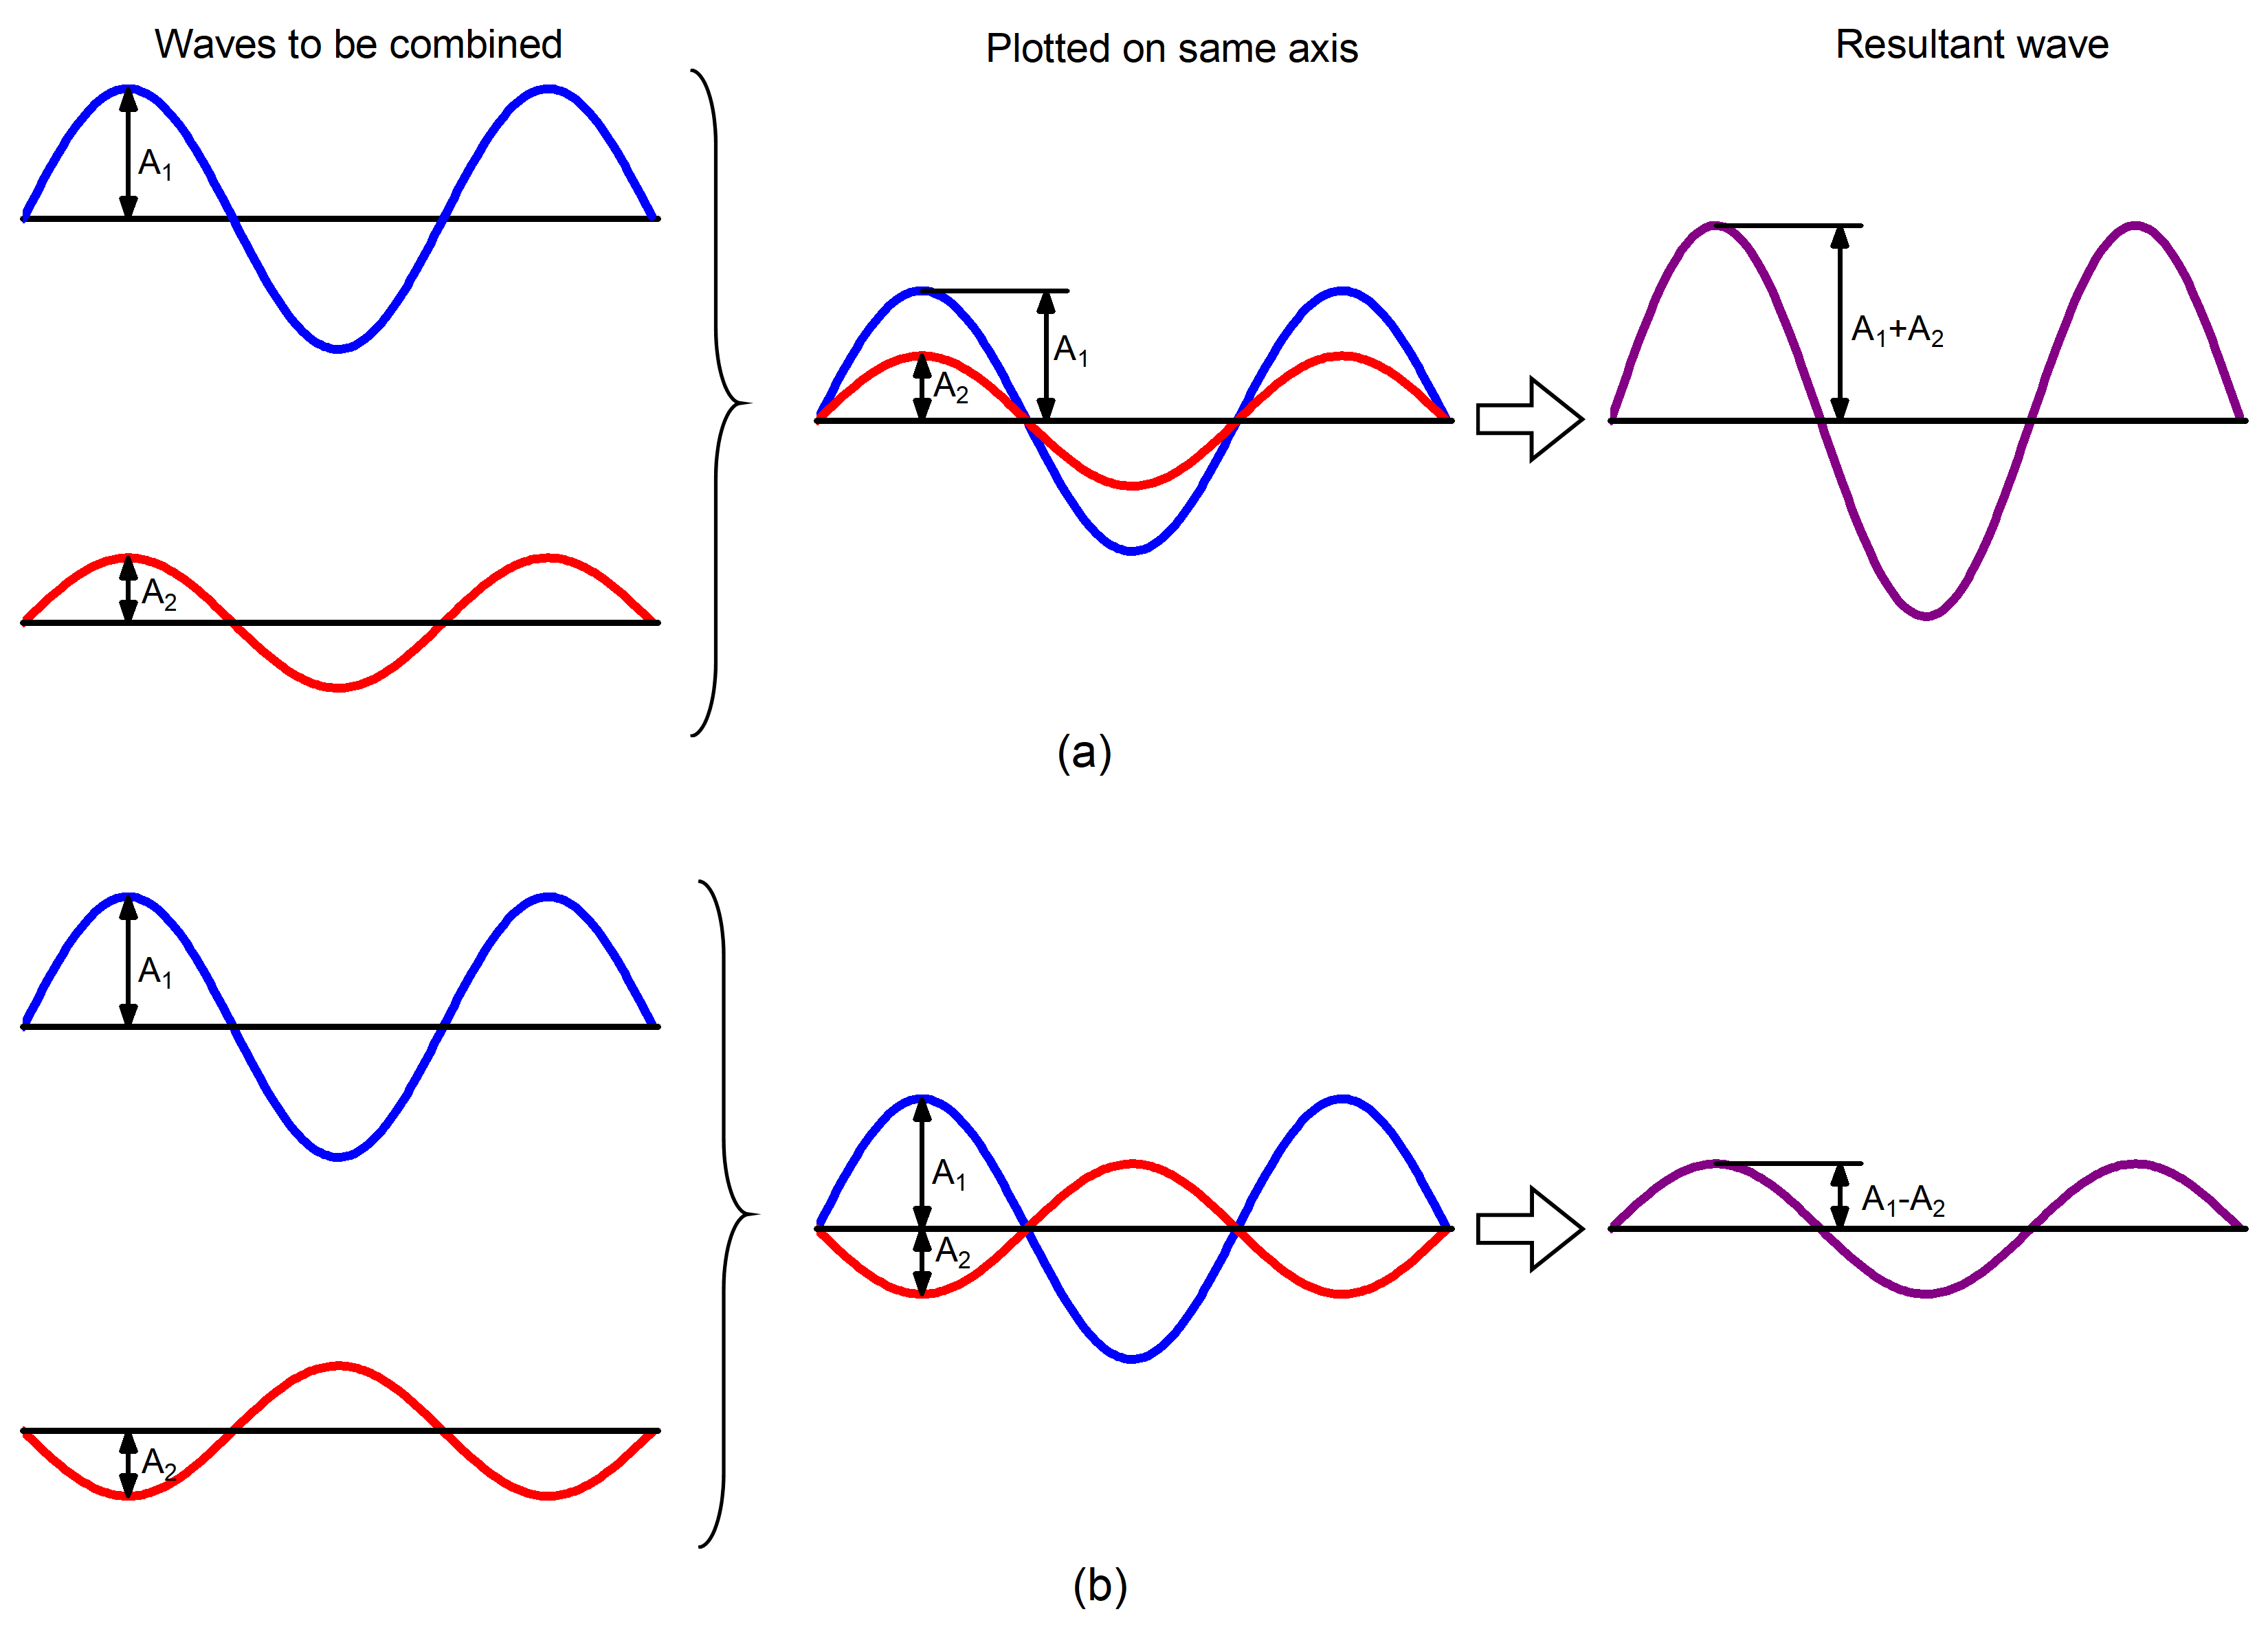
When two or more waves occupy the same region, the total wave amplitude is the sum of the amplitudes of the individual waves. Figure 4 shows that this can result in a larger total amplitude if the amplitudes of the waves have the same mathematical sign (are in phase) or in a smaller total amplitude if the two waves have amplitudes with opposite sign (are out of phase).
Summation of amplitudes of waves leads to interference of one wave with another. Figure 5 shows the interference patterns that arise when blue or red laser light passes through a diffraction grating with many narrow, vertical slits spaced about one wavelength apart.
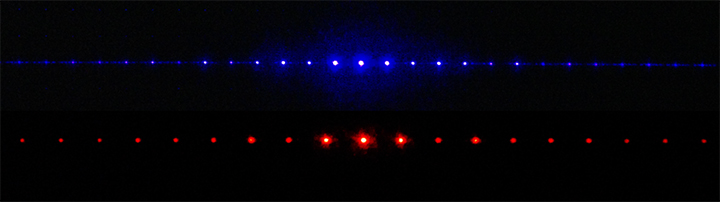
When laser light passes through closely spaced slits, each slit effectively acts as a new source with waves fanning out from it. This results in closely spaced waves coming into contact at the detector (the camera used to make Figure 5). The dark regions in Figure 5 correspond to regions where the peaks for the wave from one slit happen to coincide with the troughs for the wave from the other slit (destructive interference, Fig. 4b), while the brightest regions correspond to regions where the peaks for the two waves (or their two troughs) happen to coincide (constructive interference, Fig. 4a).
Exercise 2: Interference Patterns
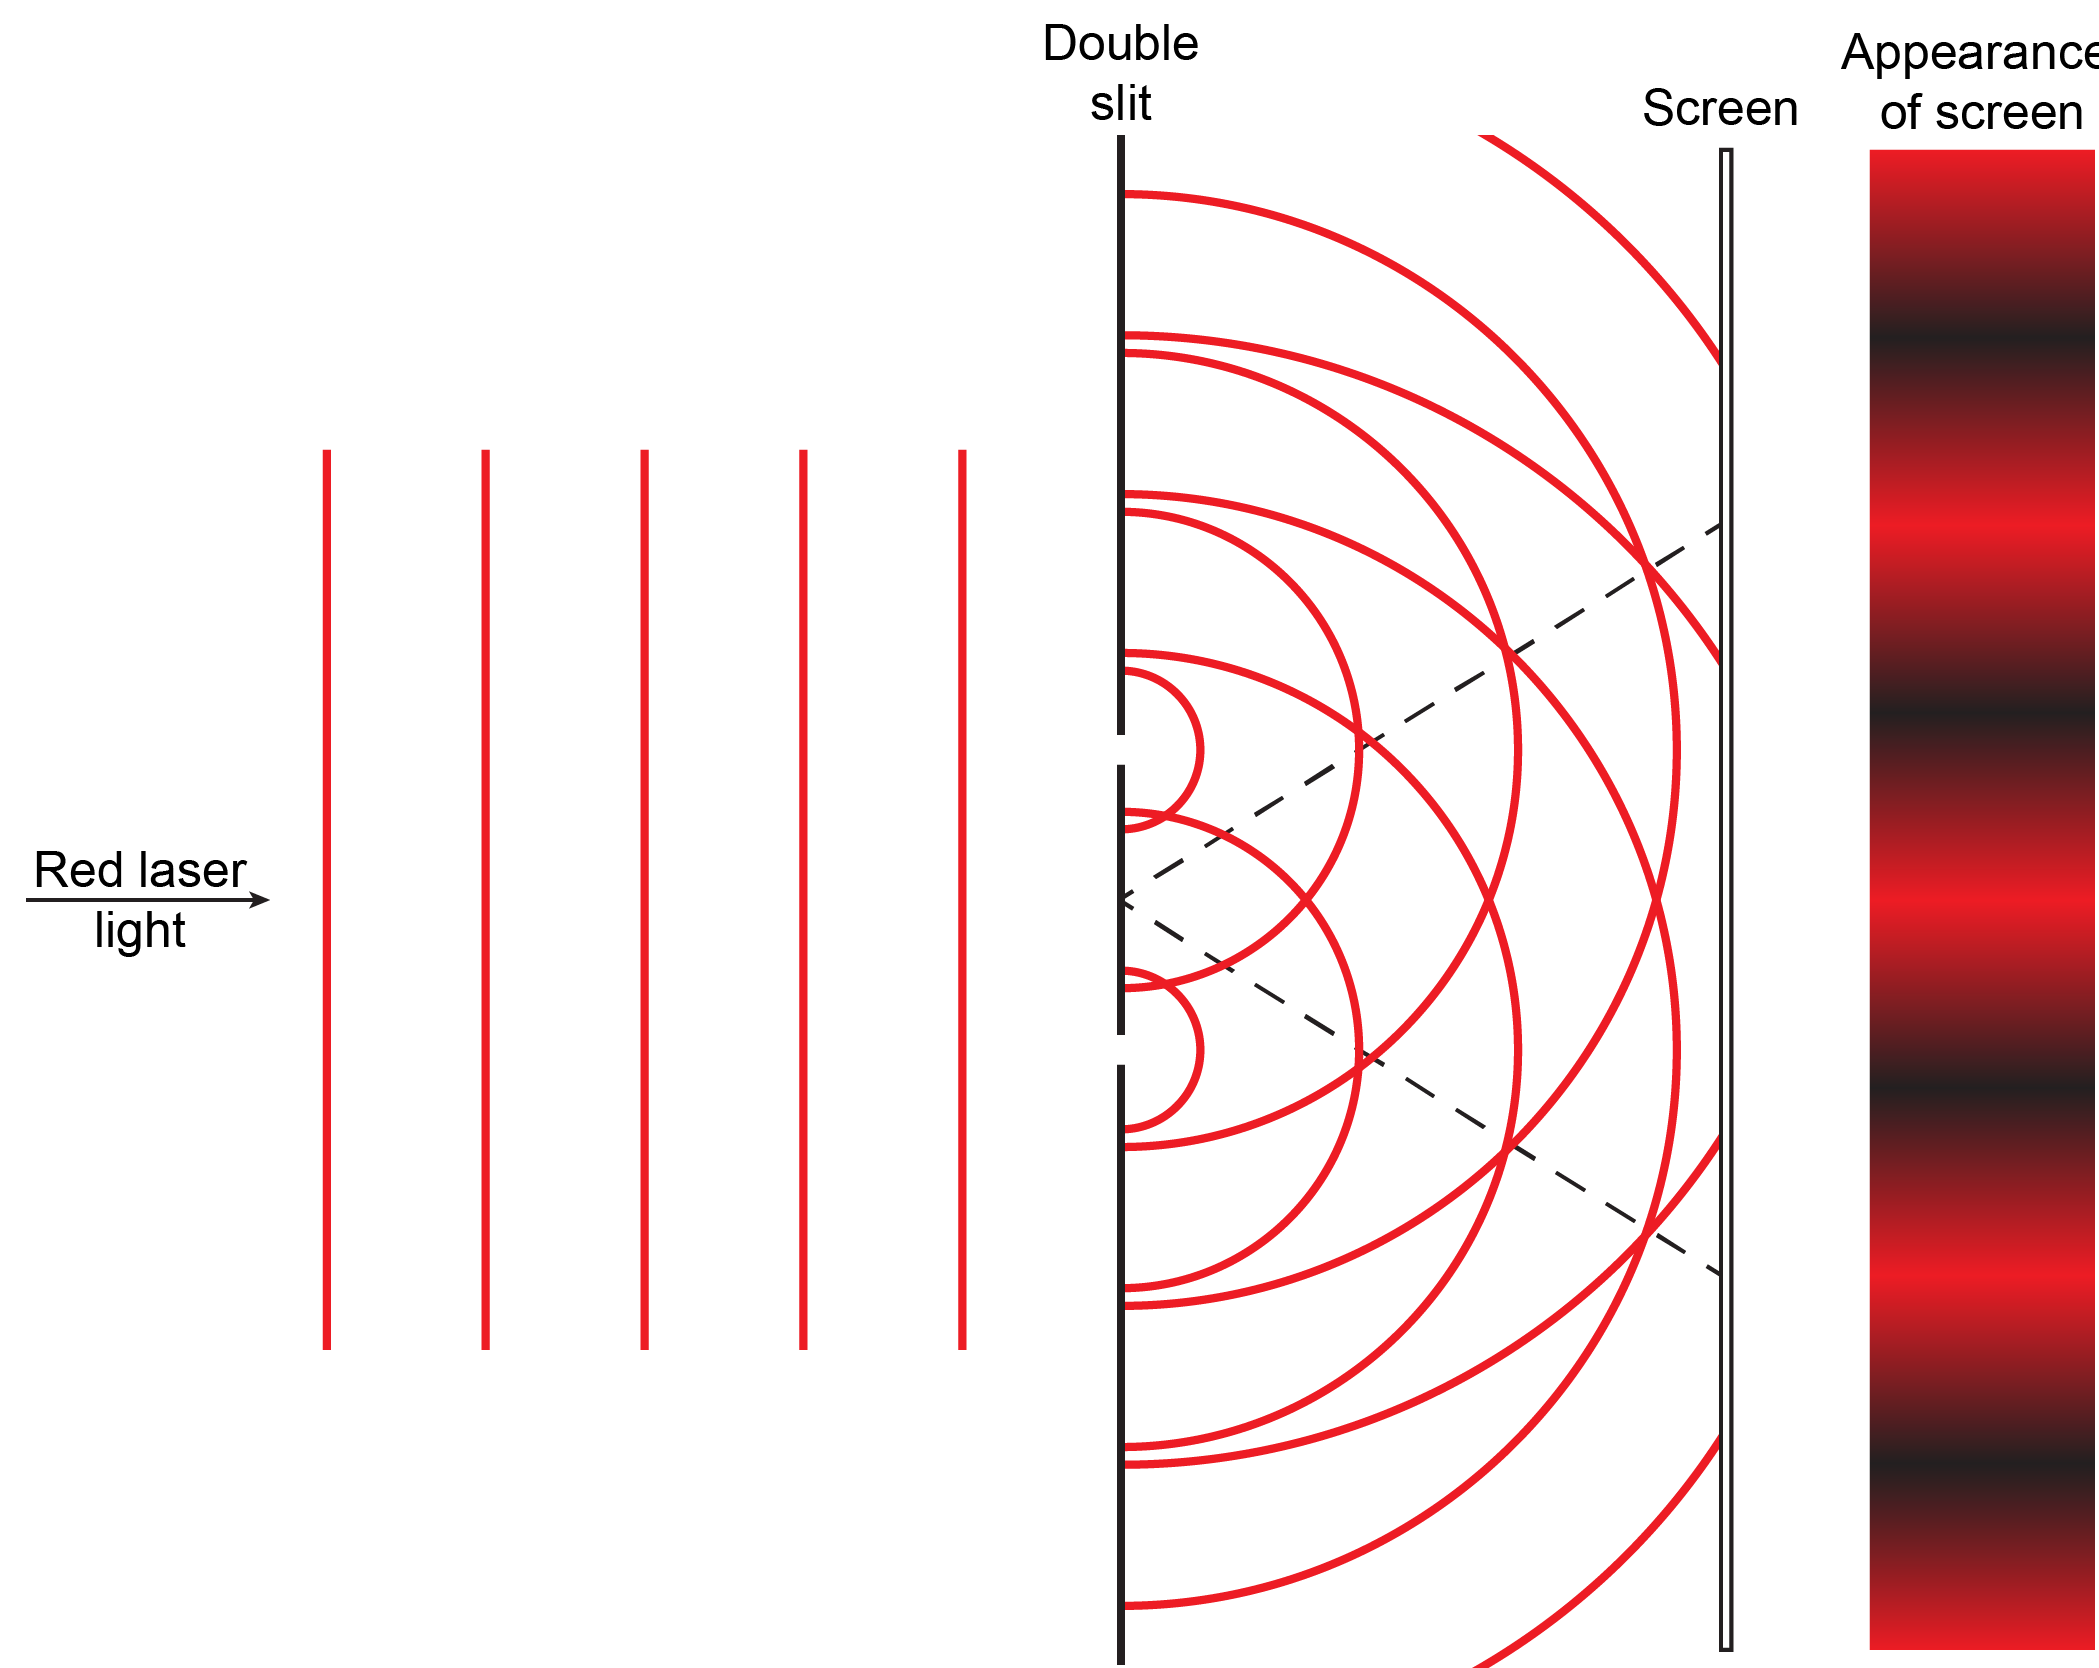
Based on what you have just read about summation of waves and interference patterns, write a paragraph that explains to a fellow student the meaning of the figure and how the figure illustrates the origin of interference patterns. If you are studying with another student each should write an explanation and then try it out on the other. Then compare with the result below and make sure each of you understands the explanations.
Result: Do not click the word “result” until you have written an explanation.
Additional Practice 1
Extend your explanation of the figure to account for the closer spacing in the interference pattern for blue light compared to red light. It might be useful to draw another figure.
Additional Practice 2
Suppose that instead of waves, there is a stream of small particles (say, grains of sand or particles of dust) passing through the pair of slits. Assume that the particles are all traveling in exactly the same direction before they hit the double slit. Draw a diagram like the one above to show the pattern on the screen. Explain in words how and why the particle pattern may differ from the wave pattern.
Interference patterns are an inherent property of wave motion but they cannot be explained by particles moving according to the laws of classical mechanics. Particles would move in straight lines through a slit or pinhole and produce a single bright line or spot.
