
Unit Five
Day 39: Voltaic Cells, Half-Cell Potentials
D39.1 Voltaic Cell Potential
When a voltaic cell is connected to a load, such as a light bulb, an electric current flows because there is a difference in electrical potential between the two electrodes. That electrical potential difference can be measured with a potentiometer (that is, a voltmeter). For an accurate measurement, the voltmeter must have a very high resistance so that no current flows; otherwise the voltage would drop from its highest possible value.
The voltaic cell shown in Figure 1, involves the spontaneous reaction
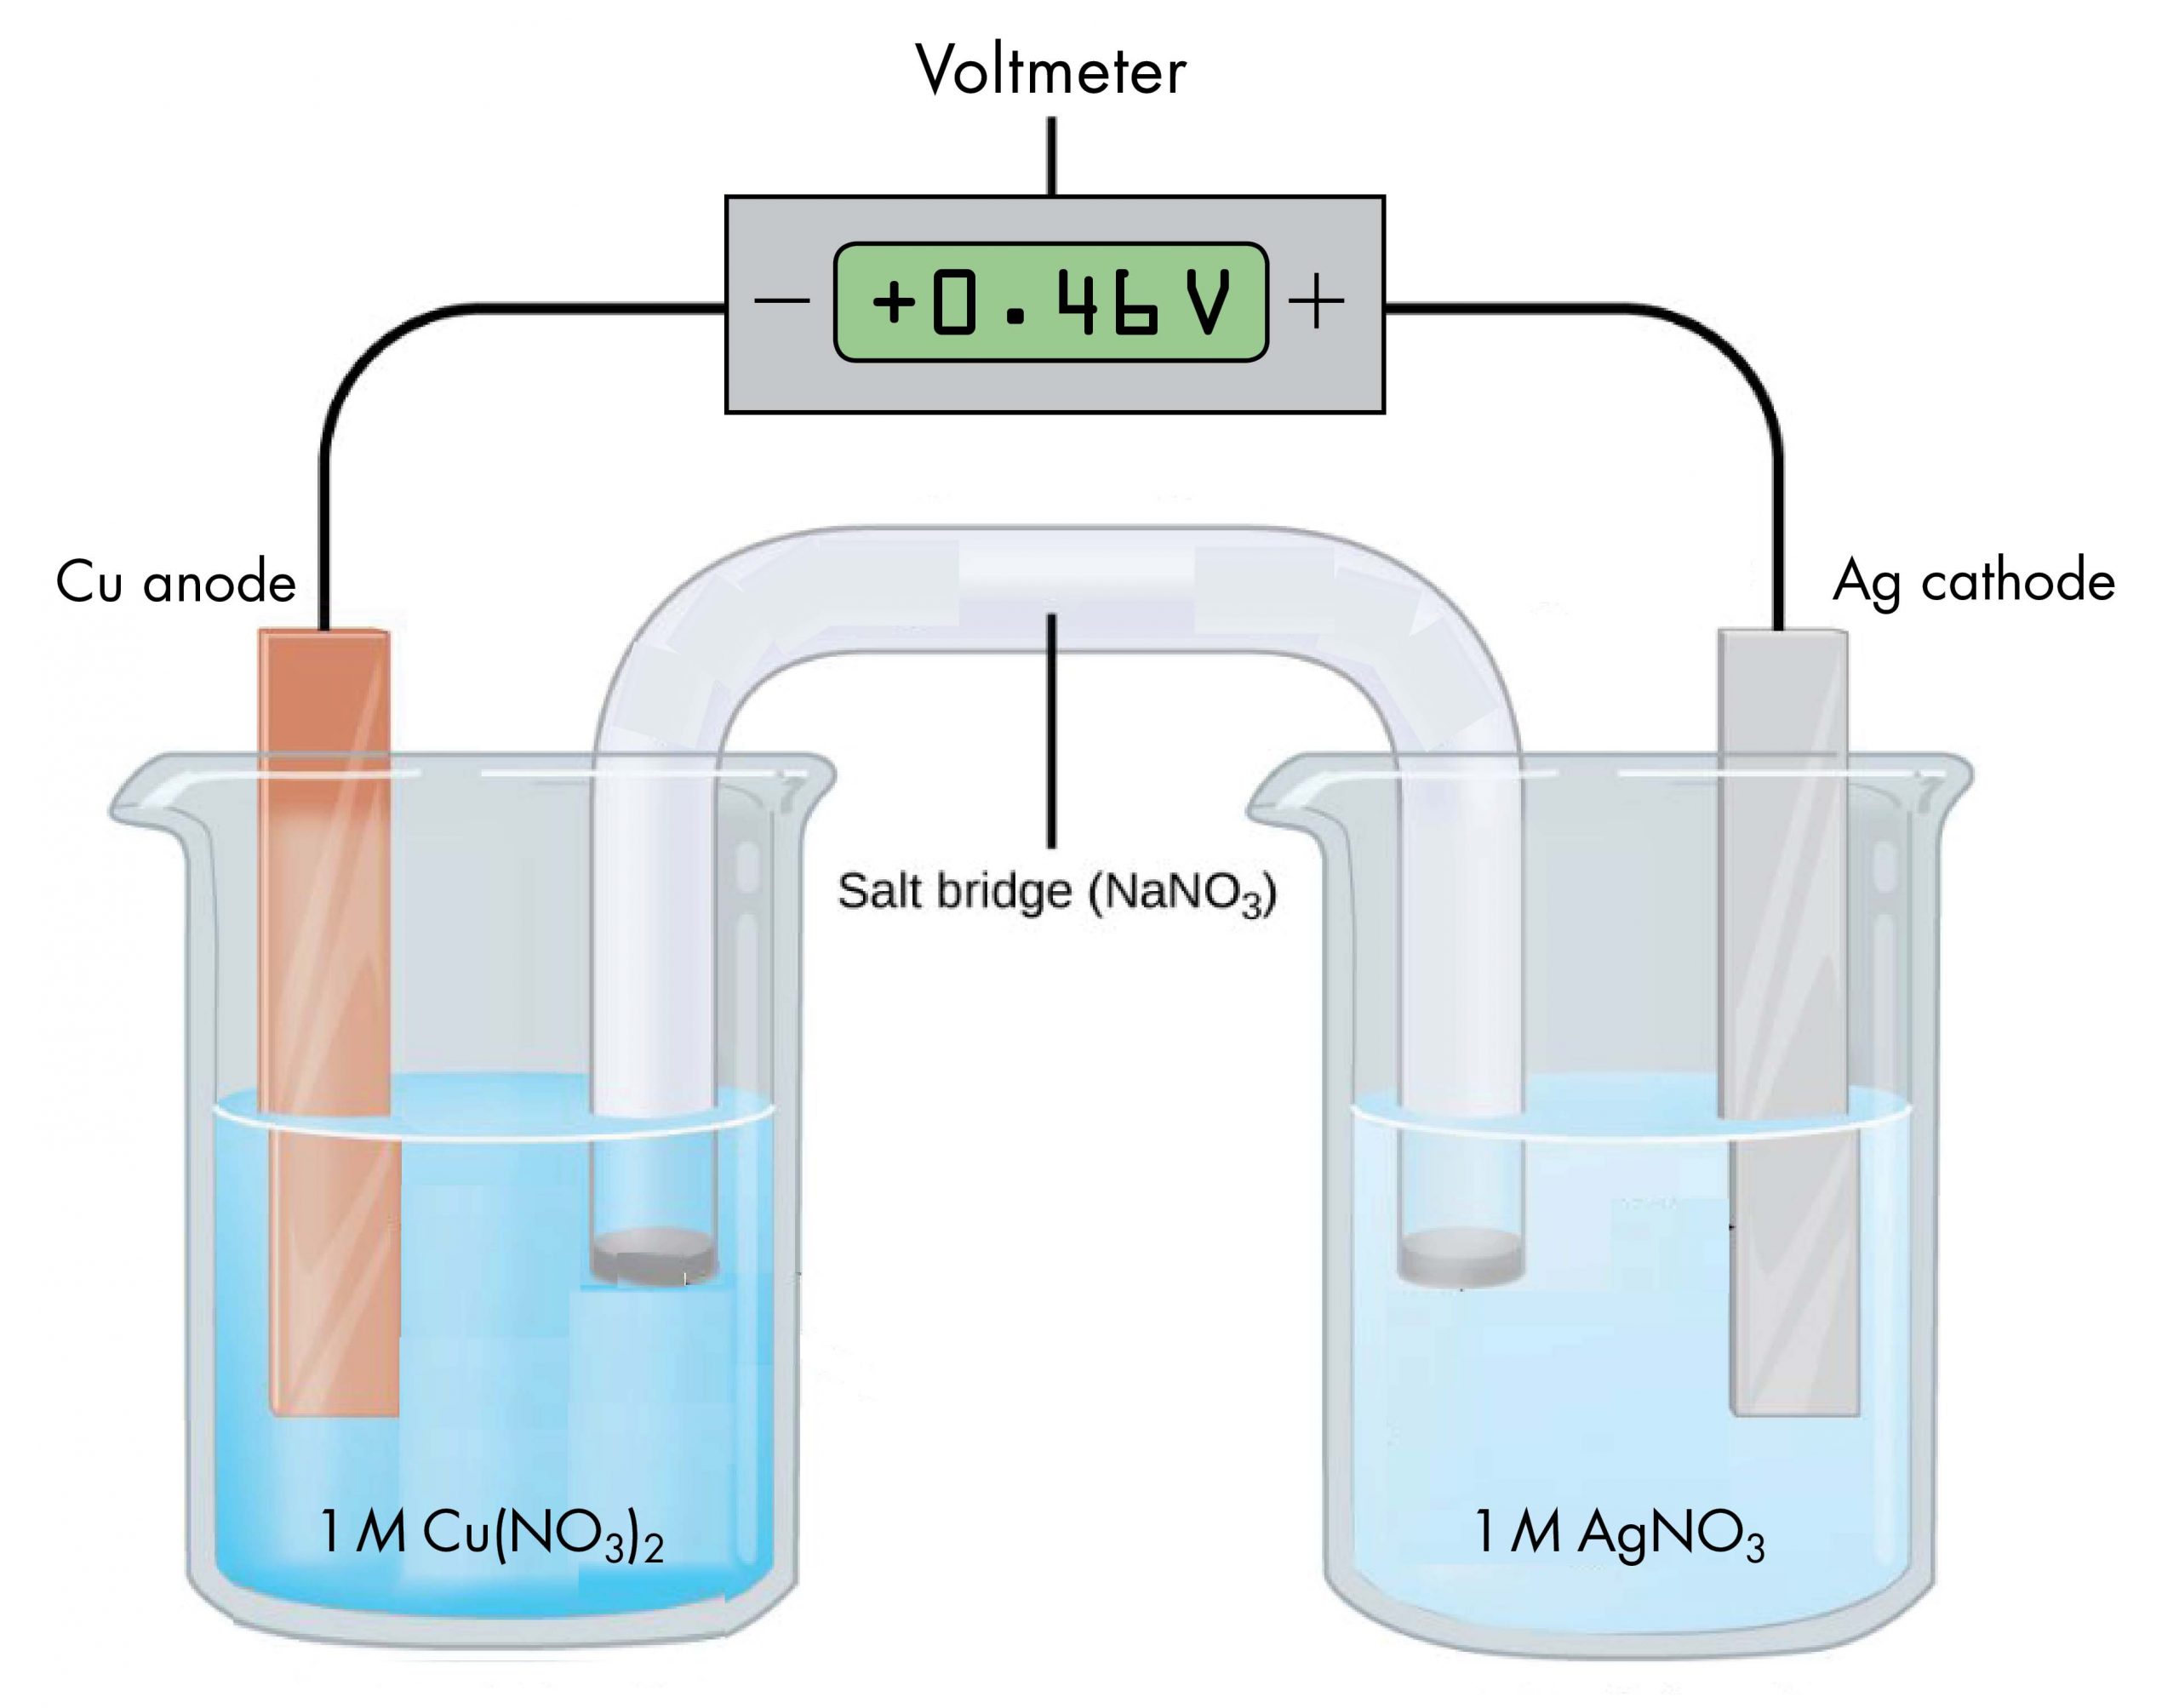
According to the reaction equation, copper loses electrons and is oxidized to copper(II) ions, so the half-cell with the copper electrode in Figure 1 is the anode. According to the reaction equation, silver ions gain electrons and are reduced to silver, so the half-cell with the silver electrode is the cathode. The copper electrode is more negative than the silver electrode.
When the more negative copper electrode is connected to the negative terminal of the voltmeter and the more positive silver electrode is connected to the positive terminal of the voltmeter, the meter reads +0.46 V. This reading is called the cell potential, Ecell. It is a measure of the energy per unit charge available from a redox reaction (V = J/C). A positive cell potential indicates how much electrical work a spontaneous reaction in a voltaic cell can do per unit electric charge moving though the circuit.
Under standard-state conditions (1 bar or 1 M, such as the 1-M concentrations in Figure 1), the cell potential is the standard cell potential, [latex]E^{\circ}_{\text{cell}}[/latex] (pronounced “E-standard-cell”). Thus, based on the voltmeter reading, [latex]E^{\circ}_{\text{cell}}=0.46\ \text{V}[/latex]
A meter like the one in Figure 1 measures the difference in electrical potential between its positive terminal and its negative terminal. Because the positive meter terminal is on the right, the cell potential is the difference in electrical potential between the right-hand half-cell and the left-hand half-cell, and we can write,
[latex]E_{\text{cell}} = E_{\text{right half-cell}} - E_{\text{left half-cell}}[/latex]
In Figure 1, all concentrations are 1 M (standard-state conditions), so we can also write,
[latex]E^{\circ}_{\text{cell}} = E^{\circ}_{\text{right half-cell}} - E^{\circ}_{\text{left half-cell}}[/latex]
If the wire connections are reversed, a typical voltmeter would read −0.46 V. This provides an experimental way to determine which half-cell is the cathode and which is the anode: a positive voltmeter reading indicates that the meter’s negative terminal is connected to the anode and the positive terminal is connected to the cathode; a negative voltmeter reading indicates the negative terminal is connected to the cathode and the positive terminal is connected to the anode.
The cell potential of a voltaic cell depends on the substances in each half-cell and the concentrations of solutions and partial pressures of gases involved in the half-cell. The half-cell potential does not depend on whether a half-reaction is occurring or on the direction in which the half-reaction goes. That is, the potential of the half cell involving silver ions and silver is the same whether silver is oxidized to silver ions or silver ions are reduced to silver.
A salt bridge must be present to complete an electric circuit. In the salt bridge when the cell generates electric current, anions move toward the anode and cations move toward the cathode.
Exercise 1: Voltaic Cell Terminology
D39.2 Cell Notation
Drawing a diagram, like Figure 1 above, to define a voltaic cell takes a lot of time. Cell notation is an abbreviation that summarizes the important information about a voltaic cell. In cell notation, a vertical line, |, denotes a phase boundary and a double line, ||, a salt bridge. The anode electrode is written to the left, followed by the anode solution, then the salt bridge, then the cathode solution, and, finally, the cathode electrode to the right. Figure 2 shows how the cell notation for a voltaic cell relates to various components of the cell.
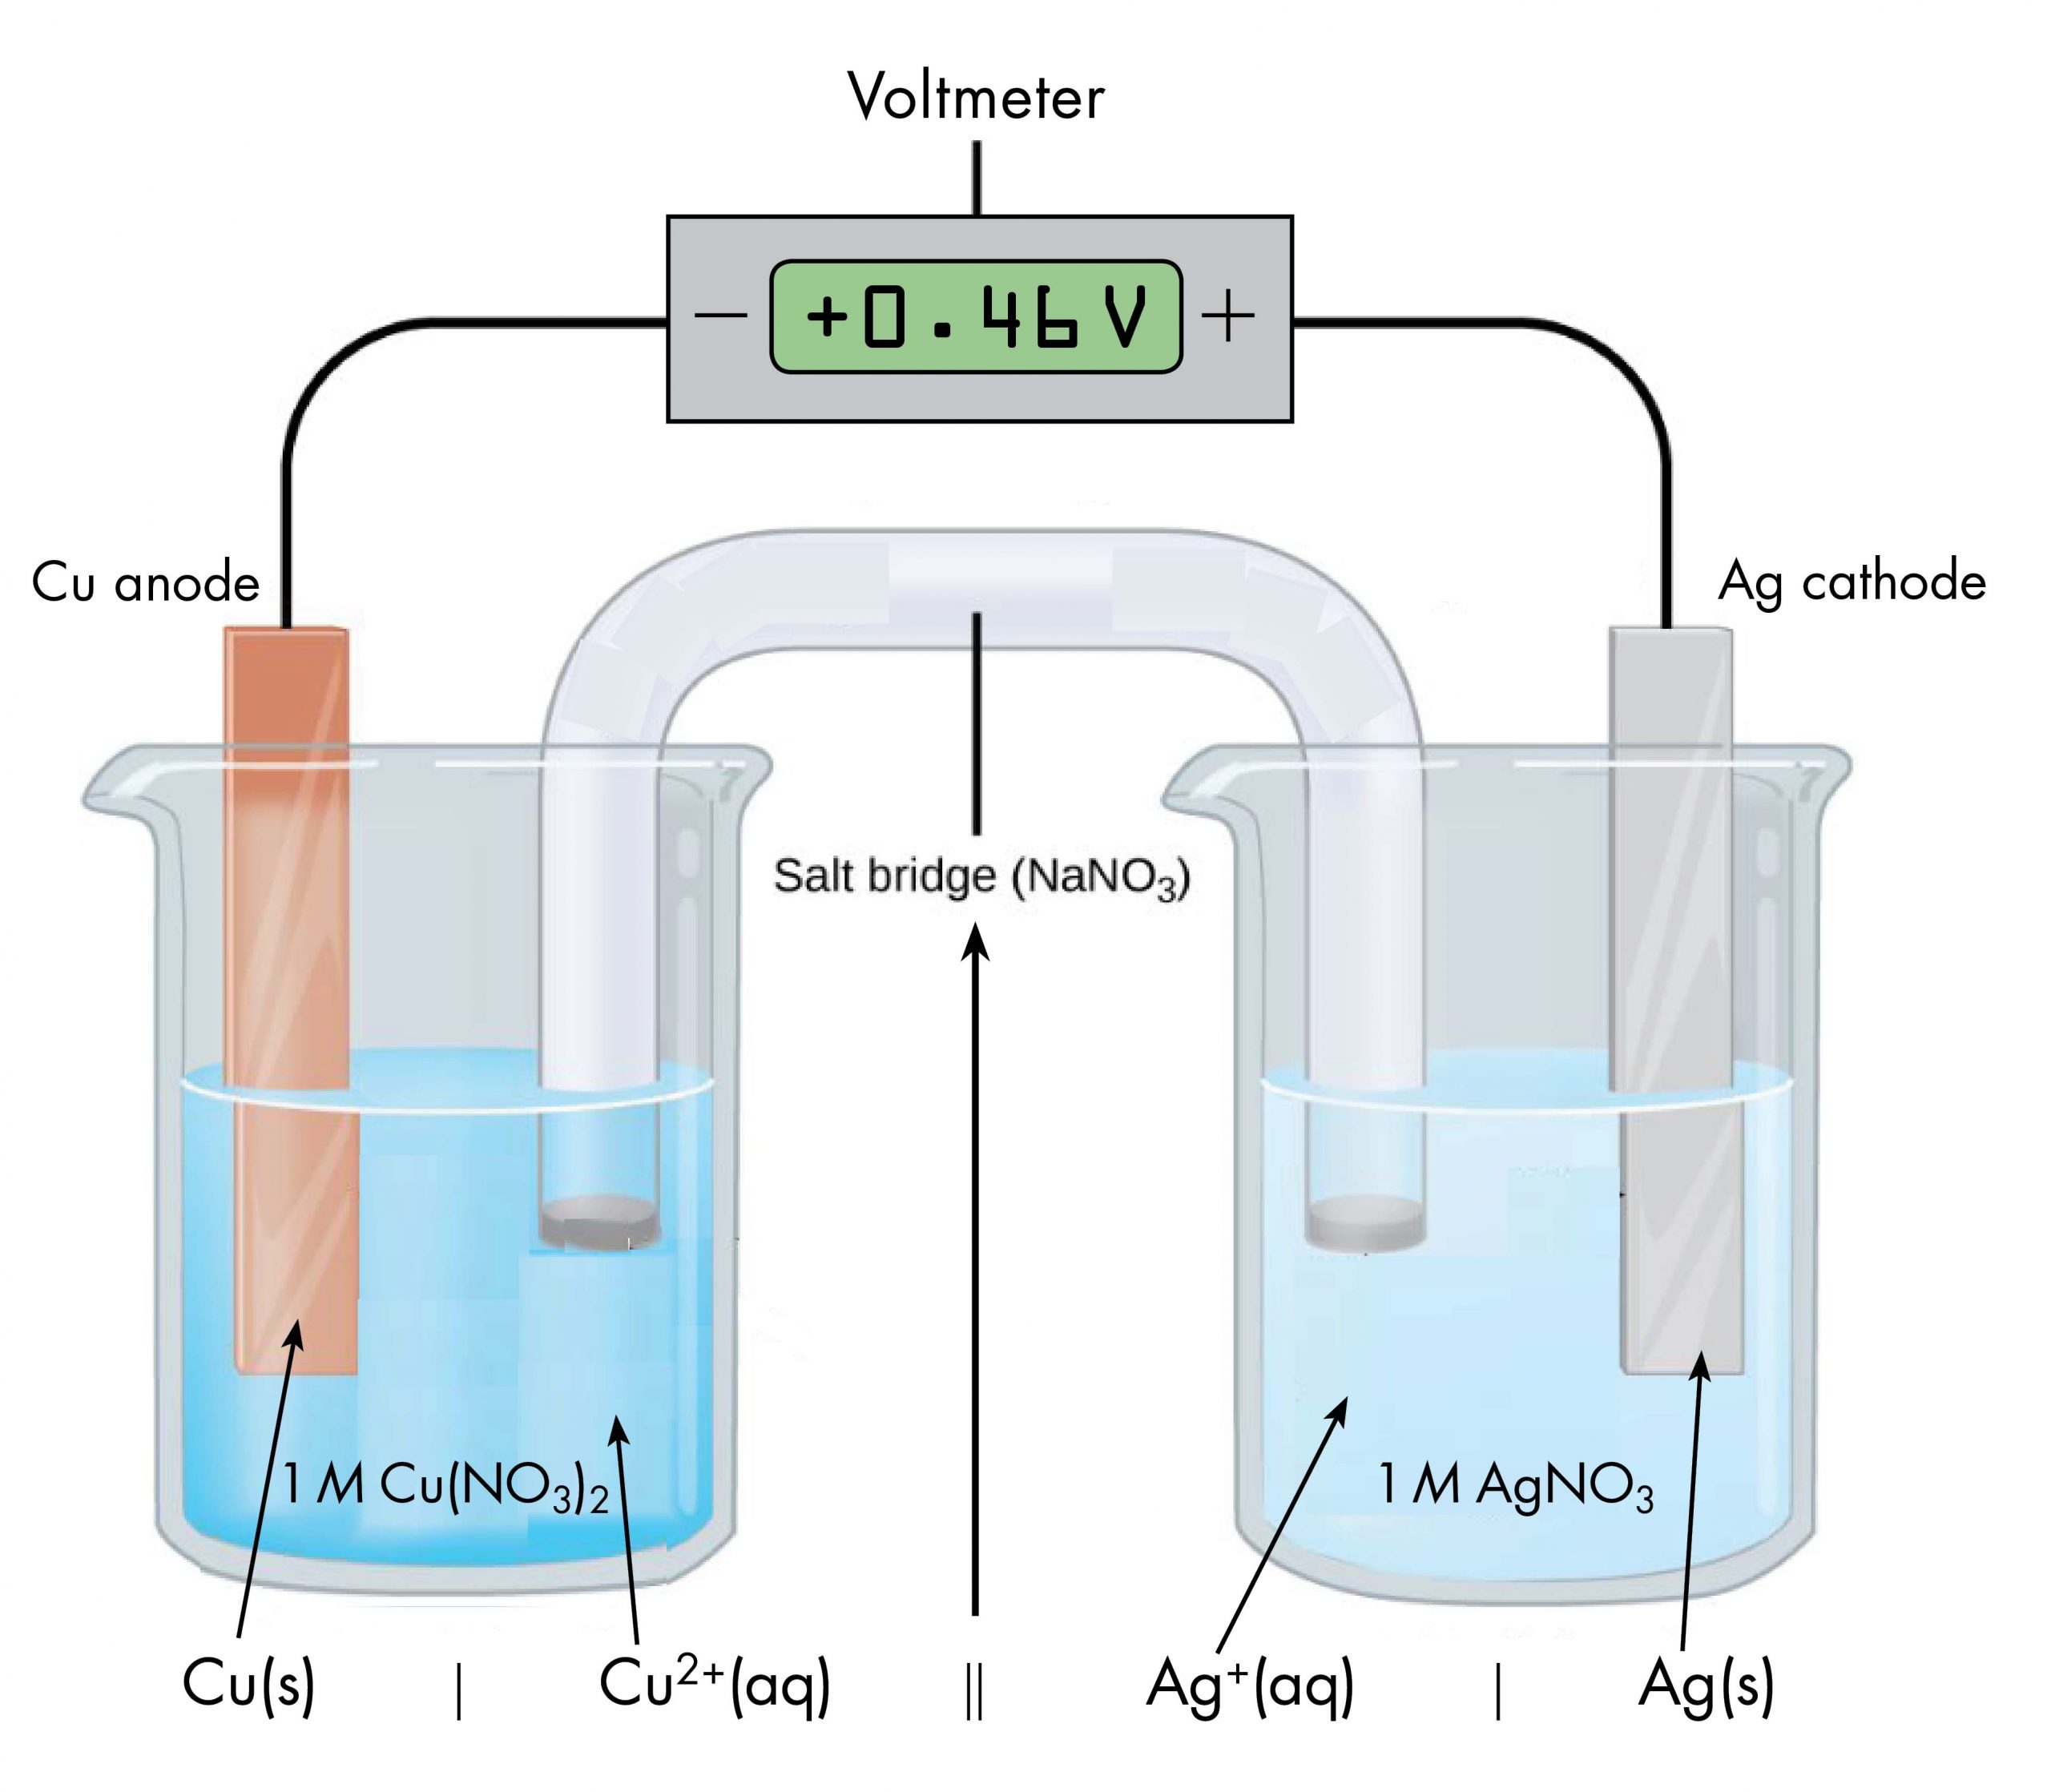
Note that spectator ions, such as NO3−, are not included in the cell notation, and if there are coefficients in a half-reaction the coefficients are not included (that is, the coefficients of 2 in the silver half-reaction are do not appear in the cell notation). When known, the initial concentrations of ions are usually included in the cell notation, so a more complete cell notation for the cell in Figure 2 is Cu(s) | Cu2+(aq, 1 M) || Ag+(aq, 1 M) | Ag(s).
Some redox reactions involve species that are poor conductors of electricity, such as gases or ionic solids. For such substances, an inert electrode, that does not participate in the reactions, is used. An example of such a voltaic cell is shown in Figure 3.
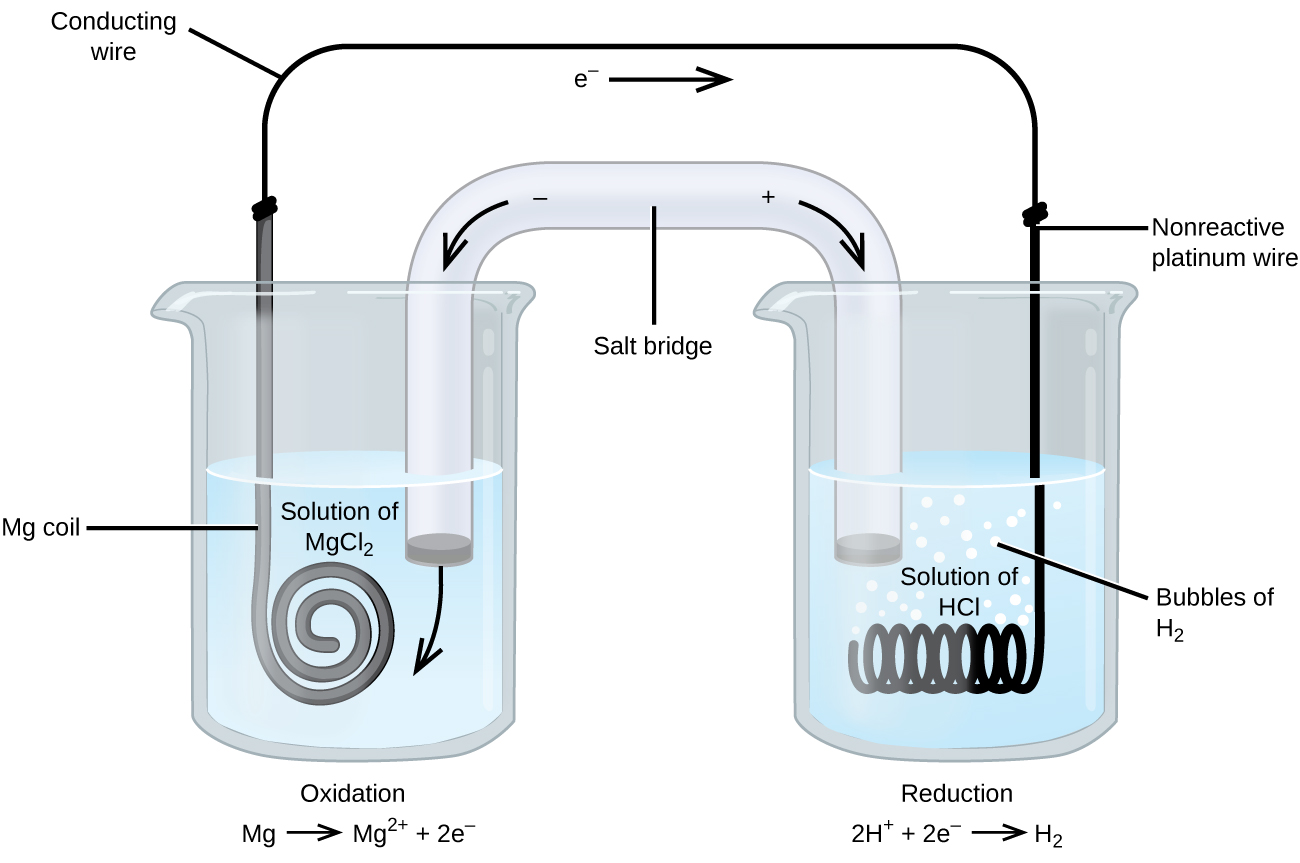
The redox reaction involved is:
| Oxidation (anode): | Mg(s) | ⟶ | Mg2+(aq) + 2e− |
| Reduction (cathode): | 2H+(aq) + 2e− | ⟶ | H2(g) |
| overall: | Mg(s) + 2H+(aq) | ⟶ | Mg2+(aq) + H2(g) |
This voltaic cell uses an inert platinum wire for the cathode, so the cell notation is:
The magnesium electrode is an active electrode because it participates in the redox reaction. Inert electrodes, like the platinum electrode in Figure 3, do not participate in the redox reaction but must be present so that there is a complete electrical circuit. Platinum and gold are among the least reactive metals so they are good choices for inert electrodes. Graphite, also inert to many chemical reactions, is another common option.
Exercise 2: Half-reactions and Cell Notation
D39.3 Standard Half-Cell Potentials
The cell potential in Figure 1 (+0.46 V) results from the difference in the electrical potential between the half-cells. It is not possible to measure directly the potential of a single half-cell; one half-cell has to be connected to another half-cell to measure a voltage.
However, it is useful to tabulate potentials for individual half-cells, such that the potential for a voltaic cell constructed from any two half-cells can be calculated from the values in the table. To create such a table, all half-cell potentials need to be measured relative to the same reference half-cell. That half-cell is the standard hydrogen electrode (SHE) (Figure 4), which consists of hydrogen gas at 1 bar pressure bubbling through a 1 M H+(aq) solution (platinum is used as the inert electrode):
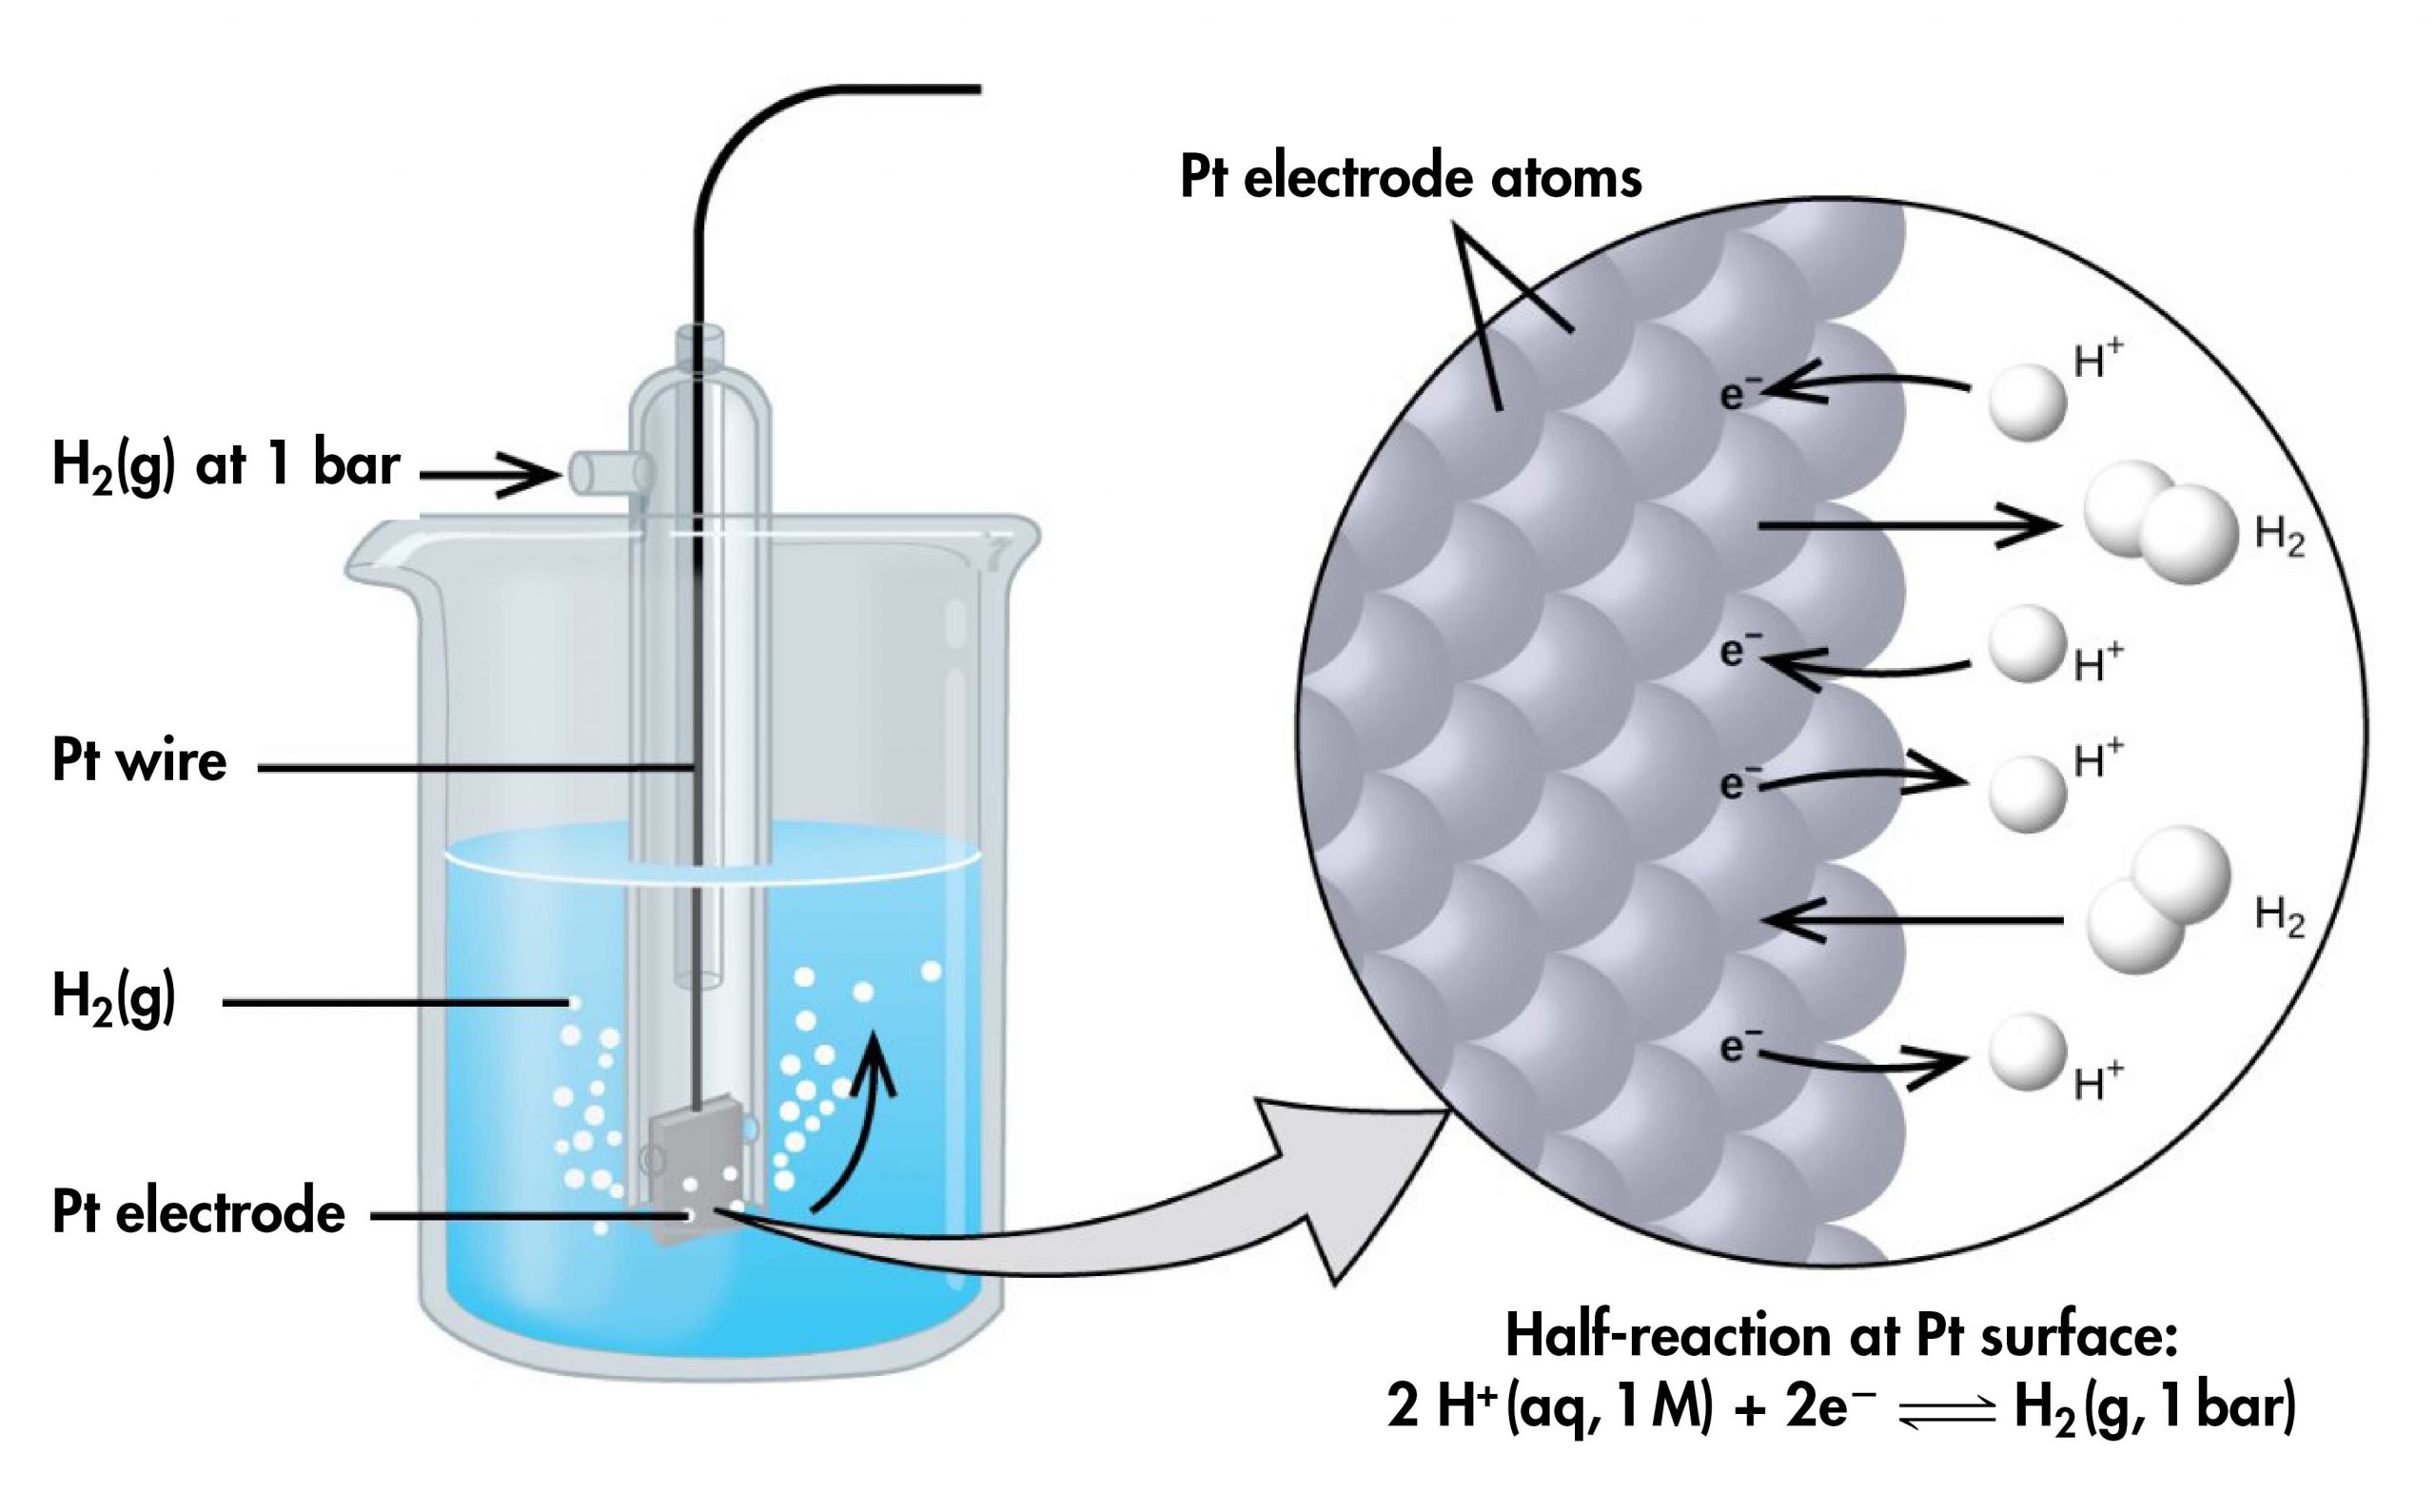
If a cell is set up with the SHE on the left and the half-cell whose potential we want to measure on the right, with all concentrations 1 M and all gas partial pressures 1 bar, then the reading on the voltmeter is E°, the standard half-cell potential, for the half-cell on the right. (Unless specified, the temperature is typically assumed to be 25 ºC.) For highly accurate measurements the voltmeter must not allow any current to flow; that is, no chemical reaction takes place.
For example, a voltaic cell consisted of a SHE and a Cu2+ | Cu(s) half-cell (Figure 5) can be used to determine the standard half-cell potential for Cu2+ | Cu(s).
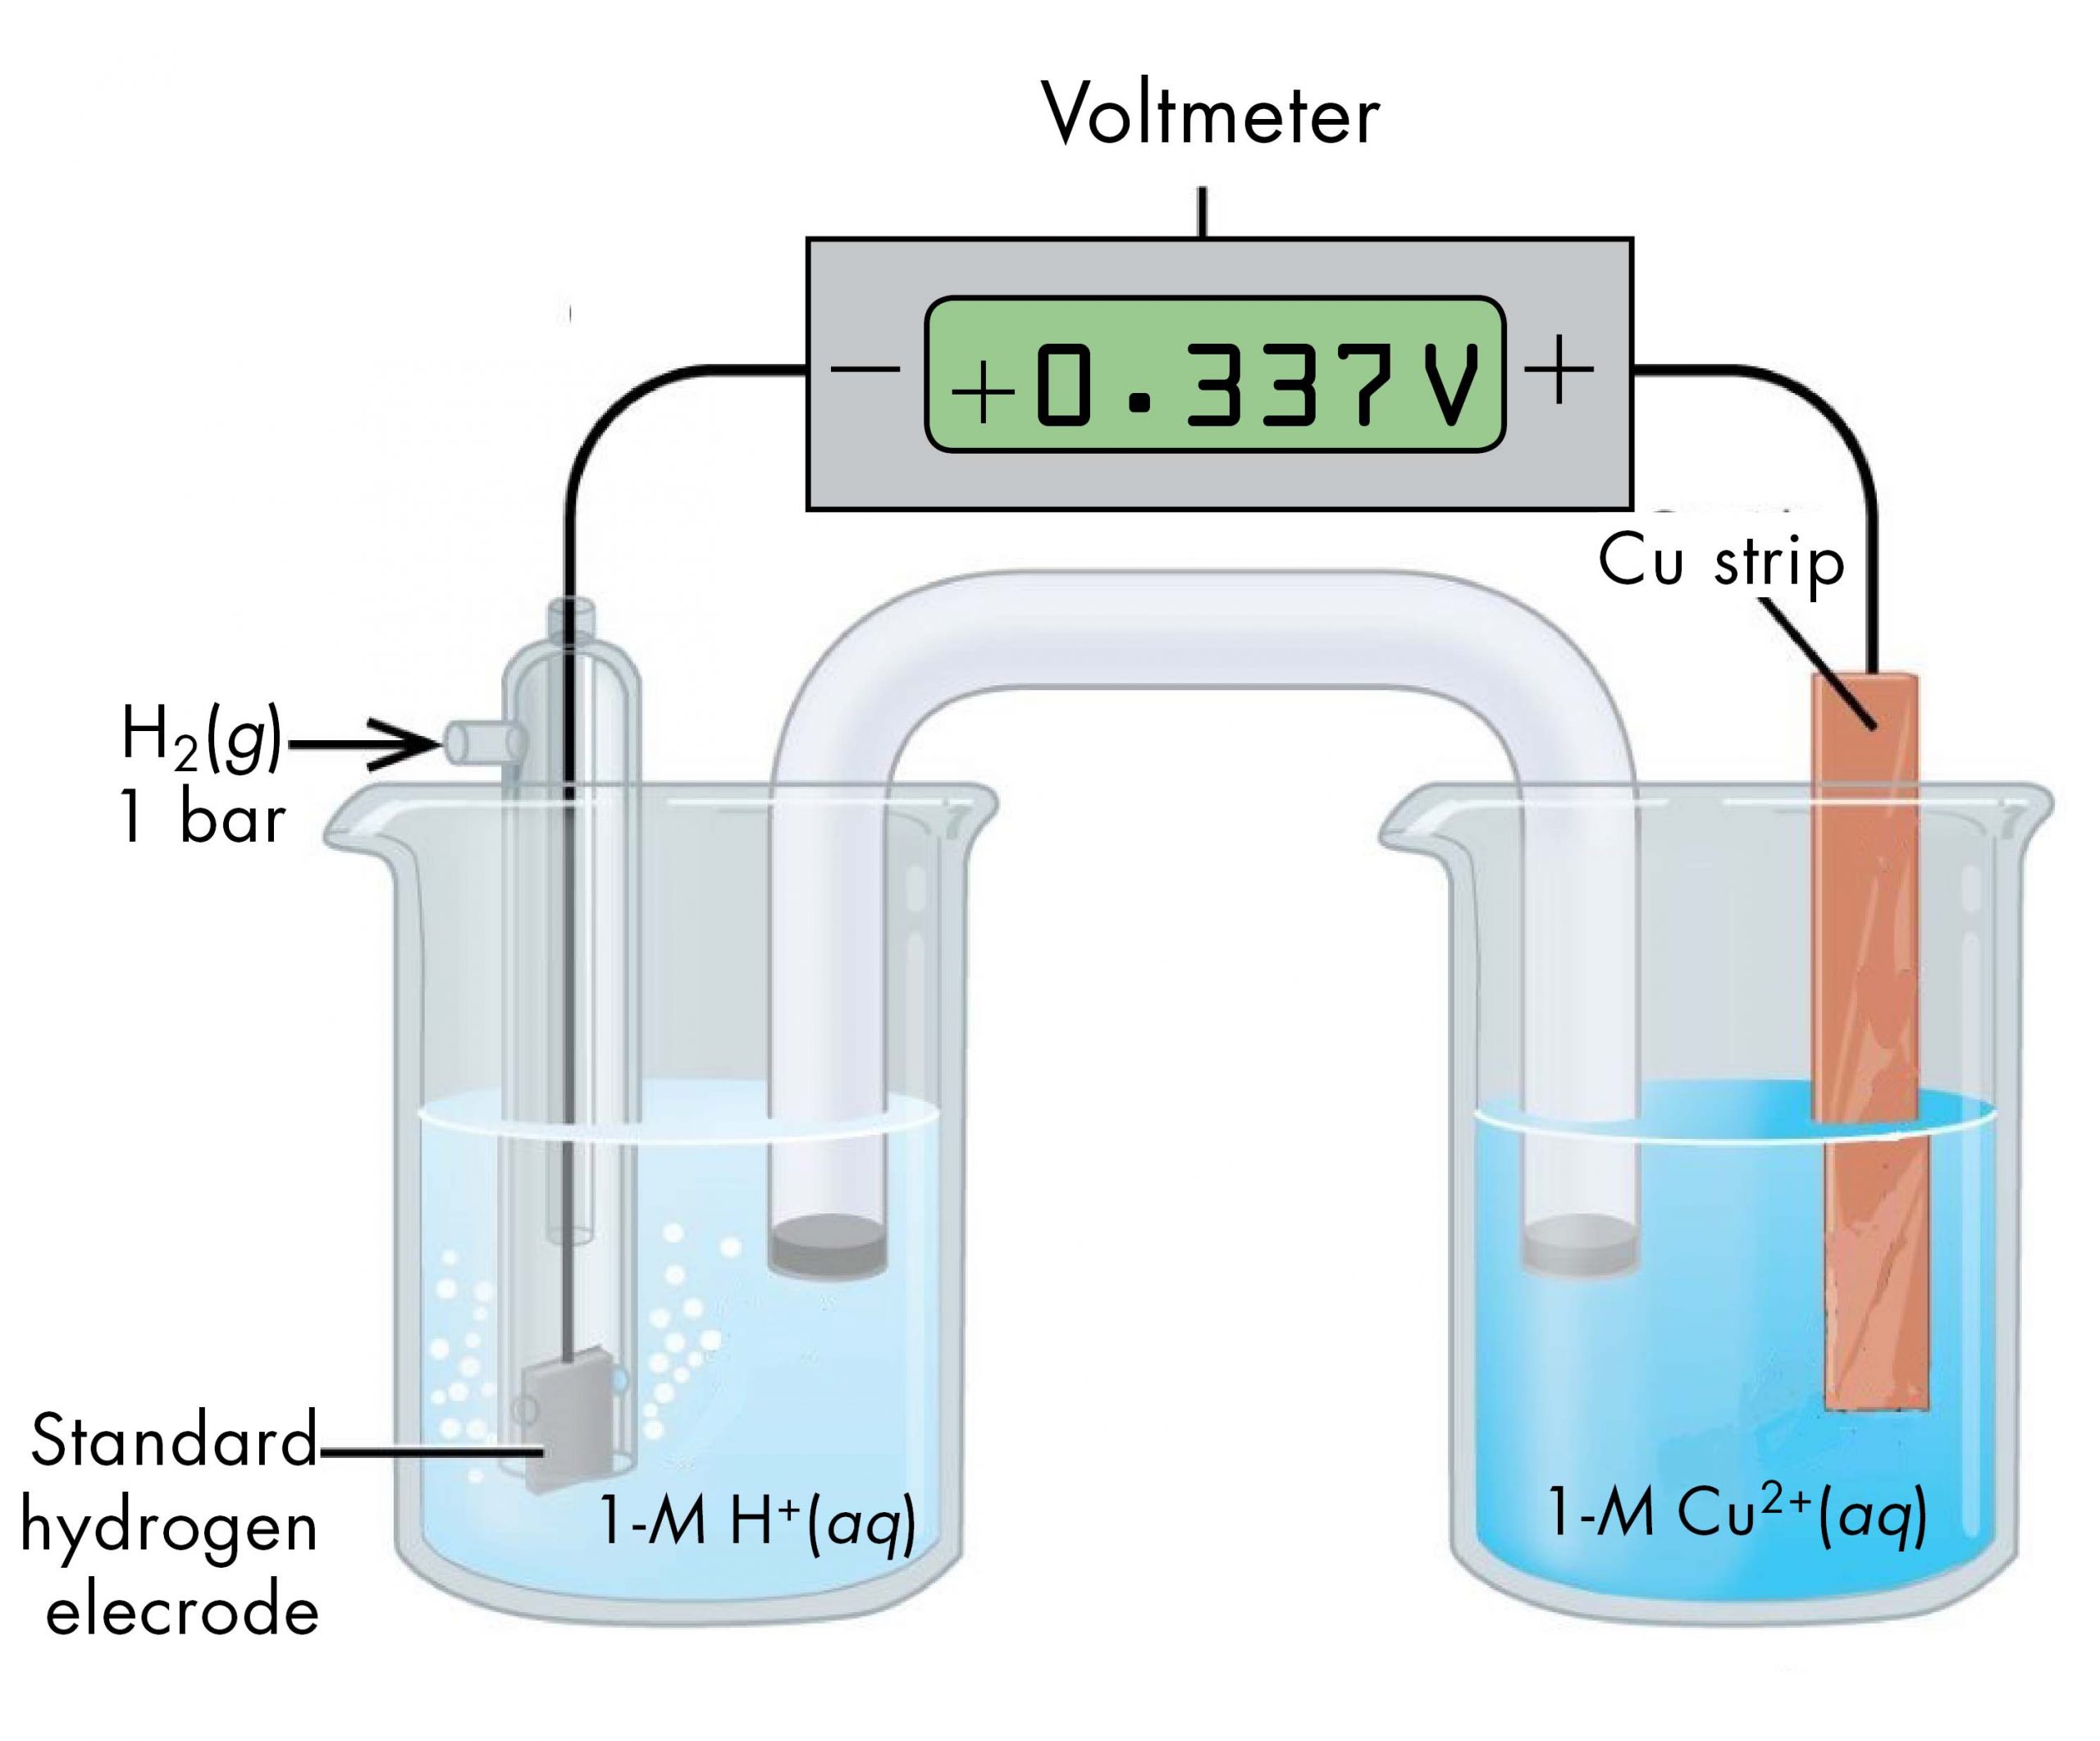
The cell notation for this voltaic cell is:
As we noted in Section D39.1, the cell potential, E°cell, measured by the voltmeter, is the difference between the potential of the right-hand half-cell and the left-hand half-cell:
From the measured E°cell = +0.337 V and the defined potential of zero for the Pt(s) | H2(g, 1 bar) | H+(aq, 1 M) half-cell, we can calculate E° of the Cu2+(aq, 1 M) | Cu(s) half-cell:
Sometimes, when a cell is set up with the SHE on the left, the reading on the voltmeter is negative. That is, for some half-cells the standard half-cell potential is lower than the potential for the Pt(s) | H2(g, 1 bar) | H+(aq, 1 M) half-cell. Consider the cell shown in Figure 6, with cell notation
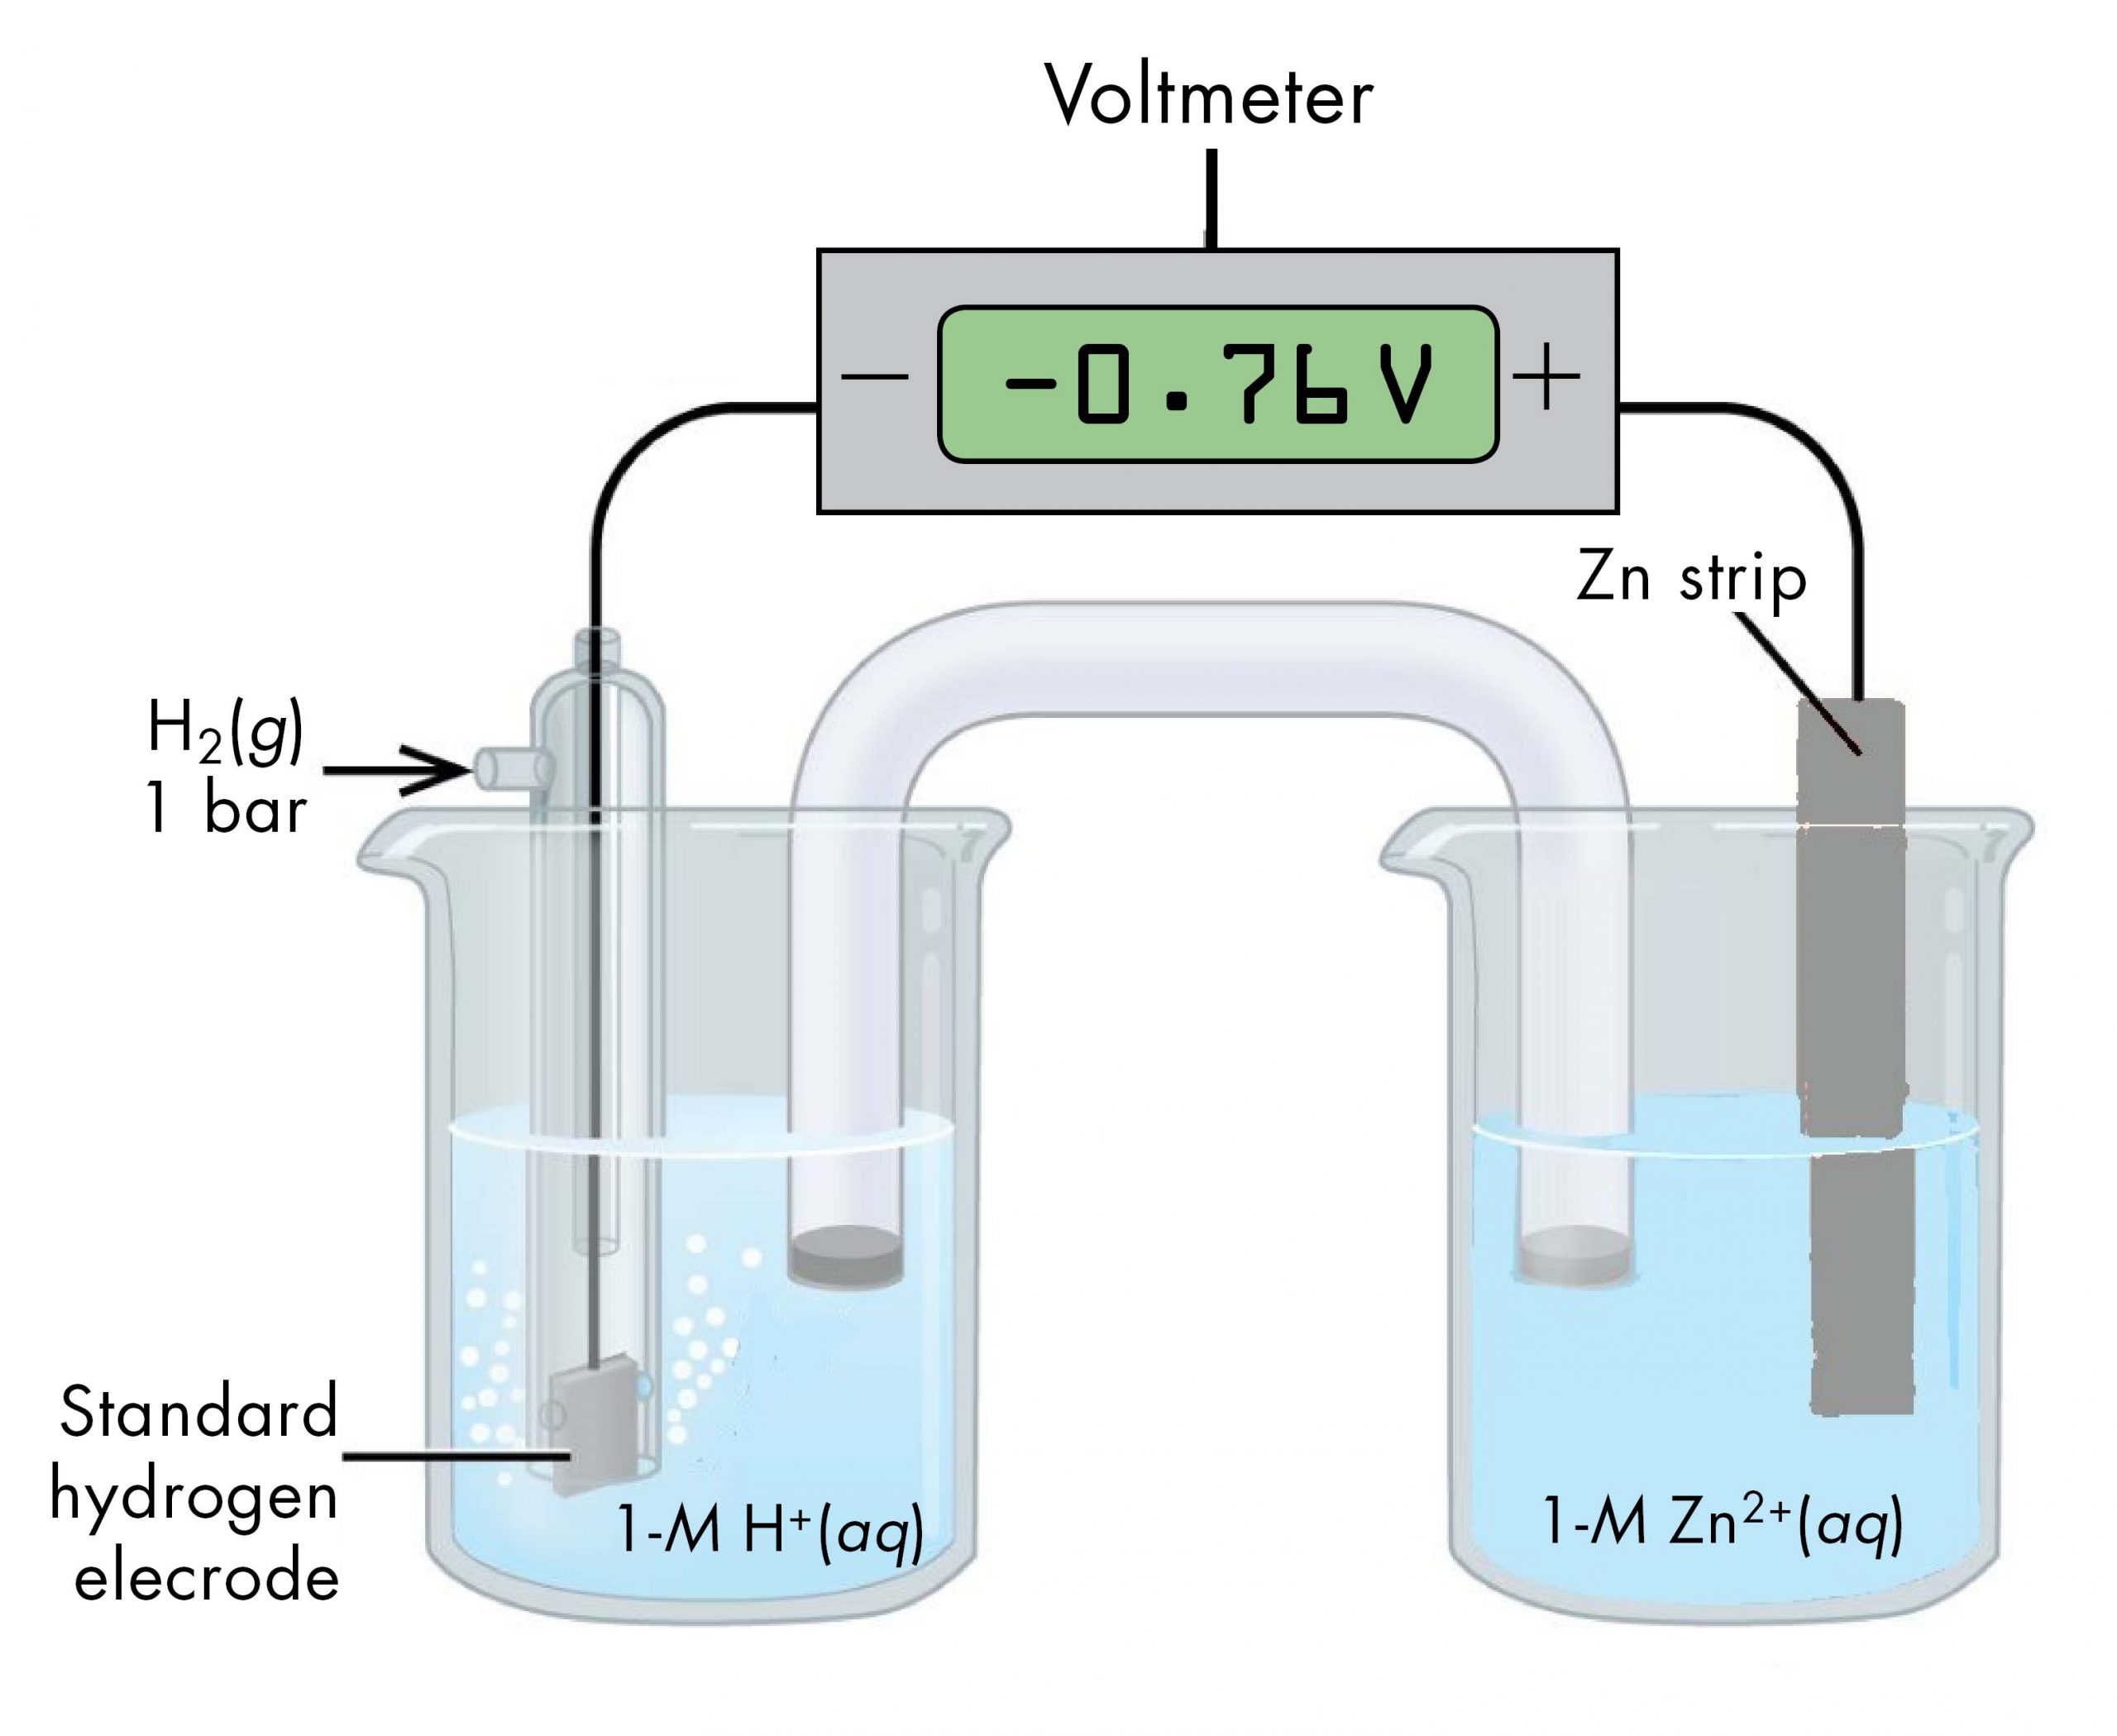
Following the same reasoning as for the Cu2+(aq, 1 M) | Cu(s) half-cell, E° of the Zn2+(aq, 1 M) | Zn(s) half-cell can be calculated.
E°cell = E°right half-cell – E°left half-cell
It may seem strange that the standard half-cell potential is negative. This just reflects the fact that the electrical potential of the Zn2+(aq, 1 M) | Zn(s) half-cell is smaller than the electrical potential of the Pt(s) | H2(g, 1 bar) | H+(aq, 1 M) half-cell. The potential of a half-cell depends only on the composition of the half-cell and does not depend on the direction of either a half-reaction or an overall reaction.
The standard hydrogen electrode is rather dangerous because H2(g) is very flammable. Hence, it is rarely used in the laboratory. Its main significance is that it establishes the “zero” for standard half-cell potentials. Most standard half-cell potentials are measured by setting up a voltaic cell with one half-cell of known standard potential and one half-cell of unknown (to be measured) standard potential.
D39.4 Using Standard Half-Cell Potentials
Based on the methods described in the preceding section, standard half-cell potentials have been determined for many half-cells. The table below gives half-cell potentials for selected half-cells. Click on the table to open a version that can be enlarged or printed.
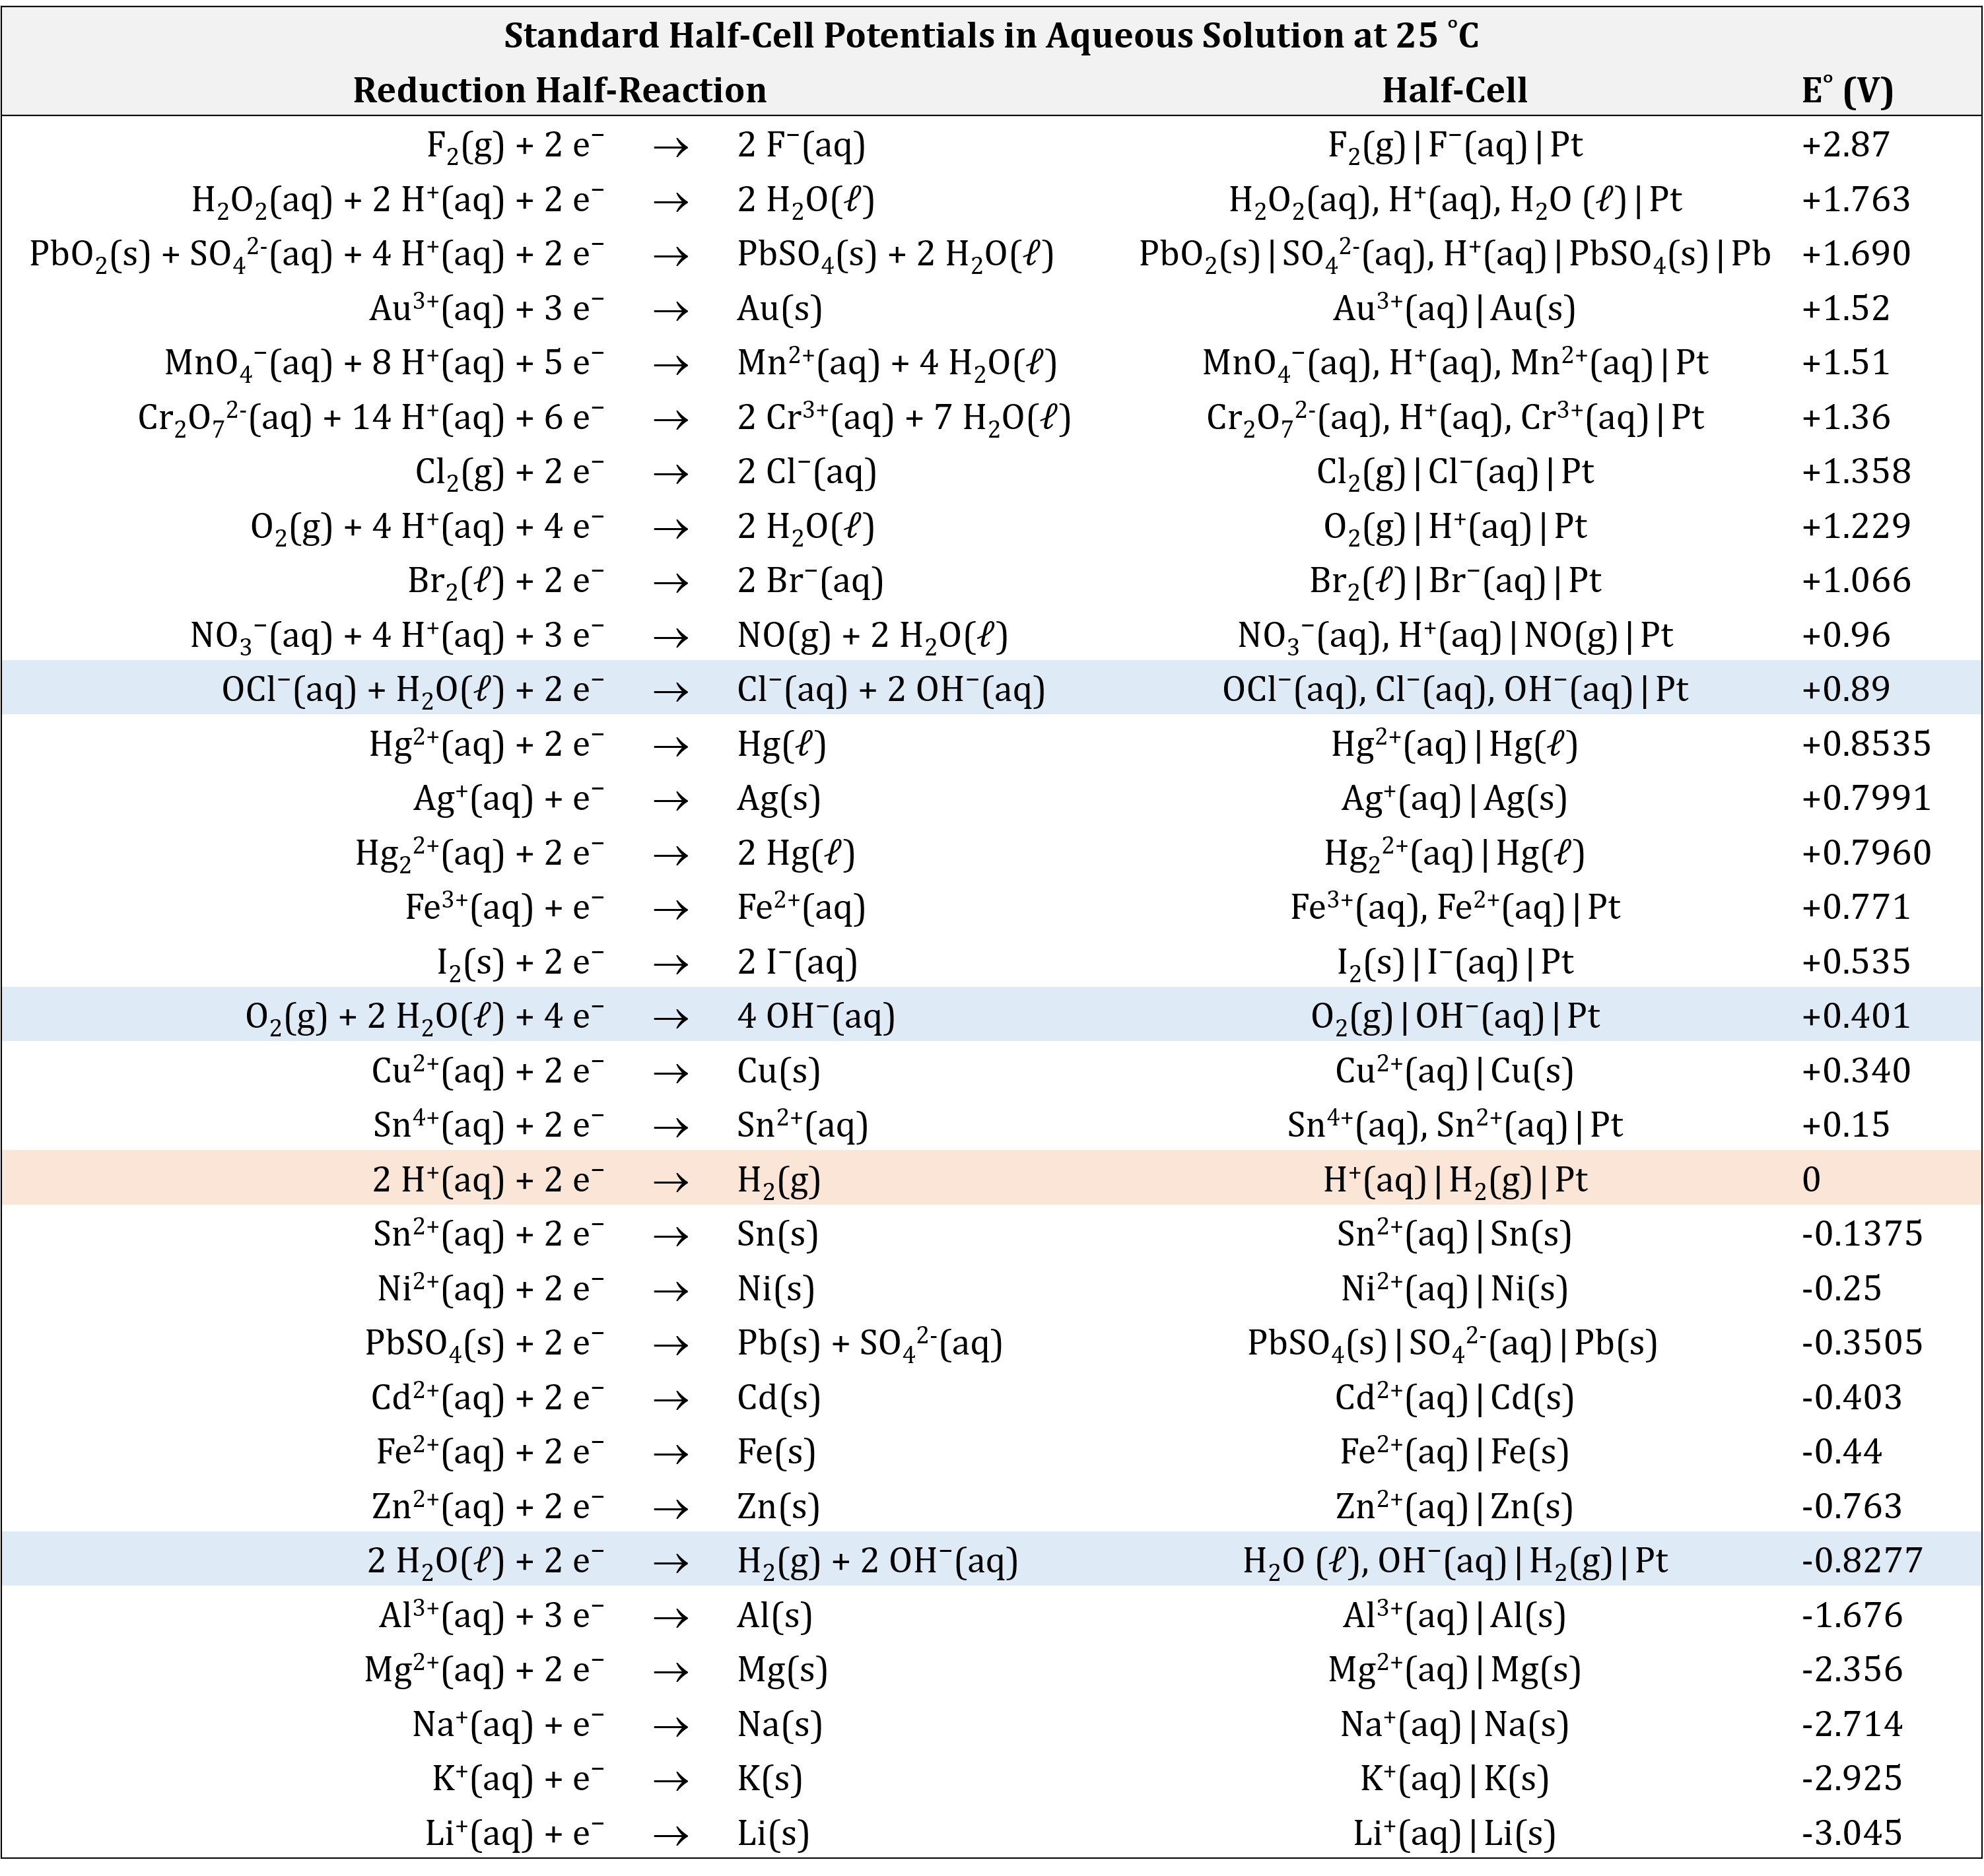
There are several important aspects to note:
- The oxidizing agent is on the left (reactant) side of a reduction half-reaction equation.
- The strongest oxidizing agents (the substances most easily reduced) have the largest positive E° values and are at the top of the table. (For example, F2(g) is a very strong oxidizing agent.)
- The reducing agent is on the right (product) side of a reduction half-reaction equation.
- The strongest reducing agents (the substances most easily oxidized) have the most negative E° values and are at the bottom of the table. (For example, Li(s) and K(s) are very strong reducing agents.)
- A redox reaction is product-favored when a stronger oxidizing agent reacts with a stronger reducing agent. This results in a positive value for E°cell when the oxidation half-reaction is combined with the reduction half-reaction.
- Half-cell reactions are reversible and the direction a half-cell reaction goes depends on the potential of the other half-cell to which it is connected in a cell.
The table of standard half-cell potentials can be used to determine the E°cell for any voltaic cell and predict whether a specific redox reaction is product-favored. For example, for the cell:
Because the value of E°cell is positive, the redox reaction corresponding to this cell notation is product-favored and the voltaic cell can produce electrical energy. The overall reaction can be obtained from the cell notation by writing the oxidation and the reduction half-reactions, multiplying each half-reaction by an appropriate number to balance electrons, and summing the two half-reactions:
| Oxidation (left): | Cu(s) | ⟶ | Cu2+(aq) + 2e− | E°anode = +0.340 V |
| Reduction (right): | 2 × (Ag+(aq) + e− | ⟶ | Ag(s)) | E°cathode = +0.7991 V |
| Overall: | Cu(s) + 2Ag+(aq) | ⟶ | Cu2+(aq) + 2Ag(s) | E°cell = +0.459 V |
Note that:
- Even though the reduction half-reaction is multiplied by 2, the E°cathode is not multiplied by 2 when E°cell is calculated. This is because electrical potential is a ratio of energy per coulomb of charge transferred (V = J/C). If the half-reaction is doubled, both energy and charge transferred are doubled, leaving the ratio constant.
- The oxidation half-reaction is the reverse of the reaction as shown in the half-cell potential table, but E°right is not multiplied by -1 . The cell potential does not depend on the direction of a half-reaction; it depends only on the composition of the half-cell.
E° for many half-cells are included in the appendix. Tables like these make it possible to determine the E°cell for many redox reactions. Moreover, by comparing the standard potentials, we can discern which species is easier to reduce/harder to oxidize/is a stronger oxidizing agent (higher/more positive E°) and which species is easier to oxidize/harder to reduce/is a stronger reducing agent (lower/more negative E°).
Exercise 4: Using Standard Half-cell Potentials
Exercise 5: Predicting whether a Redox Reaction is Product-favored
Podia Question
Use data from the table of standard half-cell potentials to determine whether this redox reaction is product-favored.
2 NO3−(aq) + 8 H+(aq) + 3 Cd(s) ⇌ 2 NO(g) + 3 Cd2+(aq) + 4 H2O(l)
Two days before the next whole-class session, this Podia question will become live on Podia, where you can submit your answer.
