
Unit Five
Day 37: Acid-Base Titration
D37.1 Titration
At this point, you have already carried out several titration experiments in lab. In a titration, one solution is added to a second solution in a way that allows the quantity of each solution to be measured accurately. Typically, one solution is added from a buret, a calibrated glass tube with a stopcock at the bottom. The buret allows additions of very small increments of volume of solution and determination of the total volume added. The solution added from the buret is the titrant. Titrant is added to a carefully measured volume of a second solution in a flask or beaker.
A chemical reaction occurs between solutes in the two solutions, and when just enough titrant has been added for complete reaction with the second solution, the equivalence point of the titration has been reached. From the balanced chemical equation for the titration reaction, the volume of each solution at the equivalence point, and the concentration of one of the two solutions, the concentration of the other solution can be determined.
The equivalence point of a titration may be detected visually if there is a color change that accompanies the completion of the reaction. Typically, a special dye called an indicator is added to the solution being titrated to provide a color change at or very near the equivalence point. Equivalence points may also be detected by measuring a solution property that changes in a predictable way during the course of the titration, such as pH.
Regardless of the approach taken to detect a titration’s equivalence point, the measured total volume of titrant added is called the end point. A properly designed titration typically ensure that the difference between the equivalence point and the end point is negligible.
Although any type of chemical reaction may serve as the basis for a titration analysis, precipitation, acid-base, and oxidation-reduction titrations are most common.
Exercise 1: Titration Stoichiometry
D37.2 Titration Curves
Titration is effective in quantitatively analyzing a solution’s acid (or base) concentration because pH changes rapidly near the equivalence point. In other words, there is a large observable change accompanying a small addition of titrant, which minimizes experimental uncertainty. For example, an acid-base indicator generally changes color over a range of about 2 pH units, so if pH increases (or decreases) by 2 or more pH units when 0.01 mL of titrant is added at the equivalence point, the color change would effectively signal the end point of the titration.
Figure 1 shows a titration curve, a graph of pH as a function of volume of titrant, for the titration of a 50.00-mL sample of 0.100-M hydrochloric acid with 0.100-M sodium hydroxide.
Exercise 2: Calculating pH for a Titration Curve
Now consider the titration of 50.00 mL of 0.100-M acetic acid (a weak acid) with 0.100-M sodium hydroxide (Figure 2). Comparing Figure 2 to Figure 1, we see that although the initial volumes and concentrations of the acids (acetic acid vs. HCl) are the same, the pH for acetic acid begins at a higher value and the titration curve maintains higher pH values up to the equivalence point. This is because, unlike HCl, acetic acid is only partially ionized.
The pH at the equivalence point is also higher (8.72 rather than 7.00) due to the presence of acetate anion, a weak base that raises the pH:
After the equivalence point, the two curves (Figure 1 and Figure 2) are identical because the pH depends on the excess hydroxide ion from NaOH added in both cases.
Activity 1: Titration Equivalence Point
Exercise 3: Calculating pH for a Weak-acid, Strong-base Titration
The midpoint of a titration is when we have added half the volume of titrant needed to reach the equivalence point. As part (b) in the above exercise shows, when titrating a weak acid with a strong base, the pH of the solution equals the pKa of the weak acid at the midpoint because we have added half the amount of strong base needed to react with all the weak acid. Therefore, according to the Henderson-Hasselbalch equation:
Activity 2: Titration of a Weak Base with a Strong Acid
D37.3 Acid-Base Indicators
Acid-base indicators are substances with intense colors that change color when [H3O+] reaches a particular value. Acid-base indicators are either weak organic acids or weak organic bases and can be used to determine the pH of a solution. For example, phenolphthalein is colorless in an aqueous solution with pH < 8.3 ([H3O+] > 5.0 × 10⁻⁹ M), and turns red or pink when pH > 8.3.
The equilibrium in a solution of the acid-base indicator methyl orange, a weak acid, can be represented by an equation in which we use “HIn” as a simple representation for the complex methyl orange molecule:
When we add acid to a solution of methyl orange, the increased [H3O+] shifts the equilibrium toward the nonionized red form, in accordance with Le Châtelier’s principle. If we add base, the equilibrium shifts towards the anionic yellow form. The overall color of the solution is the visible result of the ratio of the concentrations of the two species, In− and HIn. If most of the indicator is present as In−, then we see the color yellow. If most is present as HIn, then we see the color red. We can rearrange the equation for Ka and write:
When [H3O+] = Ka,HIn, 50% of the indicator is present in the red form (HIn) and 50% is in the yellow ionic form (In−), and the solution appears orange in color. When [H3O+] increases to 8 × 10⁻⁴ M (pH = 3.1), the solution turns red. No change in color is visible for further increase in [H3O+]. When [H3O+] decreases to 4 × 10⁻⁵ M (pH = 4.4), most of the indicator is in the yellow ionic form, and further decrease in [H3O+] does not produce a visible color change. The pH range of 3.1 – 4.4 is the color-change interval of methyl orange, the range of pH values over which the color change takes place.
There are many different acid-base indicators. Their color changes have a wide range of pH values (Figure 3). Universal indicators and pH paper contain a mixture of indicators and exhibit different colors at different pH values.
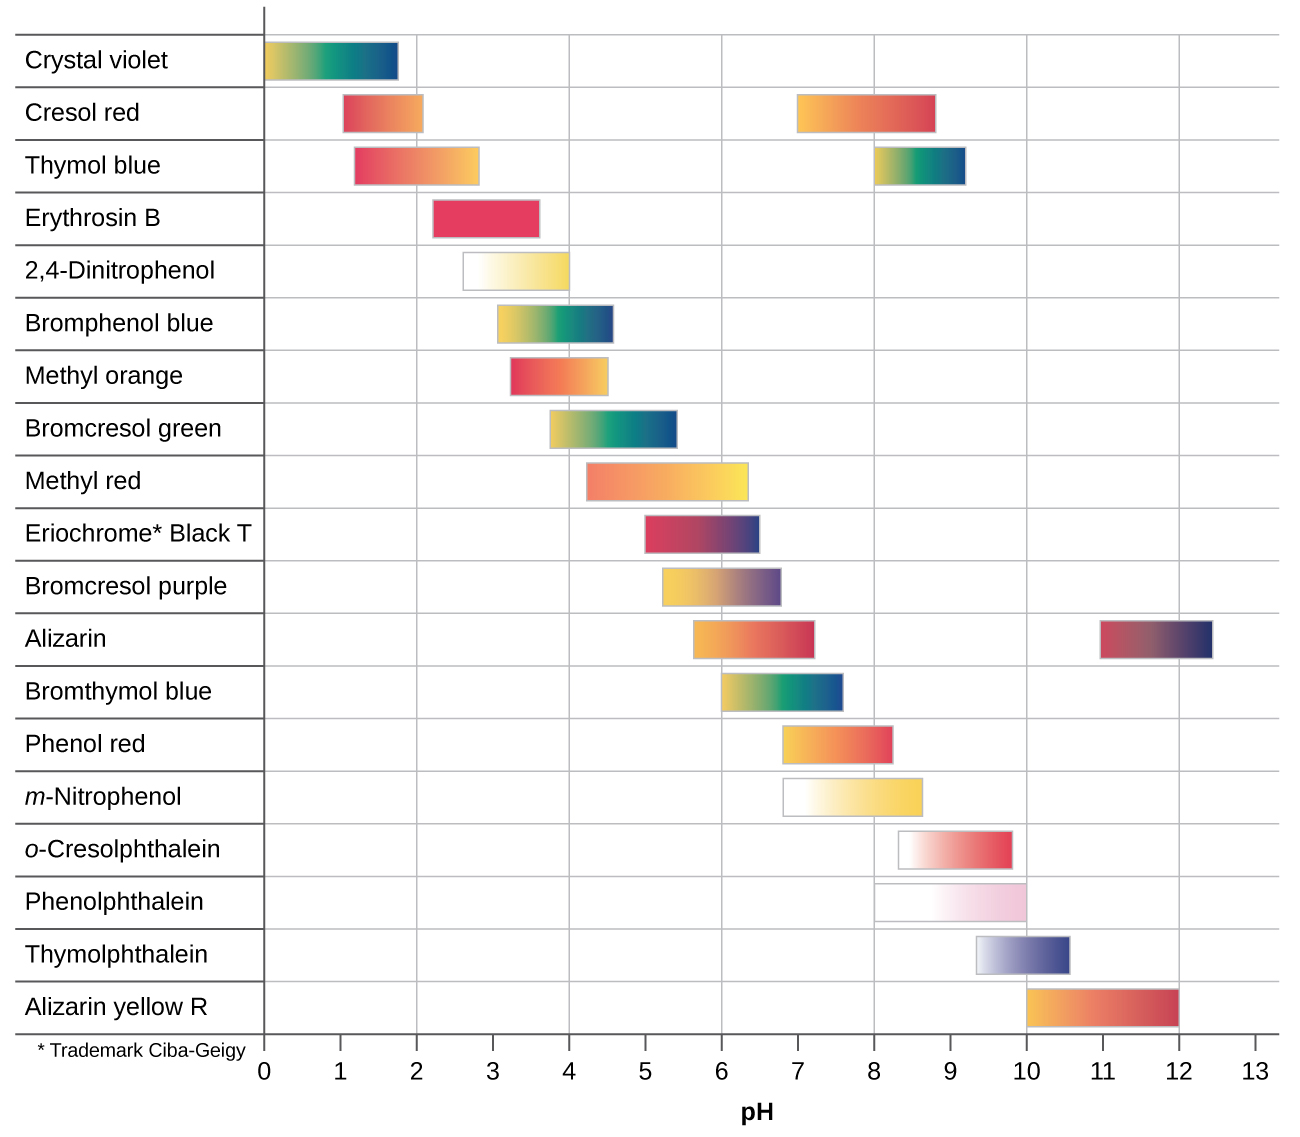
Titration curves can help us select an indicator that will provide a sharp color change at the equivalence point. The best selection is an indicator with a color change interval that brackets the pH at the equivalence point of the titration. (We can also base our choice of indicator on the calculated pH at the equivalence point.)
The color change intervals of three indicators are shown in Figure 4. The steep section of the titration curves of both the titration of HCl and of CH3COOH are located in the color-change interval of phenolphthalein. We can use it for titrations of either acid.
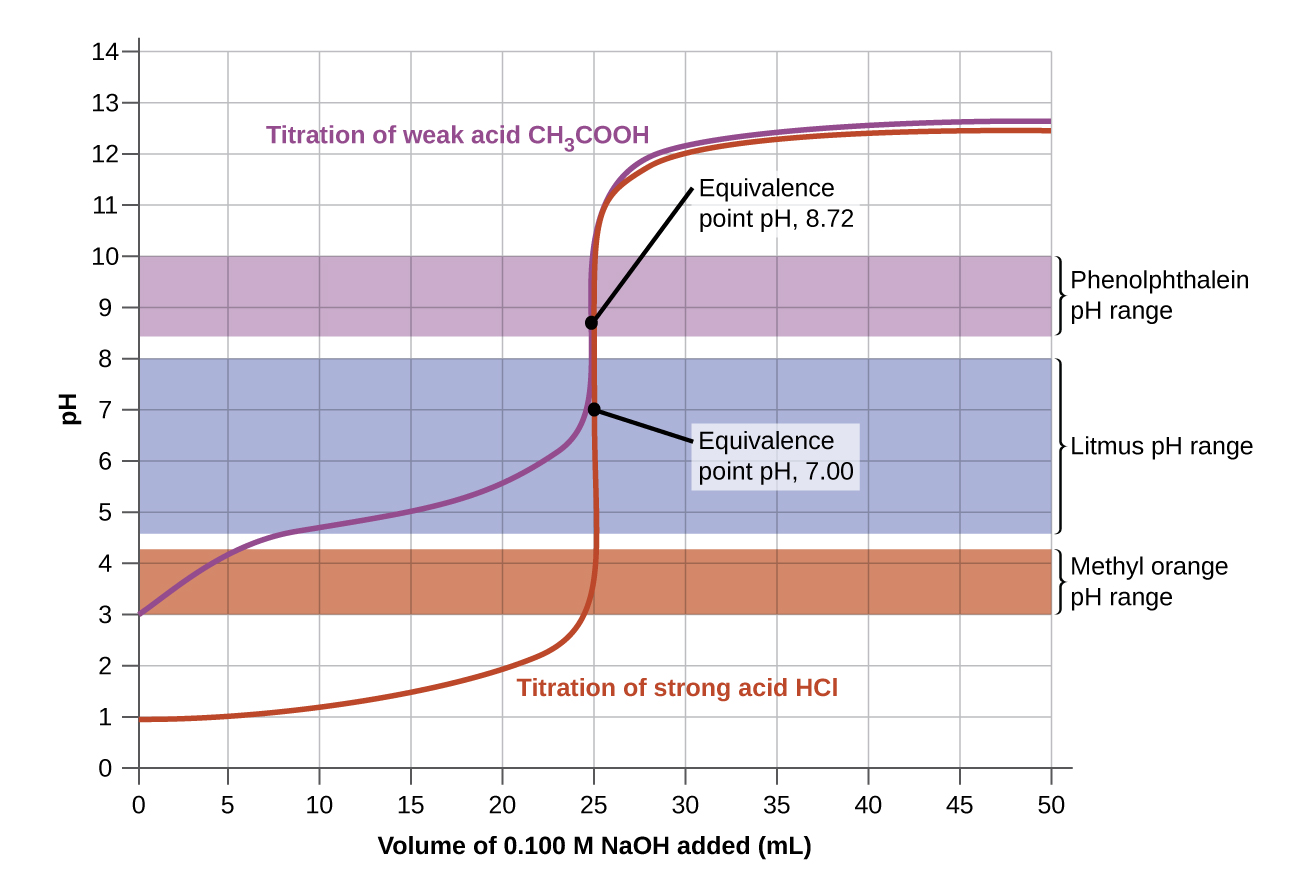
Litmus is a suitable indicator for the HCl titration. However, we should not use it for the CH3COOH titration because the pH is within the color-change interval of litmus when only 8 mL of NaOH has been added, and it does not leave the range until 25 mL has been added. The color change would be very gradual, taking place during the addition of 17 mL of NaOH, making litmus useless as an indicator of the equivalence point.
We can use methyl orange for the HCl titration, but it would not give very accurate results: (1) It completes its color change slightly before the equivalence point is reached (but very close to it, so this is not too serious); (2) it changes color during the addition of 0.5 mL of NaOH, which is not so sharp a color change as that of litmus or phenolphthalein. Methyl orange would be completely useless as an indicator for the CH3COOH titration. Its color change is completed long before the equivalence point is reached and hence provides no indication of the equivalence point.
D37.4 Titration of Polyprotic Acids and Bases
When a polyprotic acid is titrated, there are usually multiple equivalence points. For example, when H2SO3 is titrated with NaOH, there are two equivalence points corresponding to the two acidic protons from the H2SO3 molecule. There are also as many midpoints as there are equivalence points.
When a strong monoprotic base is added to a solution of a polyprotic acid, the neutralization reaction occurs in stages. The most acidic proton (Ka,1) is titrated first, followed by the next most acidic (Ka,2), and so forth. If the Ka values differ by at least three orders of magnitude, then the overall titration curve will show well-resolved “steps” corresponding to the titration of each acidic proton.
Consider the titration of a generic weak polyprotic acid H3A with NaOH as shown in Figure 5. The first equivalence point correspond to the point where 1 mole of NaOH has been added per mole of H3A in the solution being titrated. As more titrant is added, the titration curve crosses another midpoint and reaches the second equivalence point, corresponding to a total of 2 moles of NaOH being added per mole of H3A in the solution. The titration is finally complete when all three equivalence points have been reached.
It is not always possible to detect all of the equivalence points in the titration of a polyprotic acid. An actual titration of the triprotic acid H3PO4 with NaOH is illustrated in Figure 6. It shows two well-defined steps: the first midpoint corresponds to pKa,1, and the second midpoint corresponds to pKa,2. Because HPO42− is such a weak acid, pKa,3 has such a high value that the third step cannot be resolved using 0.100 M NaOH as the titrant.

The titration curve for the reaction of a polyprotic base with a strong acid is inverted on the pH scale. The initial pH is high; as acid is added, the pH decreases in steps if the successive pKb values are well separated.
Podia Question
Draw the structure of the amino acid alanine at pH = 2.
Sketch a titration curve for titration of a solution of alanine starting at pH = 2 and ending at pH = 13. The concentration of alanine is 0.100 M and there is 25.00 mL initially, at pH = 2. This solution is titrated with 0.100-M NaOH. pKa values for alanine are 2.85 and 9.87. No calculations are required, but the curve should be as accurate as possible.
There are two equivalence points and two midpoints in this titration. Label each midpoint with the volume and pH. Explain how you determined the pH at each midpoint.
Two days before the next whole-class session, this Podia question will become live on Podia, where you can submit your answer.
